Transgenic Seeds Market by Trait (Herbicide Tolerance, Insecticide Resistance), Crops (Corn, Soybean, Cotton, Canola, others), and by Region - Global Trends & Forecast to 2020


The market for transgenic seeds has a significant impact on agriculture production. Transgenic seeds are gaining better response compared to other pest control agents.
The driving factors for this market are the increasing global population and food requirements, rise in cost of fertilizers & pesticides, and easier residue management. Transgenic seeds gained popularity due to various factors, including increasing cost of seeds, production of high-quality agricultural produce, increasing rates of crop rotation, and raising awareness among farmers with respect to the increasing toxicity of the agrochemicals. Additionally, increased strive for yield maximization across the globe is encouraging the farmers to adopt transgenic seeds.
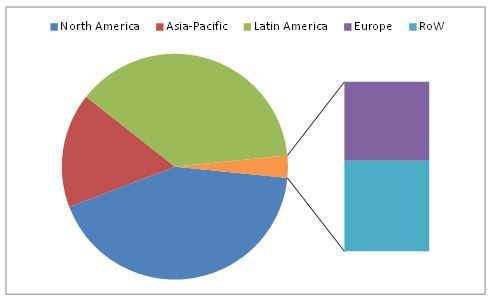
This report estimates the size of the global market in terms of value. The market has been segmented on the basis of trait, crop type, and region. In 2014, the global transgenic seeds market was led by North America, where the U.S. is a major producer. Latin America is the second-largest region with regard to the application of transgenic seeds. The crop type considered are corn, soybean, cotton, canola, and others that include fruits & vegetables, turf, ornamental & forage crop, and other cereals & oilseed crops. The global market is divided into regions and further into key country-level markets, and projected in terms of value. Drivers, restraints, opportunities, burning issues, and challenges of the market are also discussed in detail in the report.
The report provides a complete analysis of the key global players in the transgenic seeds market, with a clear insight and commentary on the developments, trends, and their product portfolio. With a huge opportunity in the market, the existing companies are experiencing a significant shift in the industry. Leading players such as Monsanto (U.S.), E.I. du Pont de Nemours & Company (U.S.), Syngenta AG (Switzerland), Vilmorin & Cie SA (France), Bayer CropScience AG (Germany), BASF SE (Germany), Dow AgroSciences LLC (U.S.) and Suntory Holdings Ltd. (Japan) have been profiled in the report. These players are executing various strategies to grow and develop in this market. Agreements, new products launches, and acquisitions have been the key moves undertaken by market players for global expansion.
Transgenic Seeds Market Share (Value), by Type, 2014
E � Estimated; P � Projected
Source: Expert Interviews, Government Authorities, Related Associations/Institutes, Related Research Publications, Government Publications, and MarketsandMarkets Analysis
Scope of the Report
This research categorizes transgenic seeds on the basis of trait, crop type, and region.
On the basis of region, this market has been segmented as follows:
- North America
- Europe
- Asia-Pacific
- Latin America
- Rest of the World (RoW)
On the basis of trait, this market has been segmented as follows:
- Herbicide Tolerance
- Insect- Resistance
- Others (modified product quality, disease resistance, and abiotic stress tolerance)
On the basis of crop type, this market has been segmented as follows:
- Corn
- Soybean
- Cotton
- Canola
- Others (fruits & vegetables, turf, ornamental & forage crop, and other cereals & oilseed crops)
The transgenic seeds market is projected to reach $35.2 Billion by 2020, at a CAGR of 12.3%, as studied from 2015.
The market for transgenic seeds has a significant impact on agricultural production. Transgenic seeds are broadly categorized based on their traits, into herbicide tolerance, insecticide resistance, and others such as modified product quality, disease resistance, and abiotic stress tolerance. The transgenic seed market is also segmented on the basis of its applications in various crop types, such as corn, soybean, cotton, canola, and others that include fruits & vegetables, turf, ornamental & forage crop, and other cereals & oilseed crops.
Transgenic plants have genes inserted into them, which are derived from another species. Through genetic modification, the aim is to introduce a new trait to the plant, which does not exist naturally in those species. The inserted genes might belong to the same kingdom or the other kingdom; for instance, the gene taken for insertion into a plant can be from another plant or from bacteria (animal kingdom). The inserted DNA needs to be modified slightly so that the gene is expressed correctly and efficiently, providing the required phenotype in the host plant.
The driving factors for this market are the increasing world population & food requirements, rise in cost of fertilizers & pesticides, and easier residue management. The transgenic seed guarantees high returns on investments with certified seeds. Transgenic seed is an example of modern agriculture practices & technology, which prevent crop loss.
Transgenic Seed Market Size, by Region, 2014 vs. 2020 ($Million)
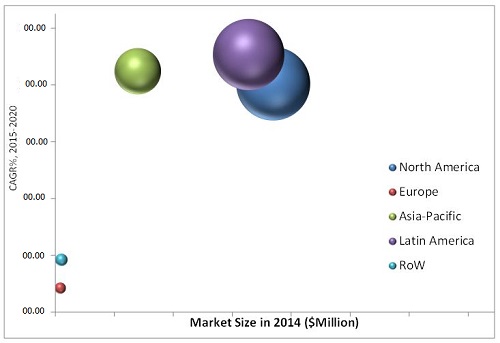
NOTE: Bubble size represents the market size of 2020, ($million)
E � Estimated; P � Projected
Source: Expert Interviews, Government Authorities, Related Associations/Institutes, Related Research Publications, Government Publications, and MarketsandMarkets Analysis
The market for transgenic seeds is projected to reach $35.2 Billion by 2020, at a CAGR of 12.3%. Latin America is the second-largest market and is projected to grow at the highest CAGR during the period under review.
The transgenic seed market of each region has witnessed the development of many subsidiaries, business units, and research centers of key players. These subsidiaries employ strategies through strong R&D and regional distribution networks with regional players so as to provide enough competition and capture significant market share.
The key players in this market have developed a range of innovative products to target specific needs. Thus, the ttransgenic seed market is gaining more global presence and acceptance among customers. Key participants in the transgenic seed market include Monsanto (U.S.), E.I. du Pont de Nemours & Company (U.S.), Syngenta AG (Switzerland), Vilmorin & Cie SA (France), Bayer CropScience AG (Germany), BASF SE (Germany), Dow AgroSciences LLC (U.S.) and Suntory Holdings Ltd. (Japan). These players are implementing different strategies to achieve growth and development in the transgenic seed market. Agreements, collaborations, and new product launches have been the key moves undertaken by market players for global expansion.
 Exclusive indicates content/data unique to MarketsandMarkets and not available with any competitors.
Table of Contents
1 Introduction (Page No. - 16)
1.1 Objectives of the Study
1.2 Market Definition
1.3 Study Scope
1.4 Markets Covered
1.4.1 Periodization Considered for this Market
1.5 Base Currency Considered for this Market
1.6 Stakeholders
1.7 Limitations
2 Research Methodology (Page No. - 20)
2.1 Research Data
2.1.1 Secondary Research
2.1.1.1 Key Data From Secondary Sources
2.1.2 Primary Research
2.1.2.1 Key Data From Primary Sources
2.1.3 Breakdown of Primaries
2.2 Factor Analysis
2.2.1 Introduction
2.2.2 Demand-Side Analysis
2.2.2.1 Increased Food Demand By the Continuously Growing Population
2.2.2.2 Developing Economies
2.2.2.3 Increasing Middle-Class Population, 2009�2030
2.2.2.4 Increased Area Under Biotech Crops
2.2.3 Supply-Side Analysis
2.2.3.1 Growing Environmental Concerns
2.2.3.2 Global Rise in Export of Pesticides
2.3 Market Size Estimation
2.3.1 Bottom-Up Approach
2.3.2 Top-Down Approach
2.4 Market Breakdown & Data Triangulation
2.5 Market Share Estimation
2.6 Research Assumptions and Limitations
2.6.1 Assumptions
2.6.2 Limitations
3 Executive Summary (Page No. - 32)
4 Premium Insights (Page No. - 36)
4.1 Extensive Market Opportunities in this Market
4.2 Transgenic Seeds Market, By Key Trait Type
4.3 Latin America: Increasing Agricultural Area Under Transgenic Seeds
4.4 Transgenic Seeds Market of Top 10 Countries, 2014
4.5 Transgenic Seeds Market: Developed vs Developing Nations
4.6 Transgenic Seeds Market Size, By Crop Type & Region
4.7 Product Growth Matrix
4.8 Life Cycle Analysis, By Region
4.9 Market Chasm Analysis
5 Market Overview (Page No. - 46)
5.1 Introduction
5.2 Evolution
5.3 Market Segmentation
5.3.1 By Trait
5.3.2 By Crop Type
5.3.3 By Region & Country
5.4 Market Dynamics
5.4.1 Drivers
5.4.1.1 Signs of Ever Increasing Agricultural Productivity
5.4.1.2 Reduction of Cost and Usage of Farm Inputs
5.4.1.3 Regulatory Limits to Pesticide Utilization
5.4.1.4 Industrial Preference for High Quality Products
5.4.2 Restraints
5.4.2.1 Stringent Rules and Regulations
5.4.2.2 Requires High R&D Support
5.4.3 Opportunity
5.4.3.1 GM Crops: Gaining Importance in Feed and Other Industries of Developing Economies
5.4.4 Challenges
5.4.4.1 Development of Resistant Genes in Pests
5.4.4.2 Chances of Ecosystem Disruption
5.4.5 Burning Issues
5.4.5.1 Severe Criticism for GM Seed Products
5.4.5.2 Issues Regarding Patent Rights
6 Industry Trends (Page No. - 62)
6.1 Introduction
6.2 Value Chain Analysis
6.3 Supply Chain Analysis
6.4 Key Influencers
6.5 Industry Insights
6.6 Porter�s Five Forces Analysis
6.6.1 Threat of New Entrants
6.6.2 Threat of Substitutes
6.6.3 Bargaining Power of Suppliers
6.6.4 Bargaining Power of Buyers
6.6.5 Intensity of Competitive Rivalry
6.7 Strategic Benchmarking
6.7.1 Significant Commercial Deals With Competitors & Crushers
6.7.2 Seeking Regulatory Clearances for Timely Launch of Products
7 Market, By Trait (Page No. - 72)
7.1 Introduction
7.2 Herbicide Tolerance (HT)
7.3 Insect Resistance (IR)
7.4 Other Commercial Traits
7.4.1 Modified Product Quality
7.4.2 Disease Resistance
7.4.3 Abiotic Stress Tolerance
8 Market, By Crop Type (Page No. - 79)
8.1 Introduction
8.2 Corn
8.3 Oilseeds
8.3.1 Soybean
8.3.2 Cotton
8.3.3 Canola
8.4 Others
8.4.1 Fruits & Vegetables
8.4.2 Alfalfa
8.4.3 Other Grain & Oilseed Crops
9 Market, By Brand (Page No. - 90)
9.1 Introduction
9.1.1 Bayer Cropscience AG
9.1.1.1 Liberty Link & Twinlink: Herbicide and Bt Protection
9.1.2 Syngenta AG
9.1.2.1 Agrisure: Corn Rootworm Control
9.1.3 The Dow Chemical Company
9.1.3.1 Enlist: Weed Control System
9.1.3.2 Widestrike
9.1.4 E.I. Du Pont De Nemours and Company
9.1.4.1 Acremax: Corn Rootworm Control
9.1.5 Monsanto
9.1.5.1 Genuity: Yield Potential & Insect Control System
10 Market, By Region (Page No. - 92)
10.1 Introduction
10.2 Pest Analysis
10.2.1 Political Factors
10.2.2 Economic Factors
10.2.3 Social Factors
10.2.4 Technological Factors
10.3 North America
10.3.1 U.S.
10.3.2 Canada
10.3.3 Mexico
10.4 Europe
10.4.1 Spain
10.4.2 Portugal
10.4.3 Czech Republic
10.4.4 Rest of Europe
10.5 Asia-Pacific
10.5.1 India
10.5.2 China
10.5.3 Pakistan
10.5.4 Australia
10.5.5 Rest of Asia-Pacific
10.6 Latin America
10.6.1 Brazil
10.6.2 Argentina
10.6.3 Rest of Latin America
10.7 Rest of the World (RoW)
10.7.1 South Africa
10.7.2 Other RoW Countries
11 Competitive Landscape (Page No. - 140)
11.1 Overview
11.2 Transgenic Seeds Market: Growth Strategies, By Company
11.3 Competitive Situation & Trends
11.4 Agreements, Collaborations, Joint Venture & Partnerships
11.5 Expansions
11.6 Mergers & Acquisitions
11.7 New Product Launches
12 Company Profiles (Page No. - 147)
12.1 Introduction
12.2 Bayer Cropscience AG
12.3 Syngenta AG
12.4 Dow Chemical Company
12.5 E.I. Du Pont De Nemours and Company
12.6 Monsanto
12.7 BASF SE
12.8 Vilmorin & Cie (Limagrain Group)
12.9 Suntory Holdings Limited
12.10 J.R. Simplot Company
12.11 Bejo Zaden B.V.
13 Appendix (Page No. - 178)
13.1 Discussion Guide
13.2 Developments
13.3 Introducing RT: Real-Time Market Intelligence
13.4 Available Customizations
13.5 Related Reports
List of Tables (71 Tables)
Table 1 Increasing Necessity to Enhance Crop Quality & Yield
Table 2 Regulatory Compliance to Be A Major Restraint for Market Growth
Table 3 Perspective on the Usage of Transgenic Crop Products Likely to Change Across the Globe
Table 4 Better Solutions Required to Face Stiff Challenges
Table 5 Issues in Patent Rights Reduces the Chances of Successful Product Launch
Table 6 Transgenic Seeds Market Size, By Trait, 2013�2020 ($Million)
Table 7 Herbicide Tolerance in Transgenic Seeds Market Size, By Region, 2013�2020 ($Million)
Table 8 Insect Resistantce in Transgenic Seeds Market Size, By Region, 2013�2020 ($Million)
Table 9 Other Commercial Traits in Transgenic Seeds Market Size, By Region, 2013�2020 ($Million)
Table 10 Transgenic Seeds Market Size, By Crop, 2013�2020 ($Million)
Table 11 Transgenic Corn Seeds Market Size, By Region, 2013�2020 ($Million)
Table 12 Transgenic Oilseeds Market Size, By Crop, 2013�2020 ($Million)
Table 13 Transgenic Soybean Seeds Market Size, By Region, 2013�2020 ($Million)
Table 14 Transgenic Cotton Seeds Market Size, By Region, 2013�2020 ($Million)
Table 15 Transgenic Canola Seeds Market Size, By Region, 2013�2020 ($Million)
Table 16 Other Transgenic Seeds Market Size, By Region, 2013�2020 ($Million)
Table 17 Transgenic Seeds Market Size, By Region, 2013�2020 ($Million)
Table 18 Pest Analysis: Transgenic Seeds Market
Table 19 North America: Transgenic Seeds Market Size, By Country, 2013�2020 ($Million)
Table 20 North America: Market Size, By Trait, 2013�2020 ($Million)
Table 21 North America: Market Size, By Crop, 2013�2020 ($Million)
Table 22 U.S.: Transgenic Seeds Market Size, By Trait, 2013�2020 ($Million)
Table 23 U.S.: Market Size, By Crop, 2013�2020 ($Million)
Table 24 Canada: Transgenic Seeds Market Size, By Trait, 2013�2020 ($Million)
Table 25 Canada: Market Size, By Crop, 2013�2020 ($Million)
Table 26 Mexico: Transgenic Seeds Market Size, By Trait, 2013�2020 ($Million)
Table 27 Mexico: Market Size, By Crop, 2013�2020 ($Million)
Table 28 Europe: Transgenic Seeds Market Size, By Country, 2013�2020 ($Million)
Table 29 Europe: Market Size, By Trait, 2013�2020 ($Million)
Table 30 Europe: Market Size, By Crop, 2013�2020 ($Million)
Table 31 Spain: Transgenic Seeds Market Size, By Trait, 2013�2020 ($Million)
Table 32 Spain: Market Size, By Crop, 2013�2020 ($Million)
Table 33 Portugal: Transgenic Seeds Market Size, By Trait, 2013�2020 ($Million)
Table 34 Portugal: Market Size, By Crop, 2013�2020 ($Million)
Table 35 Czech Republic: Transgenic Seeds Market Size, By Trait, 2013�2020 ($Million)
Table 36 Czech Republic: Market Size, By Crop, 2013�2020 ($Million)
Table 37 Rest of Europe: Transgenic Seeds Market Size, By Trait, 2013�2020 ($Million)
Table 38 Rest of Europe: Market Size, By Crop, 2013�2020 ($Million)
Table 39 Asia-Pacific: Transgenic Seeds Market Size, By Country, 2013�2020 ($Million)
Table 40 Asia-Pacific: Market Size, By Trait, 2013�2020 ($Million)
Table 41 Asia-Pacific: Market Size, By Crop, 2013-2020 ($Million)
Table 42 India: Transgenic Seeds Market Size, By Trait, 2013�2020 ($Million)
Table 43 India: Market Size, By Crop, 2013�2020 ($Million)
Table 44 China: Transgenic Seeds Market Size, By Trait, 2013�2020 ($Million)
Table 45 China: Market Size, By Crop, 2013�2020 ($Million)
Table 46 Pakistan: Transgenic Seeds Market Size, By Trait, 2013�2020 ($Million)
Table 47 Pakistan: Market Size, By Crop, 2013�2020 ($Million)
Table 48 Australia: Transgenic Seeds Market Size, By Trait, 2013�2020 ($Million)
Table 49 Australia: Market Size, By Crop, 2013�2020 ($Million)
Table 50 Rest of Asia-Pacific: Transgenic Seeds Market Size, By Trait, 2013�2020 ($Million)
Table 51 Rest of Asia-Pacific: Market Size, By Crop, 2013�2020 ($Million)
Table 52 Latin America: Transgenic Seeds Market Size, By Country, 2013�2020 ($Million)
Table 53 Latin America: Market Size, By Trait, 2013-2020 ($Million)
Table 54 Latin America: Market Size, By Crop, 2013-2020 ($Million)
Table 55 Brazil: Transgenic Seeds Market Size, By Trait, 2013�2020 ($Million)
Table 56 Brazil: Market Size, By Crop, 2013�2020 ($Million)
Table 57 Argentina: Transgenic Seeds Market Size, By Trait, 2013�2020 ($Million)
Table 58 Argentina: Market Size, By Crop, 2013�2020 ($Million)
Table 59 Rest of Latin America: Transgenic Seeds Market Size, By Trait, 2013�2020 ($Million)
Table 60 Rest of Latin America: Market Size, By Crop, 2013�2020 ($Million)
Table 61 RoW: Transgenic Seeds Market Size, By Country, 2013�2020 ($Million)
Table 62 RoW: Market Size, By Trait, 2013�2020 ($Million)
Table 63 RoW: Market Size, By Crop, 2013�2020 ($Million)
Table 64 South Africa: Transgenic Seeds Market Size, By Trait, 2013�2020 ($Million)
Table 65 South Africa: Market Size, By Crop, 2013�2020 ($Million)
Table 66 Other RoW Countries: Transgenic Seeds Market Size, By Trait, 2013�2020 ($Million)
Table 67 Other RoW Countries: Market Size, By Crop, 2013�2020 ($Million)
Table 68 Agreements, Collaborations, Joint Venture & Partnerships, 2009-2015
Table 69 Expansions, 2009-2014
Table 70 Mergers & Acquisitions, 2009-2015
Table 71 New Product Launches, 2009-2015
List of Figures (96 Figures)
Figure 1 Transgenic Seeds Market Segmentation
Figure 2 Research Design
Figure 3 Breakdown of Primary Interviews: By Company Type, Designation & Region
Figure 4 Global Population Projected to Reach ~9.5 Billion By 2050
Figure 5 Middle-Class Population in Asia-Pacific is Projected to Grow & Account for the Largest Share Globally By 2030
Figure 6 Global Analysis of Commercialized Biotech Crops, 2001�2014, (Million Hectare)
Figure 7 Export Value of Pesticides, 2002�2012 ($Million)
Figure 8 Market Size Estimation Methodology: Bottom-Up Approach
Figure 9 Market Size Estimation Methodology: Top-Down Approach
Figure 10 Market Breakdown & Data Triangulation
Figure 11 Transgenic Seeds Market Snapshot (2015 vs 2020): Herbicide Tolerance Poised for Better Future Growth ($Million)
Figure 12 Soybean: Most Attractive Market Segment for Investment in the Next Five Years
Figure 13 Latin America Projected to Register Highest Growth Rate, 2015�2020
Figure 14 Strong Growth Potential With Rising Demand From Feed & Industrial Sectors, 2015�2020 ($Million)
Figure 15 Herbicide Tolerance Trait Dominated this Market, 2014�2020 ($Million)
Figure 16 Growth Projected With Respect to Increase in Exports to Europe & Asia-Pacific, 2014
Figure 17 North America Region Had the Largest Market Share in 2014
Figure 18 Brazil & U.S. to Emerge as Strong Markets Among These Nations, 2015 vs 2020 ($Million)
Figure 19 Asia-Pacific to Pose Strong Demand for Transgenic Cotton Seeds, 2020
Figure 20 Insect Resistance is Projected to Witness Steady Growth After 4 Years
Figure 21 Latin America to Exhibit Remarkable Growth Across All Traits & Crop Segments, 2020
Figure 22 Consumer Fear & Strict Regulations Restrained the Marketability of Other GM Traits, 2014
Figure 23 Benefits of Transgenic Crops
Figure 24 Transgenic Seeds Market Evolution
Figure 25 Market, By Trait
Figure 26 Market, By Crop Type
Figure 27 Market, By Region & Country
Figure 28 Transgenic Seeds: Provides Prospective Way for Industrial Demands
Figure 29 Global Per Capita Arable Land, 1980�2050
Figure 30 Percentage of Surveillance & Enforcement Samples Non-Compliant With Mrl, 2012 vs 2013
Figure 31 Stage-Wise Cost & Time Before the Commercial Launch of GM Trait*
Figure 32 Time Taken for the Commercial Launch of GM Trait*
Figure 33 Rise in GM Crop Acreage in Latin America & Asia-Pacific, 2012 vs 2013
Figure 34 Value Chain Analysis: Major Value Added During Research & Development Phase
Figure 35 Transgenic Seeds: Links Further Key Players Across the Supply Chain
Figure 36 Key Players: Prompt to Introduce Approved Products Into the Market
Figure 37 Porter�s Five Forces Analysis
Figure 38 Strategic Benchmarking: Appreciable Business Cooperation Among Key Players
Figure 39 Strategic Benchmarking: Product Launches - Key to Achieve Growth in this Market
Figure 40 HT-Based Seeds are Gaining Popularity Among Soybean & Corn Growers
Figure 41 Increased Prevalence of Herbicide Tolerance in Transgenic Seeds in the Americas
Figure 42 Strong Growth Projected in the Asia-Pacific Region
Figure 43 Mpq Trait: Preferred as Better Stacked Trait Combination Among Consumers
Figure 44 Market for Transgenic Soybean Seeds to Exhibit High Growth Rate
Figure 45 Transgenic Corn Seeds Market in North America is Highly Prospective
Figure 46 Very High Growth to Be Observed for Transgenic Soyabeans in Latin America
Figure 47 Asia-Pacific Region to Be Boosted By Effective Adoption in India & China
Figure 48 Rising Demand for Animal Feed to Drive Growth in North America
Figure 49 North America is Observed to Be an Early Adopter of These Crops
Figure 50 Geographic Snapshot: North America to Be the Leading Transgenic Market, 2015 vs 2020 ($Million)
Figure 51 Geographic Snapshot: New Hotspots Emerging in Latin American Region, 2015�2020
Figure 52 North America: Increasing Importance to Follow Sustainable Farming Practices, 2014
Figure 53 Herbicide Tolerance: to Be the Leading Trait in Transgenic Seeds in North America, 2015 vs 2020
Figure 54 Herbicide Tolerance Trait to Be the Market Leader in the U.S., 2015 vs 2020
Figure 55 Canada: Transgenic Seeds Market Size, By Trait, 2015 vs 2020 ($Million)
Figure 56 Mexico: Transgenic Seeds Market Size, By Trait, 2015 vs 2020 ($Million)
Figure 57 Europe: Spain to Be the Transgenic Seed Leader, 2015 vs 2020 ($Million)
Figure 58 Europe: Transgenic Seeds Market Size, By Trait, 2015 vs 2020 ($Million)
Figure 59 Spain: Transgenic Seeds Market Size, By Trait, 2015 vs 2020 ($Million)
Figure 60 Portugal: Transgenic Seeds Market Size, By Trait, 2015 vs 2020 ($Million)
Figure 61 Herbicide Tolerance to Be the Primary Trait in Czech Republic
Figure 62 Rest of Europe: Transgenic Seeds Market Size, By Trait, 2015 vs 2020 ($Million)
Figure 63 Asia-Pacific: Transgenic Seeds Market Led By India, 2014
Figure 64 Asia-Pacific: Market Size, By Trait, 2015 vs 2020 ($Million)
Figure 65 India: Transgenic Seeds Market Size, By Trait, 2015 vs 2020 ($Million)
Figure 66 China: Transgenic Seeds Market Size, By Trait, 2015 vs 2020 ($Million)
Figure 67 Pakistan: Transgenic Seeds Market Size, By Trait, 2015 vs 2020 ($Million)
Figure 68 Australia: Transgenic Seeds Market Size, By Trait, 2015 vs 2020 ($Million)
Figure 69 Rest of Asia-Pacific: Transgenic Seeds Market Size, By Trait, 2015 vs 2020 ($Million)
Figure 70 Latin America: Strong Growth Observed for Herbicide-Tolerant Strains
Figure 71 Latin America: Transgenic Seeds Market Size, By Trait, 2015 vs 2020 ($Million)
Figure 72 Brazil: Transgenic Seeds Market Size, By Trait, 2015 vs 2020 ($Million)
Figure 73 Argentina: Transgenic Seeds Market Size, By Trait, 2015 vs 2020 ($Million)
Figure 74 Rest of Latin America: Transgenic Seeds Market Size, By Trait, 2015 vs 2020 ($Million)
Figure 75 RoW: Transgenic Seeds Market Size, By Trait, 2015 vs 2020 ($Million)
Figure 76 South Africa: Transgenic Seeds Market Size, By Trait, 2015 vs 2020 ($Million)
Figure 77 Other RoW Countries: Herbicide Tolerance to Lead at the Highest Growth Rate
Figure 78 Companies Adopted Various Growth Strategies 2009-2015
Figure 79 Revenues of Key Companies, 2010-2014 ($Million)
Figure 80 Transgenic Seeds Market: By Key Player, 2010-2015
Figure 81 New Product Launch Was Akey Strategy Used to Gain Market Share
Figure 82 Agreements, Collaborations & Partnerships: the Key Growth Strategy, 2009�2015
Figure 83 Geographic Revenue Mix of Top 5 Market Players
Figure 84 Bayer Cropscience AG: Company Snapshot
Figure 85 Bayer Cropscience AG: SWOT Analysis
Figure 86 Syngenta AG: Company Snapshot
Figure 87 Syngenta AG: SWOT Analysis
Figure 88 The Dow Chemical Company: Company Snapshot
Figure 89 The Dow Chemical Company: SWOT Analysis
Figure 90 E.I. Du Pont De Nemours and Company: Company Snapshot
Figure 91 E. I. Dupont De Nemours Company : SWOT Analysis
Figure 92 Monsanto: Company Snapshot
Figure 93 Monsanto: SWOT Analysis
Figure 94 BASF SE: Company Snapshot
Figure 95 Vilmorin & Cie (Limagrain Group): Company Snapshot
Figure 96 Suntory Holdings Limited: Company Snapshot


Growth opportunities and latent adjacency in Transgenic Seeds Market