
Track and Trace Solutions Market: Growth, Size, Share, and Trends

Track and Trace Solutions Market by Product (Bundle Tracking, Checkweigher, Barcode Scanner, Labeler), Serialization (Carton, Bottle, Blister, Vial), Aggregation (Case, Pallet), Technology (2D Barcode, RFID), End User, and Region - Global Forecast to 2030


OVERVIEW
Source: Secondary Research, Interviews with Experts, MarketsandMarkets Analysis
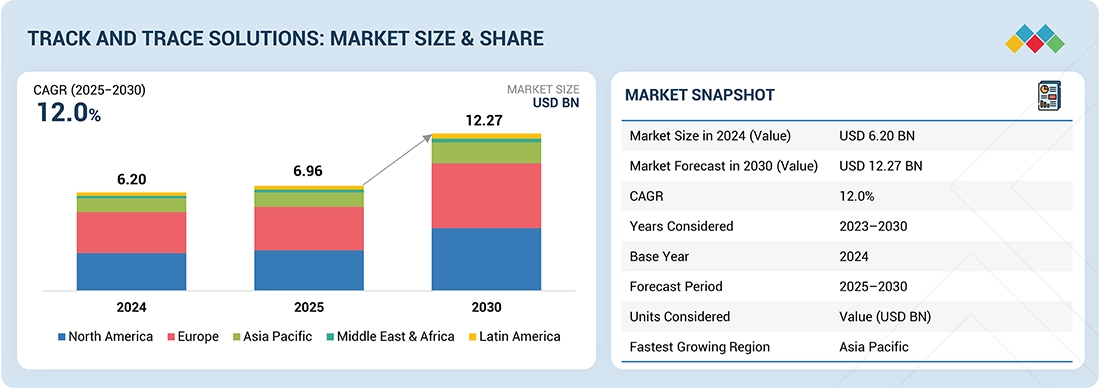
The global track and trace solutions market is projected to reach USD 12.27 billion by 2030 from USD 6.96 billion in 2025, at a high CAGR of 12.0% during the forecast period. The key drivers fueling the growth include stringent regulatory requirements and rising concerns over product authenticity. Increasing mandates by governments and international bodies for serialization, aggregation, and real-time tracking particularly in the pharmaceutical, food, and consumer goods sectors are pushing companies to adopt advanced track and trace technologies.
KEY TAKEAWAYS
- Asia Pacific is the fastest growing region with 13.8% CAGR during the forecast timeframe.
- Software solution segment accounted for largest share of 61.8% in 2024.
- Serialization solutions accounted for largest share of 63.1% in 2024
- Radiofrequency identification segment is expected to grow at the fastest CAGR throughout the forecast timeframe.
- The pharmaceutical and biopharmaceutical companies segment accounted for the largest share and are expected to grow at highest CAGR over the forecast period.
- ANTARES VISION S.p.A , Axway, Optel Group were identified as some of the star players in the Track & Trace Solutions market (global), given their strong market share and product footprint.
- TrackTrace RX Inc., Arvato, 3KEYS among others, have distinguished themselves among startups and SMEs by securing strong footholds in specialized niche areas, underscoring their potential as emerging market leaders.
The track and trace solutions market is driven by stringent regulations like the US DSCSA and EU FMD, rising brand protection concerns, and frequent packaging-related recalls. Adoption of IoT, AI, and blockchain enhances supply chain visibility, accuracy, and efficiency. Increasingly complex global distribution networks and counterfeiting risks further boost demand for serialization, RFID tagging, and end-to-end traceability solutions across pharmaceuticals, medical devices, and food sectors.
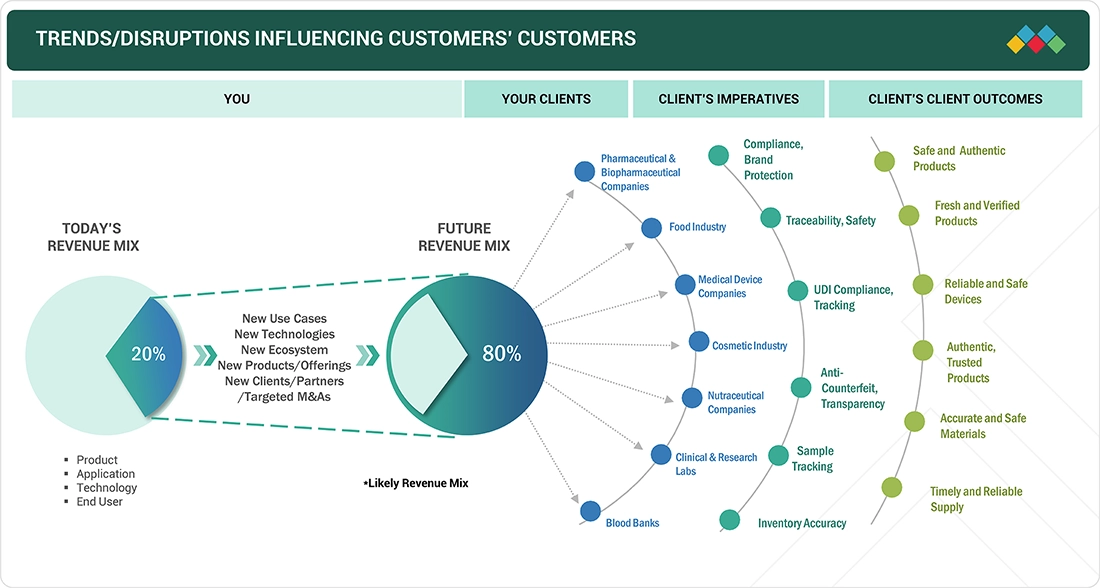
TRENDS & DISRUPTIONS IMPACTING CUSTOMERS' CUSTOMERS
The impact of trends and disruptions in the track and trace solutions market extends across the entire value chain from solution providers to end users. Rapid technological advancements, evolving regulatory frameworks, and shifting consumer expectations are driving transformation. Clients of track and trace providers such as pharmaceutical and biopharmaceutical companies, food manufacturers, medical device firms, cosmetic and nutraceutical companies, research laboratories, and blood banks are increasingly focusing on compliance, traceability, transparency, and brand protection to meet rising customer and regulatory demands. These imperatives translate into measurable outcomes such as safe and authentic products, reliable and verified devices, accurate and transparent material tracking, and timely supply assurance. As these client imperatives evolve, the business impact cascades: end users’ revenue shifts influence the revenue performance of track and trace providers and their partners. Consequently, companies that invest in innovation such as cloud-based serialization, AI-driven traceability, and connected supply chain platforms will be best positioned to capture emerging opportunities in this rapidly transforming market.
Source: Secondary Research, Interviews with Experts, MarketsandMarkets Analysis
MARKET DYNAMICS
Level
-
Stringent regulations and standards for serialization

-
Increasing focus of manufacturers on brand protection

Level
-
Long implementation timeframe of serialization and aggregation

-
Huge setup costs of technologies

Level
-
Increase in offshore pharmaceutical manufacturing

-
Remote authentication of products

Level
-
Lack of common standards for serialization and aggregation

-
Existence of technologies to deter counterfeiters

Source: Secondary Research, Interviews with Experts, MarketsandMarkets Analysis
Driver: Stringent regulations and standards for serialization
Governments worldwide are enforcing stringent serialization and traceability laws to enhance supply chain visibility, authenticity, and safety driving the global track and trace market. In Europe, the Falsified Medicines Directive (FMD) mandates serialization and verification of all licensed drug products since February 2019, requiring a unique identifier (UI) and anti-tampering device (ATD), verified through the European Medicines Verification System (EMVS). In the US, the Drug Supply Chain Security Act (DSCSA) enforces unit-level serialization and aggregation across the pharmaceutical supply chain, with full traceability targeted by 2030. The FDA’s Unique Device Identification (UDI) rule also requires medical devices to carry permanent identifiers stored in the GUDID database. In China, the NMPA’s Drug Information Traceability System covers key drugs and blood products, with 95% of hospitals and pharmacies using traceability codes as of 2025. In India, the DGFT withdrew export serialization mandates in 2025 to align with the Ministry of Health & Family Welfare’s barcode rule for over 300 drug brands, effective August 2023. Other countries including Brazil, Mexico, Argentina, Saudi Arabia, Japan, and Australia are also implementing or expanding serialization frameworks. Additionally, FDA, CDC, and USDA mandates for food traceability strengthen compliance across industries. Overall, the tightening of global serialization and UDI regulations remains a key growth driver for the track and trace solutions market.
Restraint: Long implementation timeframe of serialization and aggregation
The implementation of serialization and aggregation technologies, while essential for supply chain transparency and counterfeit prevention, presents significant financial and operational challenges for manufacturers. According to the European Federation of Pharmaceutical Industries and Associations (EFPIA), cost and implementation timelines are the primary concerns in the track and trace industry. Serialization at the product and packaging level requires substantial investment ranging from USD 50,000–270,000 per carton line and USD 270,000–470,000 per bottle line with aggregation. The complete deployment of track and trace systems across all operational levels (1–5) typically takes 15–18 months, involving high costs for software, hardware, integration, staff training, and maintenance. Advanced systems such as RFID-based solutions further increase expenses due to the need for additional infrastructure, including servers and middleware. These heavy financial requirements, coupled with the need for skilled personnel, make adoption particularly difficult for small and mid-sized manufacturers, thereby acting as a significant restraint on the growth of the global track and trace market.
Opportunity: Increase in offshore pharmaceutical manufacturing
The rapid expansion of the global pharmaceutical industry is creating strong demand for advanced track and trace solutions. According to the IMS Institute for Healthcare Informatics, global pharmaceutical sales reached USD 1.42 trillion in 2021, with emerging markets outside North America and Europe driving much of this growth. To capitalize on these opportunities, pharmaceutical manufacturers are increasingly relocating production facilities to high-growth regions that offer low-cost manufacturing, tax incentives, and favorable regulatory environments. Asia Pacific, particularly India and China, has emerged as a key hub for pharmaceutical manufacturing. According to the India Brand Equity Foundation (IBEF), India’s pharmaceutical exports were valued at USD 24.6 billion in FY 2021–2022, while its domestic market turnover reached USD 28.9 billion in 2020, up from USD 20.0 billion in 2019. A PMMI survey further indicates that nearly two-thirds of major pharmaceutical companies anticipate growth in FDA-approved manufacturing facilities across Asia Pacific and Latin America. As more manufacturers establish production bases in these emerging regions, the need for robust serialization and track and trace systems to ensure regulatory compliance, product authenticity, and efficient distribution is expected to rise significantly during the forecast period.
Challenge: Lack of common standards for serialization and aggregation
The lack of common standards for serialization and aggregation across the globe is restricting the growth of the track and trace solutions market. Various regulatory authorities worldwide have started placing greater importance on serialization in the healthcare industry (specifically for pharmaceutical products) and have issued relevant guidelines. Europe has more comprehensive and well-defined serialization guidelines than the US, where only California has defined partial serialization guidelines for pharmaceutical manufacturers. In Canada, the AIVP Advisory Task Group has announced the barcode recommendation for vaccine products, and various manufacturers have adopted these standards. In France, it is mandatory for all manufacturers in the pharmaceutical sector to ensure a specific serial number for each carton. Although the global adoption of aggregation is low, it is mandated for specific packaging levels in some countries or regions such as China, India, Turkey, Brazil, the US, South Korea, and Europe. Apart from common standards for serialization and aggregation, effective serialization depends on integration with legacy or existing IT systems in the organization. Integration with the existing information technology (IT) infrastructure is one of the most demanding tasks for track and trace solution vendors. Track and trace functionality requires the addition of specific software and application components to a company's existing IT infrastructure. Similarly, serialization solutions require to be fully integrated with centralized systems to properly allocate and manage serial numbers within the packaging process of each production line. These systems also allow the management of data communication and storage in a common corporate database to prevent data duplication. As a result, the successful integration of trace and trace solutions with the existing IT architecture is a more significant challenge for providers.
Track and Trace Solutions Market: COMMERCIAL USE CASES ACROSS INDUSTRIES
| COMPANY | USE CASE DESCRIPTION | BENEFITS |
|---|---|---|
 |
Provides end-to-end serialization, aggregation, and inspection systems for pharmaceutical, cosmetics, and food industries to ensure full product traceability from production to distribution. | Enhances product authentication, prevents counterfeiting, ensures regulatory compliance (e.g., EU FMD, DSCSA), and improves supply chain transparency. |
 |
Delivers secure data integration and API-driven connectivity solutions for track and trace ecosystems, enabling interoperability between partners, regulators, and logistics systems. | Facilitates seamless data exchange, reduces compliance complexity, and improves operational efficiency through real-time visibility. |
 |
Offers modular and scalable track and trace platforms using serialization, aggregation, and sustainability tracking technologies across pharma, food, and healthcare sectors. | Provides full supply chain visibility, enables circular economy traceability, strengthens regulatory compliance, and supports sustainability initiatives. |
 |
Cloud-based Digital Supply Network (DSN) for end-to-end pharmaceutical supply chain traceability, serialization management, and compliance reporting across global markets. | Ensures rapid compliance with evolving global regulations, enhances collaboration among supply chain partners, and reduces counterfeit risks. |
 |
Provides integrated serialization and packaging solutions for pharmaceutical companies, combining track and trace technology with packaging machinery and software. | Streamlines production and packaging, improves product integrity, supports compliance with global serialization mandates, and enhances brand protection. |
Logos and trademarks shown above are the property of their respective owners. Their use here is for informational and illustrative purposes only.
MARKET ECOSYSTEM
The ecosystem market map of the track and trace solutions market comprises the elements present in this market, and it defines these elements with a demonstration of the bodies involved. It includes products and services used in the field, along with its application areas and end users. The product category includes all hardware components, software, and standalone platforms used by industries, along with serialization and aggregation systems. The manufacturers of various track and trace solutions include the organizations involved in the entire process of research, product development, optimization, and launch. Distributors include third parties and eCommerce sites linked with the organization for the marketing of these track and trace solutions. Research and product development include in-house research facilities and contract research organizations, as well as contract development and manufacturing organizations that play a key role in outsourcing services for product development to manufacturers. End users are the areas where these track and trace solutions are adopted during various stages of the product’s entire supply chain. These end customers are the key stakeholders in the supply chain of the track and trace solutions market. On the other hand, investors/funders and health regulatory bodies are the major influencers in this market.
Logos and trademarks shown above are the property of their respective owners. Their use here is for informational and illustrative purposes only.
MARKET SEGMENTS
Source: Secondary Research, Interviews with Experts, MarketsandMarkets Analysis
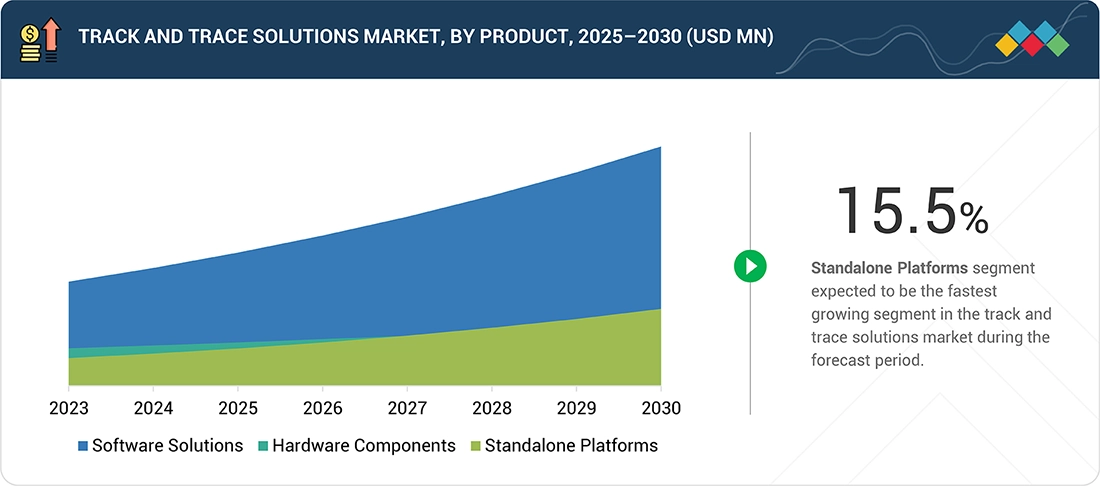
Track and Trace Solutions Market, By Product
In 2024, the software solutions segment accounted for the largest market share driven by the increasing awareness about secure packaging and the growing awareness of brand protection. Software solutions are used to manage the whole serialization, aggregation, and track and trace process. They also help to integrate serialization and aggregation into standard business processes. The major factors driving the growth of the software solutions market are rising awareness of anti-counterfeit technologies, an increasing focus of manufacturers on brand protection & secure packaging, and the need to ensure regulatory compliance. The software solutions market is further segmented into plant managers, enterprise & network managers, line controllers, bundle tracking, warehouse & shipment managers, case tracking, and pallet tracking solutions. The plant managers segment accounted for the largest share followed by enterprise & network managers.
Track and Trace Solutions Market, By Application
In 2024, the serialization solutions segment held the largest share of the track and trace solutions market driven by expanding regulatory mandates for product serialization across global healthcare supply chains. Serialization involves assigning a unique identification code including serial number, batch number, origin, and shelf life to each product unit, enabling end-to-end traceability from manufacturing to dispensing. Based on type, serialization solutions include bottle, carton, blister, vial & ampoule, and medical device serialization. Among these, the carton serialization segment is projected to grow at the highest CAGR during the forecast period, owing to its extensive use in pharmaceutical packaging. This process uses 2D data matrix codes scanned and transmitted in real time to ensure product integrity and visibility. Globally, regulatory authorities such as the US FDA, European Commission, and Health Canada are mandating serialization to curb counterfeiting and enhance supply chain security. In the EU, the Falsified Medicines Directive (FMD) requires full serialization and verification of drug packages, while in the US, the Drug Supply Chain Security Act (DSCSA) enforces unit-level serialization for all pharmaceutical manufacturers and distributors to achieve complete traceability. Despite implementation challenges and varying standards, serialization remains central to anti-counterfeit efforts worldwide. Leading market players include OPTEL Group (Canada), Uhlmann (Germany), TraceLink Inc. (US), Antares Vision S.p.A. (Italy), Mettler Toledo (US), and Siemens (Germany), all offering advanced technologies that support compliance, automation, and supply chain transparency.
Track and Trace Solutions Market, By Technology
In 2024, the 2D barcodes segment accounted for the largest share in the track and trace solutions market, driven by their superior data storage capacity, space efficiency, and reliability compared to traditional linear barcodes. 2D barcodes encode information both horizontally and vertically, allowing them to store significantly more data within a compact image. This makes them ideal for pharmaceutical, medical device, and logistics packaging applications, where detailed product and regulatory data must be captured on limited surface areas. Their high data density, omnidirectional scanning, and low error rates further enhance operational efficiency across supply chains. The widespread adoption of 2D barcode technology is supported by its multiple benefits, including improved inventory management, accurate data capture, enhanced product authentication, and streamlined recall management. Additionally, 2D barcodes enable consumer-level product verification via smartphones and reader devices, strengthening brand protection and anti-counterfeiting measures. Overall, the ability of 2D barcodes to deliver greater traceability, efficiency, and security has led to their dominant market share in 2024 and continues to drive their growing use across diverse end-user industries.
Track and Trace Solutions Market, By End User
In 2024, pharmaceutical and biopharmaceutical companies accounted for the largest share of the track and trace solutions market, as these industries face significant challenges related to drug counterfeiting, theft, and regulatory compliance. Track and trace systems have become essential tools for securing the pharmaceutical supply chain, ensuring product authenticity, and maintaining brand integrity. The global counterfeit drug market, estimated by the International Trade Administration at USD 75–200 billion, represents a major threat—particularly in emerging economies such as China, India, and South Africa, where counterfeit medicines account for up to 50% of total sales. Serialization and traceability technologies help mitigate these risks by enabling real-time product tracking, authentication, and recall management, significantly reducing the circulation of fake drugs. Governments and regulatory authorities worldwide have implemented stringent serialization and labeling laws. In the EU, the Directive 2011/62/EU (Falsified Medicines Directive) mandates tamper-proof packaging and unique identifiers for all medicinal products. In the US, the Drug Supply Chain Security Act (DSCSA) and California’s ePedigree Law require serialization for all prescription drugs. Such regulatory developments are fueling adoption of advanced serialization, aggregation, and verification systems among drug manufacturers. K
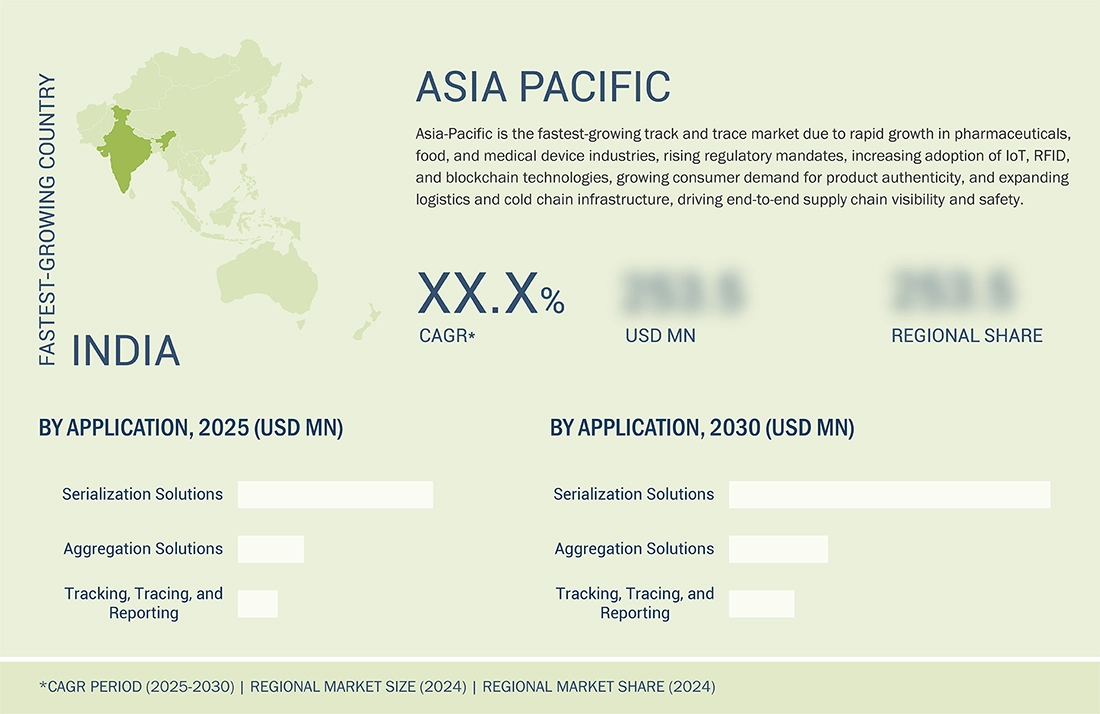
REGION
Asia Pacific to be fastest-growing region in global track and trace solutions market during the forecast period
Asia Pacific to be the fastest-growing region in global track and trace market during the forecast period. The rapid market expansion is driven by growing regulatory requirements in the healthcare sector to ensure manufacturing and distribution compliance, the rising number of pharmaceutical and biotechnology companies, and strong economic growth across emerging economies such as China and India. China and India represent the fastest-growing markets in the region, supported by their expanding pharmaceutical manufacturing capacities and the implementation of stringent serialization and traceability mandates to safeguard product authenticity throughout the supply chain. Both countries are witnessing increasing demand for aseptic pharmaceutical packaging including pre-fillable inhalers and syringes driven by the growth of patient-administered parenteral therapies. Moreover, the surge in flexible packaging adoption has encouraged manufacturers to integrate track and trace-enabled packaging machinery to improve operational efficiency and ensure regulatory compliance. However, challenges remain, particularly around non-compliance risks related to serialization, aggregation, and product safety standards, which can impact production continuity and regulatory approval. Despite these hurdles, strong government initiatives and continuous investment in digital supply chain technologies position the Asia Pacific region as a key growth engine for the global track and trace solutions market.
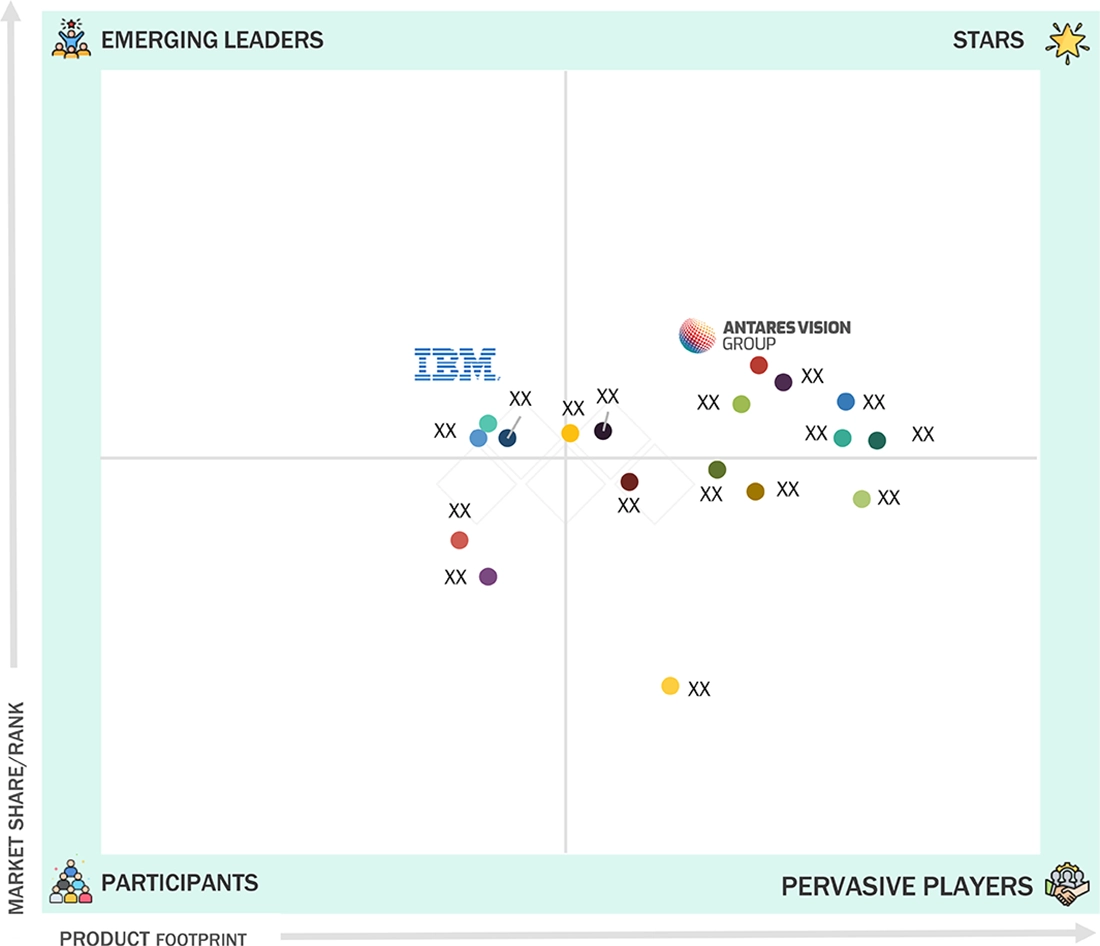
Track and Trace Solutions Market: COMPANY EVALUATION MATRIX
In the track and trace solutions market matrix, ANTARES VISION S.P.A (Star) leads with the comprehensive product portfolio, strong global presence, and deep integration capabilities across pharmaceutical and FMCG industries, reflecting its dominance in serialization, aggregation, and inspection technologies. IBM (Emerging Leader) is gaining momentum with its blockchain-powered traceability platforms, advanced data analytics, and AI-driven supply chain visibility solutions. While ANTARES VISION S.P.A maintains leadership through scale and technology depth, IBM shows strong potential to advance toward the Leaders’ Quadrant amid rising demand for advanced track and trace solutions.
Source: Secondary Research, Interviews with Experts, MarketsandMarkets Analysis
KEY MARKET PLAYERS
MARKET SCOPE
| REPORT METRIC | DETAILS |
|---|---|
| Market Size in 2024 (Value) | USD 6.20 Billion |
| Market Forecast in 2030 (value) | USD 12.27 Billion |
| Growth Rate | CAGR of 12.0% from 2025-2030 |
| Years Considered | 2023-2030 |
| Base Year | 2024 |
| Forecast Period | 2025-2030 |
| Units Considered | Value (USD Billion) |
| Report Coverage | Revenue forecast, company ranking, competitive landscape, growth factors, and trends. |
| Segments Covered |
|
| Regions Covered | North America, Asia Pacific, Europe, Latin America, Middle East & Africa |
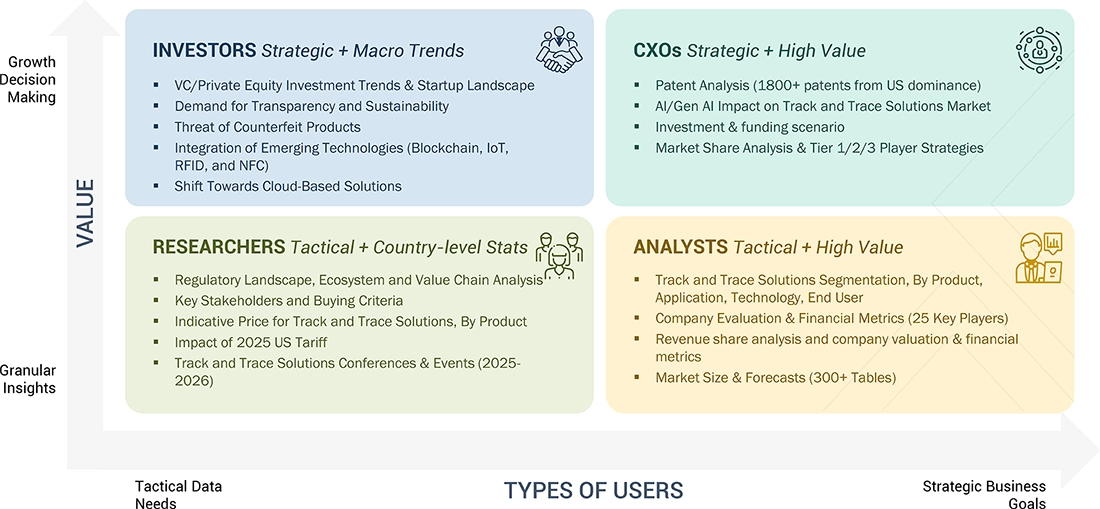
WHAT IS IN IT FOR YOU: Track and Trace Solutions Market REPORT CONTENT GUIDE
DELIVERED CUSTOMIZATIONS
We have successfully delivered the following deep-dive customizations:
| CLIENT REQUEST | CUSTOMIZATION DELIVERED | VALUE ADDS |
|---|---|---|
| Blood Tracking Market | Developed a comprehensive, country-level database capturing total market size, production, and consumption by country. Compiled detailed lists of donation centers and blood processing units, including RFID adoption rate, type, and volume. Conducted blood consumption analysis across hospitals and transfusion centers. Evaluated blood wastage and loss by cause (expiry, storage, logistics). Mapped blood management software suppliers and their RFID/IoT integration maturity. | Provided granular visibility into regional market potential and regulatory influence. Delivered operational insights on RFID adoption maturity, supply chain digitization, and high-demand facility identification. Supported ROI evaluation for RFID-enabled solutions and helped design strategies to reduce wastage, optimize inventory, and benchmark vendors for partnerships. Enabled evidence-based decision-making for technology integration and market entry strategies. |
| Track & Trace Solution (US Region) | Conducted a technology landscape assessment of real-time tracking systems for medical devices using RFID, IoT, barcoding, and emerging technologies (Bluetooth LE, UDI-based tracking, AI-enabled sterilization tracking). Benchmarked 10+ competitors (Cognex, Zebra, TrackCore, Mettler Toledo) on technology, offerings, and financials. Mapped end-to-end implant lifecycle workflows from sterilization to post-implant monitoring. Validated insights via primary research with hospitals, ASCs, and subject matter experts. | Clarified technology readiness levels and adoption gaps in healthcare facilities. Supported strategic R&D and next-gen product planning, enhanced competitive positioning, and optimized solution integration roadmap. Delivered US-specific insights with actionable recommendations for workflow efficiency, regulatory compliance, and market penetration. Enabled faster adoption of innovative tracking technologies while reducing implementation risk. |
RECENT DEVELOPMENTS
- September 2024 : Antares Vision S.P.A. and Renata Ltd. entered into partnership agreement to implement a comprehensive serialization and traceability system. This collaboration aims to enhance the transparency and safety of the pharmaceutical supply chain in Bangladesh.
- December 2023 : Axway launched the 5.3 release of Axway Track & Trace introducing significant upgrades to the Product ID Verification feature and enhancements across various other functionalities. The priduct also includes the ability to automatically generate events that update the packaging hierarchy of a serial number.
- August 2022 : Antares Vision S.P.A. expanded its footprint in the food and beverage sector by acquiring Packital Srl and Ingg. Vescovini Srl, both based in Italy. These acquisitions will enhance its portfolio with complementary inspection and quality control solutions.
- May 2022 : Optel Group launched OPTCHAIN, a suite of modular Intelligent Supply Chain (ISC) solutions. These solutions are designed to streamline the capture and digitization of Critical Tracking Events (CTEs) and Key Data Elements (KDEs) across the food and beverage industry's supply chain.
Table of Contents
 Exclusive indicates content/data unique to MarketsandMarkets and not available with any competitors.
Methodology
The study involved several key activities to estimate the current size of the track and trace solutions market. Extensive secondary research was conducted to gather information on this market. The next step was to validate the findings, assumptions, and size estimates by consulting industry experts throughout the value chain through primary research. Various methods, including top-down and bottom-up approaches, were employed to estimate the overall market size. Following this, market segmentation and data triangulation techniques were used to determine the size of specific segments and subsegments within the track and trace solutions market.
Secondary Research
This research study involved the wide use of secondary sources, directories, and databases such as Dun & Bradstreet, Bloomberg Business, and Factiva; white papers, annual reports, and companies’ in-house documents; investor presentations; and the SEC filings of companies. The market for companies providing the track and trace solutions is assessed using secondary data from both paid and free sources. This involves analyzing the product portfolios of major players in the industry and evaluating these companies based on their performance and quality. Various resources were utilized in the secondary research process to gather information for this study. The sources include annual reports, press releases, investor presentations, white papers, academic journals, certified publications, articles by recognized authors, directories, and databases.
The secondary research process involved referring to various secondary sources to identify and collect information related to the study. These sources included annual reports, press releases, investor presentations of the track and trace solutions vendors, forums, certified publications, and whitepapers. The secondary research was used to obtain critical information on the industry’s value chain, the total pool of key players, market classification, and segmentation from the market and technology-oriented perspectives.
Primary Research
In the primary research process, various sources from both the supply and demand sides were interviewed to obtain qualitative and quantitative information for this report. Primary sources are mainly industry experts from the core and related industries and preferred suppliers, manufacturers, distributors, technology developers, researchers, and organizations related to all segments of this industry’s value chain. In-depth interviews were conducted with various primary respondents, including key industry participants, subject-matter experts, C-level executives of key market players, and industry consultants, among other experts, to obtain and verify the critical qualitative and quantitative information as well as assess prospects.
Primary research was conducted to identify segmentation types; industry trends; key players; and key market dynamics such as drivers, restraints, opportunities, challenges, industry trends, and strategies adopted by key players.
After completing the market engineering process, which includes calculations for market statistics, market breakdown, size estimations, forecasting, and data triangulation, extensive primary research was conducted. This research aimed to gather information and verify the critical numbers obtained during the market analysis. Additionally, primary research was conducted to identify different types of market segmentation, analyze industry trends, evaluate the competitive landscape of track and trace solutions offered by various players, and understand key market dynamics such as drivers, restraints, opportunities, challenges, industry trends, and strategies employed by key market participants.
In the complete market engineering process, the top-down and bottom-up approaches and several data triangulation methods were extensively used to perform the market estimation and market forecasting for the overall market segments and subsegments listed in this report. Extensive qualitative and quantitative analysis was performed on the complete market engineering process to list the key information/insights throughout the report.
Breakdown of Primary Respondents:

Note 1: Others include sales, marketing, and product managers.
Note 2: Tiers are defined based on a company’s total revenue. As of 2024: Tier 1 = >USD 1 billion, Tier 2 = USD 500 million to USD 1 billion, and Tier 3 = < USD 500 million.
To know about the assumptions considered for the study, download the pdf brochure
Market Size Estimation
The market size estimates and forecasts provided in this study are derived through a mix of the bottom-up approach (revenue share analysis of leading players) and top-down approach (assessment of utilization/adoption/penetration trends, by product, application, technology, end user, and region).

Data Triangulation
After arriving at the overall market size, using the market size estimation processes, the market was split into several segments and subsegments. To complete the overall market engineering process and arrive at the exact statistics of each market segment and subsegment, the data triangulation and market breakdown procedures were employed, wherever applicable. The data was triangulated by studying various factors and trends from both the demand and supply sides in the track and trace solutions market.
Market Definition
Track and trace solutions help determine the current and past locations of a product throughout the supply chain. This can be done using information such as product numbers and batch numbers to ensure that a product and its locations can be tracked. These solutions capture a product’s status throughout the value chain, and its path can be retrospectively identified and verified to improve supply chain efficiency. This report provides a close look at the track and trace solutions market.
Stakeholders
- Track And Trace Solution Manufacturers, Suppliers, and Distributors
- Original Equipment Manufacturers (OEMs)
- Hardware System Manufacturers
- Track & Trace Software Providers
- Pharmaceutical and Biotechnology Companies
- Medical Device Companies
- Cosmetic Product Manufacturers and Distributors
- Clinical Laboratories
- Food Manufacturers and Packaging Companies
- Contract Research Organizations (CROs)
- Medical Device Research and Consulting Firms
- Academic and Research Institutes
- Government Associations
- Market Research and Consulting Firms
- Venture Capitalists and Investors
Report Objectives
- To define, describe, and forecast the global track and trace solutions market by product, application, technology, end user, and region
- To provide detailed information regarding the major factors influencing the growth of the market (such as drivers, restraints, opportunities, and challenges)
- To analyze micromarkets with respect to individual growth trends, prospects, and contributions to the overall track and trace solutions market
- To assess the track and trace solutions market with regard to Porter’s Five Forces, regulatory landscape, value chain, ecosystem map, patent protection, and key stakeholders’ buying criteria
- To analyze opportunities in the market for stakeholders and provide details of the competitive landscape for market leaders
- To forecast the size of the track and trace solutions market with respect to five main regions, namely, North America, Europe, Asia Pacific, Latin America, and the Middle East & Africa
- To profile the key players in the track and trace solutions market and comprehensively analyze their core competencies and market shares
- To track and analyze competitive developments such as agreements, partnerships, acquisitions, expansions, product launches & enhancements, and R&D activities in the track and trace solutions market
Key Questions Addressed by the Report
Which are the top industry players in the global track and trace solutions market?
ANTARES VISION S.p.A (Italy), Axway (France), OPTEL GROUP (Canada), TraceLink Inc. (US), Syntegon Technology GmbH (Germany), ACG (India), and Marchesini Group S.p.A. (Italy).
Which products have been included in the track and trace solutions market report?
Software solutions, hardware components, and standalone platforms.
Which geographical region dominates the global track and trace solutions market?
North America is projected to hold the largest share during the forecast period.
Which end user segments have been included in the track and trace solutions market report?
Pharmaceutical and biopharmaceutical companies, food industry, medical device companies, cosmetic industry, and other end users.
What is the total CAGR expected to be recorded for the track and trace solutions market during the forecast period?
The market is expected to record a CAGR of 12.0% during the forecast period.
Need a Tailored Report?
Customize this report to your needs
Get 10% FREE Customization
Customize This ReportPersonalize This Research
- Triangulate with your Own Data
- Get Data as per your Format and Definition
- Gain a Deeper Dive on a Specific Application, Geography, Customer or Competitor
- Any level of Personalization
Let Us Help You
- What are the Known and Unknown Adjacencies Impacting the Track and Trace Solutions Market
- What will your New Revenue Sources be?
- Who will be your Top Customer; what will make them switch?
- Defend your Market Share or Win Competitors
- Get a Scorecard for Target Partners

Custom Market Research Services
We Will Customise The Research For You, In Case The Report Listed Above Does Not Meet With Your Requirements
Get 10% Free CustomisationGrowth opportunities and latent adjacency in Track and Trace Solutions Market


Donald
Jun, 2022
How the key players are supposed to dominate the global Track and Trace Solutions Market?.
Douglas
Jun, 2022
Which of the segments is expected to hold most of the share of the global Track and Trace Solutions Market?.
Mark
Jun, 2022
Which factors are responsible for restraining the global growth of Track and Trace Solutions Market?.