Touchscreen Controller Market by Technology (Resistive & Capacitive), Interface (I2C, SPI, USB), Touchscreen Technology (Single-Touch & Multi-Touch), Screen Size (Small & Medium, and Large), Application, and Geography - Global Forecast to 2022


The Touchscreen Controller Market was valued at USD 3.68 Billion in 2015 and is expected to reach USD 9.11 Billion by 2022, at a CAGR of 15.2% during the forecast period. The base year considered for study is 2015 and the forecast period is between 2016 and 2022.
The objective of the report is to provide a detailed analysis of the market based on technology, interface, touchscreen technology, screen size, application and geography. The report provides detailed information regarding the major factors influencing the growth of the market. The report also gives a detailed overview of the value chain of the touchscreen controller market. Emergence of internet of things, growing application of touchscreens in automobiles and wearable devices are a major driver for the market. Additionally, some of significant opportunities in the future for the touchscreen controllers are the growing trends of touch-screens in the banking and educational sectors.
The touchscreen controller market was valued at USD 3.68 Billion in 2015 and is expected to reach USD 9.11 Billion by 2022, at a CAGR of 15.2% between 2016 and 2022. The growth of this market is being propelled by the growing deployment of capacitive touchscreen controllers in various in consumer electronics devices such as smartphones, tablets, laptops, wearable devices, and others. Besides, the durability, reliability and better operation of capacitive touchscreen controllers as compared to the resistive touch controllers, is further increasing the demand for the same, and thereby driving the market for the touchscreen controller alongside.
The report covers the touchscreen controller market segmented on the basis of technology, interface, touchscreen technology, screen size, application and geography. The capacitive controller technology led the market due to the high demand for capacitive technology from various devices in consumer electronics as well as commercial applications. Besides, the major factors responsible for increasing the popularity of capacitive touchscreen controllers are highly responsive nature and they provide a real-time feel while minimizing power consumption.
The market for multi-touchscreen technology is expected to witness significant growth during the forecast period. The rapidly increasing devices which require touchscreen technology supporting multi-touch features have driven the market for touchscreen controllers complying with the requirements of multi-touchscreen technology. The major applications that use multi-touch panels include consumer electronics such as smartphones, tablet, wearable devices, laptops, and other electronic devices, whereas commercial applications include infotainment systems in automotive, and e-boards in education sectors, among others.
The commercial segment is expected to grow at the high market rate of the touchscreen controller market during the forecast period. Technological advancements in various segments such as healthcare, automotive, banking, retail, education & training have resulted into the development of innovative and modernized touch-based devices. These applications use touchscreen to enhance the user experience and encourage interactivity. The rapidly growing increasing installation of touch-based ATMs and Kiosk systems and the growing demand for infotainment systems in vehicles is expected to drive this market.
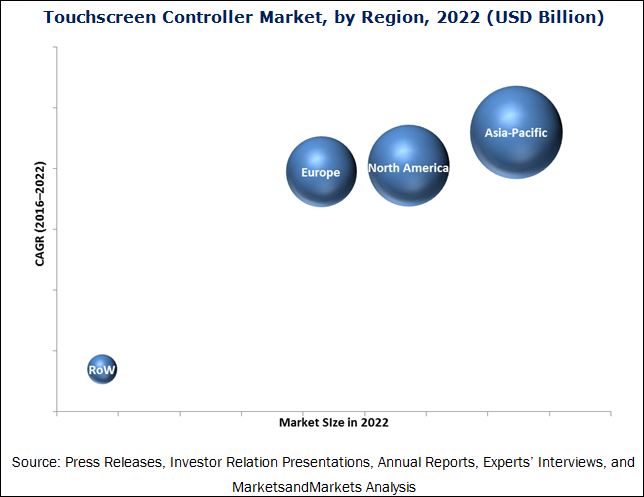
Asia-Pacific held the largest size of the touchscreen controller market in 2015. The leading position of Asia-Pacific can be attributed to the wide presence of a number of leading consumer electronics manufacturers such as Sony Corp. (Japan), Samsung SDI Co., Ltd. (South Korea), HTC Corp (Taiwan), Panasonic Corp. (Japan), Huawei Technologies Co., Ltd. (China), and LG Electronics Inc. (South Korea), among others in the region.
The key restraining factors for the growth of the touchscreen controller market is the technical complications to obtain the right refresh rate and power consumption in accordance to the requirements of the rapidly changing touch-screen devices. This report describes the drivers, restraints, opportunities, and challenges pertaining to the market. Additionally, it analyzes the current scenario and forecasts the market till 2022, including the market segmentation basis of technology, interface, touchscreen technology, screen size, application and geography.
Some of the major companies operating in the touchscreen controller market include Microchip Technology Incorporated (U.S.), Synaptics Incorporated (U.S.), STMicroelectronics N.V. (Switzerland), Cypress Semiconductor Corporation (U.S.), Texas Instruments Inc. (U.S.), Broadcom Limited (U.S.), Analog Devices Inc. (U.S.), Melfas Incorporated (Korea), Elan Microelectronics Corp. (Taiwan), NXP Semiconductors N.V. (Netherlands), Integrated Device Technology, Inc. (U.S.), and Samsung Electronics Co. Ltd. (South Korea), among others.
To speak to our analyst for a discussion on the above findings, click Speak to Analyst
 Exclusive indicates content/data unique to MarketsandMarkets and not available with any competitors.
Table of Contents
1 Introduction (Page No. - 15)
1.1 Objectives of the Study
1.2 Market Definition
1.3 Scope of the Study
1.3.1 Markets Covered
1.3.2 Geographic Scope
1.3.3 Years Considered for the Study
1.4 Currency
1.5 Limitations
1.6 Stakeholders
2 Research Methodology (Page No. - 20)
2.1 Research Data
2.1.1 Secondary Data
2.1.1.1 Key Data From Secondary Sources
2.1.2 Primary Data
2.1.2.1 Key Data From Primary Sources
2.1.2.2 Key Industry Insights
2.1.2.3 Breakdown of Primaries
2.2 Market Size Estimation
2.2.1 Bottom-Up Approach
2.2.2 Top-Down Approach
2.3 Market Breakdown & Data Triangulation
2.4 Research Assumptions
3 Executive Summary (Page No. - 29)
4 Premium Insights (Page No. - 34)
4.1 Touchscreen Controller Market Expected to Have A Huge Growth Opportunity in APAC
4.2 Market, By Technology (2016–2022)
4.3 Market, By Region and Application
4.4 Market, By Region (2016)
4.5 Market, By Interface
5 Market Overview (Page No. - 37)
5.1 Introduction
5.2 Market Segmentation
5.2.1 Market, By Technology
5.2.2 Market, By Interface
5.2.3 Market, By Touchscreen Technology
5.2.4 Market, By Screen Size
5.2.5 Market, By Application
5.2.6 Market, By Geography
5.3 Market Dynamics
5.3.1 Drivers
5.3.1.1 High Demand for Capacitive Touchscreen Technology
5.3.1.2 Increasing Use of Touchscreens in Automobiles
5.3.1.3 Wearable Electronics Driving the Demand for Touchscreen Controller
5.3.2 Restraints
5.3.2.1 Technical Complications in Obtaining the Right Refresh Rate and Power Consumption
5.3.3 Opportunities
5.3.3.1 Growing Trend of Touchscreens in the Banking and Educational Sectors
5.3.3.2 Digitization and Iot to Open Up New Growth Avenues
5.3.4 Challengesss
5.3.4.1 Dealing With the Rising Competition in the Market
6 Industry Trends (Page No. - 44)
6.1 Introduction
6.2 Value Chain Analysis
6.3 Porter’s Five Forces Model
6.3.1 Threat of New Entrants
6.3.2 Threat of Substitutes
6.3.3 Bargaining Power of Suppliers
6.3.4 Bargaining Power of Buyers
6.3.5 Intensity of Competitive Rivalry
7 Touchscreen Controller Market, By Technology (Page No. - 52)
7.1 Introduction
7.2 Resistive Touchscreen Controller
7.2.1 4-Wire Resistive Touchscreen Technology
7.2.2 5-Wire Resistive Touchscreen Technology
7.2.3 8-Wire Resistive Touchscreen Technology
7.3 Capacitive Touchscreen Controller
7.3.1 Projected Capacitive Touchscreen Technology
7.3.2 Surface Capacitive Touchscreen Technology
8 Touchscreen Controller Market, By Interface (Page No. - 59)
8.1 Introduction
8.2 Inter-Integrated Circuit
8.3 Serial Peripheral Interface
8.4 Universal Serial Bus
8.5 Universal Asynchronous Receiver / Transmitter (UART)
8.6 Human Interface Device Over Universal Serial Bus
9 Touchscreen Controller Market, By Touchscreen Technology (Page No. - 64)
9.1 Introduction
9.2 Single-Touch
9.3 Multi-Touch
10 Touchscreen Controller Market, By Screen Size (Page No. - 70)
10.1 Introduction
10.2 Small & Medium Screen Size
10.3 Large Screen Size
11 Touchscreen Controller Market, By Application (Page No. - 77)
11.1 Introduction
11.2 Consumer Electronics
11.2.1 Smartphones
11.2.2 Tablets
11.2.3 Laptops & Pcs
11.2.4 Wearable Devices
11.2.5 Smart Homes
11.2.6 Gaming Devices
11.2.7 Other Consumer Electronics
11.3 Commercial
11.3.1 Automotive
11.3.2 Point of Sale
11.3.3 Education & Training
11.3.4 Healthcare
11.3.5 Banking
11.4 Industrial
11.5 Other Application Areas
12 Geographic Analysis (Page No. - 112)
12.1 Introduction
12.2 North America
12.2.1 U.S.
12.2.1.1 The U.S. is Expected to Be the Largest Market for Touchscreen Controllers in 2016
12.2.2 Canada
12.2.2.1 Canada Expected to Grow at the Highest Rate in the North American Market
12.2.3 Mexico
12.2.3.1 Proactive Initiatives Taken By Mexican Government Helping the Market to Grow
12.3 Europe
12.3.1 U.K.
12.3.1.1 A Significant Market for Touchscreen Controller in Banking
12.3.2 Germany
12.3.2.1 Germany Held the Largest Share of the European Market in 2015
12.3.3 France
12.3.3.1 Huge Potential for the Development of the Market
12.3.4 Rest of Europe
12.3.4.1 Opportunity From Medical Device and Consumer Electronics Applications
12.4 Asia-Pacific
12.4.1 China
12.4.1.1 Increasing Consumer Electronics Production Fueling the Chinese Market
12.4.2 Japan
12.4.2.1 Presence of Key Manufacturers Driving the Market in This Country
12.4.3 South Korea
12.4.3.1 Held the Largest Share of the Asia-Pacific Touchscreen Controller Market in 2015
12.4.4 Rest of Asia-Pacific
12.4.4.1 Rest of APAC: India & Australia are Emerging Markets With Significant Potential
12.5 Rest of the World
12.5.1 South America
12.5.1.1 Developing Market for Tablets is Expected to Drive Future Growth
12.5.2 Middle East
12.5.2.1 Infrastructure Development and Automotive Sector in the Middle East Would Drive This Market
12.5.3 Africa
12.5.3.1 Africa to Hold A Significant Share of the RoW Market for Touchscreen Controller
13 Competitive Landscape (Page No. - 131)
13.1 Overview
13.2 Market Ranking Analysis, 2015
13.3 Competitive Situation and Trends
13.3.1 New Product Launches
13.3.2 Collaborations & Partnerships
13.3.3 Acquisitions & Mergers
13.3.4 Divestiture
14 Company Profiles (Page No. - 138)
(Overview, Products and Services, Financials, Strategy & Development)*
14.1 Introduction
14.2 Cypress Semiconductor Corporation
14.3 Microchip Technology Incorporated
14.4 Stmicroelectronics N.V.
14.5 Synaptics Incorporated
14.6 Texas Instruments Incorporated
14.7 Analog Devices, Inc.
14.8 ELAN Microelectronics Corp.
14.9 Integrated Device Technology, Inc.
14.10 Melfas Incorporated
14.11 NXP Semiconductors N.V.
14.12 Samsung Electronics Co., Ltd
14.13 Broadcom Limited
*Details on Overview, Products and Services, Financials, Strategy & Development Might Not Be Captured in Case of Unlisted Companies.
15 Appendix (Page No. - 165)
15.1 Insights of Industry Experts
15.2 Discussion Guide
15.3 Knowledge Store: Marketsandmarkets’ Subscription Portal
15.4 Introducing RT: Real-Time Market Intelligence
15.5 Available Customizations
15.6 Related Reports
List of Tables (69 Tables)
Table 1 Market Size, in Terms of Value and Volume, 2013–2022
Table 2 Market, By Technology, 2013–2022 (USD Million)
Table 3 Market for Resistive Technology, By Application, 2013–2022 (USD Million)
Table 4 Market for Capacitive Technology, By Application, 2013–2022 (USD Million)
Table 5 Touchscreen Controllers Market, By Interface, 2013–2022 (USD Million)
Table 6 Market, By Touchscreen Technology, 2013–2022 (USD Million)
Table 7 Market for Single-Touch Technology, By Application, 2013–2022 (USD Million)
Table 8 Market for Multi-Touch Technology, By Application, 2013–2022 (USD Million)
Table 9 Market, By Screen Size, 2013–2022 (USD Million)
Table 10 Market for Small & Medium Screen Size, By Application, 2013–2022 (USD Million)
Table 11 Market for Large Screen Size, By Application, 2013–2022 (USD Million)
Table 12 Market, By Application, 2013–2022 (USD Million)
Table 13 Market, By Application, 2013–2022 (Million Units)
Table 14 Touchscreen Controller Market for Consumer Electronics Application, By Type, 2013–2022 (USD Million)
Table 15 Market for Consumer Electronics Application, By Type, 2013–2022 (Million Units)
Table 16 Market for Consumer Electronics, By Technology, 2013–2022 (USD Million)
Table 17 Market for Consumer Electronics Application, By Touchscreen Technology, 2013–2022 (USD Million)
Table 18 Market for Consumer Electronics, By Screen Size, 2013–2022 (USD Million)
Table 19 Market for Consumer Electronics Application, By Region, 2013–2022 (USD Million)
Table 20 Market for Smartphone Application, By Technology, 2013–2022 (USD Million)
Table 21 Market for Smartphone Application, By Screen Size, 2013–2022 (USD Million)
Table 22 Market for Tablet Application, By Technology, 2013–2022 (USD Million)
Table 23 Market for Tablet Application, By Screen Size, 2013–2022 (USD Million)
Table 24 Market for Laptop & Pc Application, By Technology, 2013–2022 (USD Million)
Table 25 Market for Laptop & Pc Application, By Screen Size, 2013–2022 (USD Million)
Table 26 Market for Wearable Devices Application, By Technology, 2013–2022 (USD Million)
Table 27 Market for Wearable Devices Application, By Screen Size, 2013–2022 (USD Million)
Table 28 Market for Smart Home Application, By Technology, 2013–2022 (USD Million)
Table 29 Market for Smart Home Application, By Screen Size, 2013–2022 (USD Million)
Table 30 Market for Gaming Device Application, By Technology, 2013–2022 (USD Million)
Table 31 Market for Gaming Device Application, By Screen Size, 2013–2022 (USD Million)
Table 32 Market for Other Consumer Electronics, By Technology, 2013–2022 (USD Million)
Table 33 Market for Other Consumer Electronics, By Screen Size, 2013–2022 (USD Million)
Table 34 Touchscreen Controller Market for Commercial Application, By Type, 2013–2022 (USD Million)
Table 35 Market for Commercial Application, By Type, 2013–2022 (Million Units)
Table 36 Market for Commercial Application, By Technology, 2013–2022 (USD Million)
Table 37 Market for Commercial Application, By Touchscreen Technology, 2013–2022 (USD Million)
Table 38 Market for Commercial Application, By Screen Size, 2013–2022 (USD Million)
Table 39 Market for Commercial Application, By Region, 2013–2022 (USD Million)
Table 40 Market for Automotive Application, By Technology, 2013–2022 (USD Million)
Table 41 Market for Automotive Application, By Screen Size, 2013–2022 (USD Million)
Table 42 Touchscreen Controller Market for Point of Sale, By Technology, 2013–2022 (USD Million)
Table 43 Market for Point of Sale, By Screen Size, 2013–2022 (USD Million)
Table 44 Market for Education & Training Application, By Technology, 2013–2022 (USD Million)
Table 45 Market for Education and Training Application, By Screen Size, 2013–2022 (USD Million)
Table 46 Market for Healthcare Application, By Technology, 2013–2022 (USD Million)
Table 47 Market for Healthcare Application, By Screen Size, 2013–2022 (USD Million)
Table 48 Market for Banking Application, By Technology, 2013–2022 (USD Million)
Table 49 Market for Banking Application, By Screen Size, 2013–2022 (USD Million)
Table 50 Market for Industrial Application, By Technology, 2013–2022 (USD Million)
Table 51 Market for Industrial Application, By Touchscreen Technology, 2013–2022 (USD Million)
Table 52 Market for Industrial Application, By Screen Size, 2013–2022 (USD Million)
Table 53 Market for Industrial Application, By Region, 2013–2022 (USD Million)
Table 54 Market for Other Applications, By Technology, 2013–2022 (USD Million)
Table 55 Market for Other Applications, By Region, 2013–2022 (USD Million)
Table 56 Market, By Region, 2013–2022 (USD Million)
Table 57 Market in North America, By Country, 2013–2022 (USD Million)
Table 58 Market in North America, By Application, 2013–2022 (USD Million)
Table 59 Market in Europe, By Country, 2013–2022 (USD Million)
Table 60 Market in Europe, By Application, 2013–2022 (USD Million)
Table 61 Touchscreen Controller Market in Asia-Pacific, By Country, 2013–2022 (USD Million)
Table 62 Market in Asia-Pacific, By Application, 2013–2022 (USD Million)
Table 63 Market in RoW, By Region, 2013–2022 (USD Million)
Table 64 Market in RoW, By Application, 2013–2022 (USD Million)
Table 65 Market: Market Ranking Analysis (2015)
Table 66 Most Significant New Product Launches in the Market
Table 67 Most Significant Collaborations and Partnerships in the Market
Table 68 Most Significant Agreements and Contracts in the Market
Table 69 Most Significant Other Developments in the Market
List of Figures (83 Figures)
Figure 1 Markets Covered
Figure 2 Market: Research Design
Figure 3 Market: Bottom-Up Approach
Figure 4 Market: Top-Down Approach
Figure 5 Market Breakdown & Data Triangulation
Figure 6 Assumptions of the Research Study
Figure 7 Touchscreen Controller: Market Segmentation
Figure 8 Market Snapshot (2016 vs 2022): Capacitive Technology Expected to Hold the Largest Share of the Touchscreen Controller Market Between 2016 and 2022
Figure 9 Small-& Medium-Screen Size to Hold the Largest Market Size During the Forecast Period (2016 and 2022)
Figure 10 Market for Commercial Application Expected to Grow at the Highest Rate During the Forecast Period (2016 -2022)
Figure 11 Asia-Pacific Estimated to Hold the Largest Share of the Market in (2016)
Figure 12 Attractive Growth Opportunities in the Market Between 2016 and 2022
Figure 13 Capacitive Touchscreen Controllers to Hold the Largest Market Size During the Forecast Period
Figure 14 Asia-Pacific to Hold the Largest Share of the Touchscreen Controllers Market in 2016
Figure 15 U.S. to Hold the Largest Share of the Global Market in 2016
Figure 16 Inter-Integrated Circuit Interface to Grow at the Highest Rate Between 2016 and 2022
Figure 17 Drivers, Restraints, Opportunities, and Challenges in the Market
Figure 18 Major Value Addition Done During the Manufacturing & Assembly Phase
Figure 19 Porter’s Five Forces Analysis - 2015
Figure 20 Impact Analysis: Touchscreen Controller Market
Figure 21 Medium Impact of Threat of New Entrants on the Market
Figure 22 Low Impact of Threat of Substitutes in the Market
Figure 23 Low Impact of Bargaining Power of Suppliers in the Market
Figure 24 High Impact of Bargaining Power of Buyers in the Market
Figure 25 High Impact of Intensity Rivalry in the Market
Figure 26 Market, By Technology
Figure 27 Market for Capacitive Technology Expected to Grow at the Highest Rate Between 2016 and 2022
Figure 28 Consumer Electronics Application Expected to Hold the Largest Size of the Market for Resistive Technology During the Forecast Period
Figure 29 Commercial Application of the Market for Capacitive Technology Expected to Grow at the Highest Rate Between 2016 and 2022
Figure 30 Touchscreen Controllers Market, By Interface
Figure 31 Inter-Integrated Circuit Interface to Witness the Highest Growth Rate Between 2016 and 2022
Figure 32 Market, By Touchscreen Technology
Figure 33 Multi-Touch Technology Market Expected to Grow at the Highest Rate Between 2016 and 2022
Figure 34 Commercial Application to Grow at the Highest Rate in the Market for the Single-Touch Technology During the Forecast Period
Figure 35 Consumer Electronics Application to Lead the Multi-Touch Technology Between 2016 and 2022
Figure 36 Touchscreen Controllers Market, By Screen Size
Figure 37 Small-& Medium-Sized Touchscreen Market Expected to Grow at the Highest Rate in the Market Between 2016 and 2022
Figure 38 Consumer Electronics Application Expected to Lead the Small & Medium Size Touchscreen Market By 2022
Figure 39 Commercial Application of the Market for Large Screen Size Expected to Grow at the Highest Rate During the Forecast Period
Figure 40 Market, By Application
Figure 41 Commercial Application of the Touch Screen Controller Market Expected to Grow at the Highest Rate Between 2016 and 2022
Figure 42 Multi-Touch Screen Technology Expected to Dominate the Market for Consumer Electronics Application By 2022
Figure 43 Capacitive Technology to Lead the Market for Smartphone Application Between 2016 and 2022
Figure 44 Capacitive Technology of the Market for Laptop & Pc Application Expected to Grow at the Highest Rate Between 2016 and 2022
Figure 45 Capacitive Technology of the Market for Smart Home Application to Hold A Large Size in 2016
Figure 46 Large-Size Screen of Market for Other Consumer Electronics Expected to Grow at the Highest Rate Between 2016 and 2022
Figure 47 Automotive Expected to Dominate the Market for Commercial Application By 2022
Figure 48 Europe to Hold the Largest Size of the Market for Commercial Application Between 2016 and 2022
Figure 49 Capacitive Technology to Lead the Market for Point of Sale Application Between 2016 and 2022
Figure 50 Large-Size Screen to Hold the Largest Size of the Market for Education and Training Application Between 2016 and 2022
Figure 51 Capacitive Technology to Grow at the Highest Rate for the Market for Banking Application Between 2016 and 2022
Figure 52 Multi-Touch Technology Expected to Dominate the Market for Industrial Application By 2022
Figure 53 Asia-Pacific to Lead the Market for Industrial Application Between 2016 and 2022
Figure 54 North America to Hold the Largest Size of the Touchscreen Controller Market for Other Applications Between 2016 and 2022
Figure 55 Geographic Snapshot : Touchscreen Controllers Market (2016-2022)
Figure 56 Asia-Pacific to Hold the Largest Share of the Market in 2016
Figure 57 North America Market Snapshot: Demand Expected to Be Driven By Consumer Electronics Application in the Near Future
Figure 58 Market in Canada Expected to Grow at the Highest Rate Between 2016 and 2022
Figure 59 Germany to Grow at the Highest Rate in the European Market for Touchscreen Controller Between 2016 and 2022
Figure 60 Asia-Pacific Market Snapshot: Market Expected to Be Driven By the Consumer Electronics Application
Figure 61 South Korea Expected to Lead the Market in Asia-Pacific Between 2016 and 2022
Figure 62 Market in the Middle East to Grow at the Highest Rate Between 2016 and 2022
Figure 63 Companies Adopted New Product Launch as the Key Growth Strategy Between 2015 and 2016
Figure 64 Market Evaluation Framework
Figure 65 Battle for Developmental Share: New Product Launch Was the Key Strategy
Figure 66 Geographic Revenue Mix of Top Market Players
Figure 67 Cypress Semiconductor Corporation.: Company Snapshot
Figure 68 Cypress Semiconductor Corporation.: SWOT Analysis
Figure 69 Microchip Technology Incorporated.: Company Snapshot
Figure 70 Microchip Technology Incorporated.: SWOT Analysis
Figure 71 Stmicroelectronics N.V.: Company Snapshot
Figure 72 Stmicroelectronics N.V.: SWOT Analysis
Figure 73 Synaptics Incorporated: Company Snapshot
Figure 74 Synaptics Incorporated.: SWOT Analysis
Figure 75 Texas Instruments Incorporated.: Company Snapshot
Figure 76 Texas Instruments Inc.: SWOT Analysis
Figure 77 Analog Devices, Inc.: Company Snapshot
Figure 78 ELAN Microelectronics Corp.: Company Snapshot
Figure 79 Integrated Device Technology, Inc.: Company Snapshot
Figure 80 Melfas Incorporated.: Company Snapshot
Figure 81 NXP Semiconductors N.V.: Company Snapshot
Figure 82 Samsung Electronics Co. Ltd.: Company Snapshot
Figure 83 Broadcom Limited: Company Snapshot
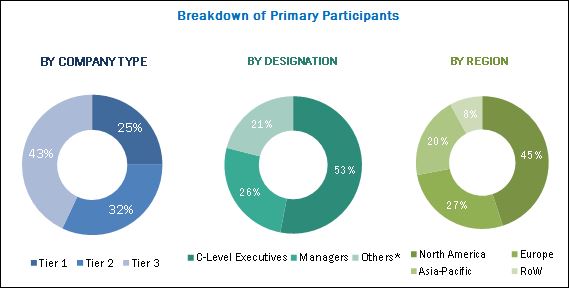
The research methodology used to estimate and forecast the touchscreen controller market begins with obtaining data on key vendor revenues through secondary research and leading players’ newsletters and whitepapers. The vendor offerings have also been taken into consideration to determine the market segmentation. The bottom-up procedure has been employed to arrive at the overall size of the global market from the revenue of key players. After arriving at the overall market size, the total market has been split into several segments and subsegments, which have then been verified through primary research by conducting extensive interviews of people holding key positions in the industry such as CEOs, VPs, directors, and executives. The market breakdown and data triangulation procedures have been employed to complete the overall market engineering process and arrive at the exact statistics for all segments and subsegments. The breakdown of the profiles of primaries has been depicted in the figure given below.
To know about the assumptions considered for the study, download the pdf brochure
The touchscreen controller ecosystem comprises raw material vendors and touch screen controller manufacturers, third party logistics providers and distributors. The players involved in the development of touchscreen controller include Microchip Technology Incorporated (U.S.), Synaptics Incorporated (U.S.), STMicroelectronics N.V. (Switzerland), Cypress Semiconductor Corporation (U.S.), Texas Instruments Inc. (U.S.), Broadcom Limited (U.S.), Analog Devices Inc. (U.S.), NXP Semiconductors N.V. (Netherlands), Integrated Device Technology, Inc. (U.S.) and Samsung Electronics Co. Ltd. (South Korea) among others.
Target audience of the report:
- Government bodies, venture capitalists, and private equity firms
- Manufacturers of Touch screen manufacturers
- Research institutes and organizations
- Raw chemical suppliers and distributors
- Touchscreen controller manufacturers
- Touchscreen controller in various industries such as consumer electronics, automotive, healthcare, banking, retail, industrial, and many others
This study answers several questions for the stakeholders, primarily which market segments to focus on in the next two to five years for prioritizing efforts and investments.
Scope of the Report:
This research report categorizes the global touchscreen controller market on the basis of technology, interface, touchscreen technology, screen size, application and geography.
Based on Technology, the Touchscreen Controller Market been Segmented as below:
- Resistive
- Capacitive
Based on Interface, the Touchscreen Controller Market been Segmented as below:
- I2C (Inter-Integrated Circuit)
- Serial Peripheral Interface
- USB (Universal Serial Bus)
- UART (Universal Asynchronous Receiver/Transmitter)
- HID over USB
Based on Touchscreen Technology, the Touchscreen Controller Market been Segmented as below:
- Single-touch Technology
- Multi-touch Technology
Based on Screen Size, the Touchscreen Controller Market been Segmented as below:
- Small & Medium
- Large
Based on Application, the Touchscreen Controller Market been Segmented as below:
- Introduction
-
Consumer Electronics
- Smart Phones
- Tablets
- Laptops & PCs
- Smart Home
- Wearable Devices
- Gaming Devices
- Other
-
Commercial
- Automotive
- Point of Sale
- Education & Training
- Healthcare
- Banking
- Industrial
- Others
Based on Region, the Touchscreen Controller Market been Segmented as below:
-
North America
- U.S.
- Canada
- Mexico
-
Europe
- U.K.
- Germany
- France
- Rest of Europe
-
Asia-Pacific
- China
- Japan
- South Korea
- Rest of APAC
-
Rest of the World
- South America
- Middle East
- Africa
Available Customizations:
With the given market data, MarketsandMarkets offers customizations according to the companies’ specific needs. The following customization options are available for the report:
Company Information:
Detailed analysis and profiling of additional market players (up to five)


Growth opportunities and latent adjacency in Touchscreen Controller Market