Top Drive Systems Market by Type (Electric & Hydraulic), Application (Onshore & Offshore), Vessel Type (Jackup, Drillship, Semi-Submersible), & by Region (North & South Americas, Europe, APAC, Middle East & Africa) - Global Trends & Forecasts to 2020


[172 Pages Report] With increasing demand for drilling rigs, the top drive market is expected to grow as they are directly proportional to the number of drilling rigs installed. Top drives are used for onshore or offshore rigs, and can be hydraulic or electric. Earlier, the use of top drives was uncommon and rotary table/Kelly was used for the same purpose. It is used to facilitate the drilling process of a borehole. It is situated on a drilling rig, provides torque to the drill string, and makes the drilling process easy.
The factors driving the top drive market include increase in exploration and production activities, technological developments, increasing safety concerns, increasing energy need from emerging economies, and technical & commercial benefits offered by them. The rise in the demand for energy and an increase in the number of drilling rigs have raised the importance of top drives.
Currently, electric top drive accounts for about 88.2% of the global top drive market, in terms of market size, followed by hydraulic top drive, which holds 11.8% of the total share. Among various regions, North America held the largest market size of more than $500 Million in 2014.
Scope of the report: This study estimates the global top drive market till 2020. It also offers a detailed qualitative and quantitative analysis of the market. This report provides a comprehensive review of the major market drivers, restraints, opportunities, challenges, winning imperatives, and key issues of the market.
Various secondary sources such as encyclopedias, directories, and databases have been used to identify and collect information that was useful for this extensive commercial study of the global top drive market. Primary sources experts, manufacturers, and service providers from the industry have all been interviewed to obtain and verify critical information as well as assess future prospects of the top drive market.
On the basis of type: Hydraulic and Electric
On the basis of application: onshore and offshore- jackup, drillship, and semisubmersible
On the basis of region: Asia-Pacific, South America, the Middle East, Africa, Europe, and North America
The major companies with their market revenue have been covered for each of the regions mentioned above. This report also deals with market share of participants for the overall market, and describes the competitive strategies adopted by these players. The market segmentation has also been done on the basis of application. The leading players of the industry have been profiled with their recent developments and other strategic industry activities. A few top players of the industry include National Oilwell Varco (U.S.), Tesco Corporation (U.S.), Canrig Drilling Technology Limited (U.S.), Cameron International Corporation (U.S.), Aker Solutions AS (Norway), Axon Energy Products (U.S.), Bentec GMBH Drilling & Oilfield Systems (Germany), Foremost (Canada), Honghua Group Limited (China), and Warrior Manufacturing Service Limited (Canada).
The global top drive market is estimated to reach $1,541.6 Million by 2020, at a projected CAGR of 5.7% during the forecast period, indicating a high demand in onshore and offshore applications. The electric top drive market is estimated to reach a value of $1,381.3 Million whereas the hydraulic top drive market is projected to reach $160.3 Million by 2020.
Top drive is a device on a drilling rig that provides rotational force to facilitate the process of drilling a wellbore; earlier rotary table was used for the same purpose. They are basically an innovative technology to replace Kelly and rotary table, and can be defined as a hydraulic or electrical motor suspended in the mast of the drilling rig. It drives and rotates the drill string and bit, hence making the drilling process easy. Growth in drilling & exploration activities and increasingly strict environmental regulations and norms related to safer oil exploration activities are expected to be the major drivers of the market globally.
Furthermore, with the current declining oil price scenario, there is a fall in demand for top drives due to a decrease in the drilling rig count in 2015; it is estimated that the total rig count has fallen to around 500 rigs. Therefore, the top drive market has seen a slight dip in 2015; however, it is expected to regain its growth from 2016.
Top drives play a significant role in reducing hazards and the overall cost of drilling activities. It will continue to be the predominant method of drilling wells in the future. The biggest markets for top drives include North America, Europe, Asia Pacific, Africa, the Middle East, and South America. The figure below shows the global top drive market by region in 2014.
Top Drive Market Share (Value), by Region, 2014
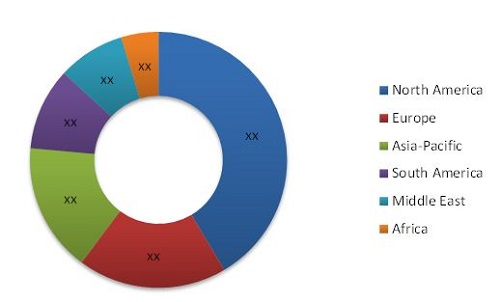
Source: MarketsandMarkets Analysis
 Exclusive indicates content/data unique to MarketsandMarkets and not available with any competitors.
Table of Contents
1 Introduction (Page No. - 15)
1.1 Objectives of the Study
1.2 Market Definition
1.3 Study Scope
1.3.1 Markets Covered
1.3.2 Years Considered for the Study
1.4 Currency
1.5 Limitations
1.6 Stakeholders
2 Research Methodology (Page No. - 18)
2.1.1 Secondary Data
2.1.1.1 Key Data From Secondary Sources
2.1.2 Primary Data
2.1.2.1 Key Data From Primary Sources
2.1.2.2 Key Industry Insights
2.1.2.3 Breakdown of Primary Interviews
2.2 Market Size Estimation
2.2.1 Top Down Approach
2.2.2 Bottom-Up Approach
2.3 Market Breakdown & Data Triangulation
2.4 Research Assumptions
3 Executive Summary (Page No. - 27)
4 Premium Insights (Page No. - 32)
4.1 Attractive Market Opportunities in Top Drive Market
4.2 North America: the Fastest Growing Market in the Coming Years for Top Drives
4.3 Life Cycle Analysis, By Region
4.4 Top Drive Marke : Top Four Country
5 Market Overview (Page No. - 38)
5.1 Introduction
5.2 Market Segmentation
5.2.1 By Type
5.2.1.1 Hydraulic Top Drive
5.2.1.2 Electric Top Drive
5.3 Market Dynamics
5.3.1 Drivers
5.3.1.1 Increasing Deepwater Drilling Activities
5.3.1.2 Technical and Commercial Benefits of Top Drive Systems
5.3.1.3 Development of Unconventional Reserves
5.3.1.4 Increase in Demand for Drilling Rigs
5.3.2 Restraints
5.3.2.1 Development of Unconventional Reserves Require Multimillion-Dollar Investments
5.3.3 Opportunities
5.3.3.1 Operational Land Rig Demand to Rise By 40% By 2020
5.3.3.2 North America Becomes the Leader in Drilling Activities
5.3.3.3 Increase in International Spending
5.3.4 Challenges
5.3.4.1 Environmental Concerns & Oil Spills
5.3.4.2 Political Issues & Technological Incompetence
5.4 Impact of Market Dynamics
6 Industry Trends (Page No. - 45)
6.1 Introduction
6.2 Value Chain Analysis
6.3 Porter�s Five Forces Analysis
6.3.1 Threat of Substitutes
6.3.2 Threat of New Entrants
6.3.3 Bargaining Power of Buyers
6.3.4 Bargaining Power of Suppliers
6.3.5 Degree of Competition
7 Offhsore Drilling Rig Market (Page No. - 50)
7.1 Introduction
7.1.1 Semisubmersibles
7.1.2 Drillships
7.1.3 Jackup Rigs
7.1.4 Tender Rigs
7.1.5 Platform Rigs
7.2 Offshore Rig Supply Overview
7.2.1 The U.S. Gulf of Mexico (U.S. GOM)
7.2.2 West Africa/Mediterranean
7.2.3 North Sea
7.2.4 Middle East
7.2.1 South East Asia/India
7.2.2 South America
7.2.3 Mexico
7.2.4 Others
7.3 Offshore Rigs Newbuilds
7.3.1 Jackup Newbuilds Deliveries
7.3.1.1 Jackups New Build Deliveries, 2014
7.3.1.2 Jackup Newbuild Deliveries, 2015
7.3.1.3 Jackup Newbuild Deliveries, 2016+
7.3.2 Drillships Newbuilds Deliveries
7.3.2.1 Drillships Newbuild Deliveries, 2014
7.3.2.2 Drillships Newbuild Deliveries, 2015
7.3.2.3 Drillships Newbuild Deliveries, 2016
7.3.2.4 Drillships Newbuild Deliveries, 2017+
7.3.3 Semisubmersibles New Builds Deliveries
7.3.3.1 Semisubmersibles New Build Deliveries, 2014
7.3.3.2 Semisubmersibles Newbuild Deliveries, 2015
7.3.3.3 Semisubmersibles Newbuild Deliveries, 2016
7.3.3.4 Semisubmersibles Newbuild Deliveries, 2017+
8 Top Drive Market, By Application (Page No. - 67)
8.1 Introduction
8.2 Onshore Application
8.3 Offshore Application
8.3.1 Offshore Top Drive Market, By Vessel Type
8.3.2 Jackup Rigs
8.3.3 Semisubmersible Rigs
8.3.4 Drillships
9 Top Drive Market, By Type (Page No. - 75)
9.1 Introduction
9.2 Electric Top Drives
9.3 Hydraulic Top Drives
10 Top Drive Market, By Region (Page No. - 81)
10.1 Introduction
10.2 North America
10.2.1 By Country
10.2.1.1 U.S.
10.2.1.2 Canada
10.2.1.3 Mexico
10.2.2 By Types
10.2.3 By Application
10.2.3.1 By Vessel Type
10.3 Europe
10.3.1 By Country
10.3.1.1 Russia
10.3.1.2 Norway
10.3.1.3 U.K.
10.3.1.4 Others
10.3.2 By Type
10.3.3 By Application
10.3.3.1 By Vessel Type
10.4 Asia-Pacific
10.4.1 By Country
10.4.1.1 China
10.4.1.2 Australia
10.4.1.3 India
10.4.1.4 Others
10.4.2 By Type
10.4.3 By Application
10.4.3.1 By Vessel Type
10.5 South America
10.5.1 By Country
10.5.1.1 Argentina
10.5.1.2 Venezuela
10.5.1.3 Brazil
10.5.1.4 Colombia
10.5.1.5 Others
10.5.2 By Type
10.5.3 By Application
10.5.3.1 By Vessel Type
10.6 Middle East
10.6.1 By Country
10.6.1.1 Saudi Arabia
10.6.1.2 Iraq
10.6.1.3 Oman
10.6.1.4 Kuwait
10.6.1.5 UAE
10.6.1.6 Others
10.6.2 By Type
10.6.3 By Application
10.6.3.1 By Vessel Type
10.7 Africa
10.7.1 By Country
10.7.1.1 Nigeria
10.7.1.2 Algeria
10.7.1.3 Egypt
10.7.1.4 Others
10.7.2 By Type
10.7.3 By Application
10.7.3.1 By Vessel Type
11 Competitive Landscape (Page No. - 113)
11.1 Overview
11.2 Market Share Analysis
11.3 Competitive Situations & Trends
11.3.1 Contracts & Agreements
11.3.2 New Product Developments
11.3.3 Mergers & Acquisitions
11.3.4 Expansions
11.3.5 Other Developments
12 Company Profiles (Page No. - 126)
(Company at A Glance, Recent Financials, Products & Services, Strategies & Insights, & Recent Developments)*
12.1 Introduction
12.2 Aker Solutions
12.3 Cameron International Corporation
12.4 Honghua Group Limited
12.5 National Oilwell Varco, Inc.
12.6 Tesco Corporation
12.7 Axon Energy Products
12.8 Bentec GmbH Drilling & Oilfield Systems
12.9 Canrig Drilling Technology Limited
12.10 Daqing Jinghong Petroleum Equipment Corporation
12.11 Foremost
12.12 Panjin Liaohe Oilfield Tianyi Petroleum Equipment Company Limited
12.13 Warrior Manufacturing Services Limited
*Details on Company at A Glance, Recent Financials, Products & Services, Strategies & Insights, & Recent Developments Might Not Be Captured in Case of Unlisted Companies.
13 Appendix (Page No. - 166)
13.1 Insights of Industry Experts
13.2 Discussion Guide
13.3 Available Customizations
13.4 Introducing RT: Real Time Market Intelligence
13.5 Related Reports
List of Tables (89 Tables)
Table 1 Impact of Market Dynamics
Table 2 U.S. Gulf of Mexico: Mobile Offshore Drilling Rig Count, 2012�2014
Table 3 West Africa/Mediterranean: Mobile Offshore Drilling Rig Count, 2012�2014
Table 4 North Sea: Mobile Offshore Drilling Rig Count, 2012-2014
Table 5 Middle East: Mobile Offshore Drilling Rig Count, 2012�2014
Table 6 South East Asia/India: Mobile Offshore Drilling Rig Count, 2012�2014
Table 7 South America: Mobile Offshore Drilling Rig Count, 2012�2014
Table 8 Mexico: Mobile Offshore Drilling Rig Count, 2012�2014
Table 9 Others: Mobile Offshore Drilling Rig Count, 2012�2014
Table 10 Global Jackup Newbuild Deliveries, 2014�2016+
Table 11 Global Jackup Newbuild Deliveries, 2014
Table 12 Global Jackup Newbuild Deliveries, 2015
Table 13 Global Jackup Newbuild Deliveries, 2016+
Table 14 Global Drillship Newbuild Deliveries, 2014�2017+
Table 15 Global Drillship Newbuild Deliveries, 2014
Table 16 Global Drillship Newbuild Deliveries, 2015
Table 17 Global Drillship Newbuild Deliveries, 2016
Table 18 Global Drillship Newbuild Deliveries, 2017+
Table 19 Global Semisubmersibles Newbuild Deliveries, 2014�2017+
Table 20 Global Semisubmersibles Newbuild Deliveries, 2014
Table 21 Global Semisubmersibles Newbuild Deliveries, 2015
Table 22 Global Semisubmersibles Newbuild Deliveries, 2016
Table 23 Global Semisubmersibles Newbuild Deliveries, 2017
Table 24 Top Drive Market Size, By Application, 2013-2020($Million)
Table 25 Onshore Top Drive Market Size, By Region, 2013-2020
Table 26 Offshore Application Top Drive Market Size, By Region, 2013-2020 ($Million)
Table 27 Offshore Top Drive Market Size, By Vessel Type, 2013-2020 ($Million)
Table 28 Jackup Rig Top Drive Market Size, By Region, 2013-2020($Million)
Table 29 Semisubmersibles Top Drive Market Size, By Region, 2013-2020 ($Million)
Table 30 Drillship Top Drive Market Size, By Region, 2013-2020 ($Million)
Table 31 Top Drive Market Size, By Type, 2013-2020 ($Million)
Table 32 Electric Top Drive Market Size, By Region, 2013-2020 ($Million)
Table 33 Hydraulic Top Drive Market Size, By Region, 2013-2020($Million)
Table 34 Top Drive Market Size, By Region, 2013�2020($Million)
Table 35 North America: Top Drive Market Size, By Country, 2013�2020($Million)
Table 36 U.S.: Top Drive Market Size, By Country, 2013�2020 ($Million)
Table 37 Canada: Top Drive Market Size, By Type, 2013�2020 ($Million)
Table 38 Mexico: Top Drive Market Size, By Type, 2013�2020($Million)
Table 39 North America: Top Drive Market Size, By Type, 2013�2020($Million)
Table 40 North America: Top Drive Market Size, By Application, 2013�2020 ($Million)
Table 41 North America: Offshore Top Drive Market Size, By Vessel Type, 2013�2020 ($Million)
Table 42 Europe: Top Drive Market Size, By Country, 2013�2020 (Million)
Table 43 Russia: Top Drive Market Size, By Type, 2013�2020 ($Million)
Table 44 Norway: Top Drive Market Size, By Type, 2013�2020 ($Million)
Table 45 U.K.: Top Drive Market Size, By Type, 2013�2020 (Million)
Table 46 Others: Top Drive Market Size, By Type, 2013�2020 ($Million)
Table 47 Europe: Top Drive Market, By Type, 2013�2020 ($Million)
Table 48 Europe: Top Drive Market Size, By Application, 2013�2020 ($Million)
Table 49 Europe: Offshore Top Drive Market Size, By Vessel Type, 2013�2020 ($Million)
Table 50 Asia-Pacific: Top Drive Market Size, By Country, 2013�2020($Million)
Table 51 China: Top Drive Market Size, By Type, 2013�2020 ($Million)
Table 52 Australia: Top Drive Market Size, By Type, 2013�2020 ($Million)
Table 53 India: Top Drive Market Size, By Type, 2013�2020 ($Million)
Table 54 Others: Top Drive Market Size, By Type, 2013�2020 ($Million)
Table 55 Asia-Pacific: Top Drive Market Size, By Type, 2013�2020 ($Million)
Table 56 Asia-Pacific: Top Drive Market Size, By Application, 2013�2020 ($Million)
Table 57 Asia-Pacific: Top Drive Market Size, By Vessel Type, 2013�2020 ($Million)
Table 58 South America: Top Drive Market Size, By Country, 2013�2020 ($Million)
Table 59 Argentina: Top Drive Market Size, By Type, 2013�2020 ($Million)
Table 60 Venezuela: Top Drive Market Size, By Type, 2013�2020 ($Million)
Table 61 Brazil: Top Drive Market Size, By Type, 2013�2020 ($Million)
Table 62 Colombia: Top Drive Market Size, By Type, 2013�2020 ($Million)
Table 63 Others: Top Drive Market Size, By Type, 2013�2020 ($Million)
Table 64 South America: Top Drive Market Size, By Type, 2013�2020 ($Million)
Table 65 South America: Top Drive Market Size, By Type, 2013�2020 ($Million)
Table 66 South America: Offshore Top Drive Market Size, By Vessel Type, 2013�2020 ($Million)
Table 67 Middle East: Top Drive Market Size, By Country, 2013�2020 ($Million)
Table 68 Saudi Arabia: Top Drive Market Size, By Type, 2013�2020 ($Million)
Table 69 Iraq: Top Drive Market Size, By Type, 2013�2020 ($Million)
Table 70 Oman: Top Drive Market Size, By Type, 2013�2020 ($Million)
Table 71 Kuwait: Top Drive Market Size, By Type, 2013�2020 ($Million)
Table 72 UAE: Top Drive Market Size, By Type, 2013�2020 ($Million)
Table 73 Others: Top Drive Market Size, By Type, 2013�2020 ($Million)
Table 74 Middle East: Top Drive Market Size, By Type, 2013�2020 ($Million)
Table 75 Middle East: Top Drive Market Size, By Application, 2013�2020 ($Million)
Table 76 Middle East: Offshore Top Drive Market Size, By Vessel Type, 2013�2020 ($Million)
Table 77 Africa: Top Drive Market Size, By Country, 2013�2020 ($Million)
Table 78 Nigeria: Top Drive Market Size, By Type, 2013�2020 ($Million)
Table 79 Algeria: Top Drive Market Size, By Type, 2013�2020 ($Million)
Table 80 Egypt: Top Drive Market Size, By Type, 2013�2020 ($Million)
Table 81 Others: Top Drive Market Size, By Type, 2013�2020 ($Million)
Table 82 Africa: Top Drive Market Size, By Type, 2013�2020 ($Million)
Table 83 Africa: Top Drive Market Size, By Application, 2013�2020 ($Million)
Table 84 Africa: Offshore Top Drive Market Size, By Vessel Type, 2013�2020 ($Million)
Table 85 Contracts & Agreements, 2012-2015
Table 86 New Product Developments, 2012-2015
Table 87 Mergers & Acquisitions, 2012-2015
Table 88 Expansions, 2012-2015
Table 89 Other Developments, 2012-2015
List of Figures (43 Figures)
Figure 1 Markets Covered: Top Drive Market
Figure 2 Top Drive Market: Research Design
Figure 3 Breakdown of Primary Interviews: By Company, Designation, & Region
Figure 4 Market Size Estimation Methodology: Top-Down Approach
Figure 5 Market Size Estimation Methodology: Bottom-Up Approach
Figure 6 Market Estimation Approach & Data Triangulation Methodology
Figure 7 Top Drive Market: Regional Snapshot (2015 vs. 2020)
Figure 8 North America is Expected to Dominate the Top Drive Market in 2014
Figure 9 Top Drive Market Size, Offshore By Vessel Type, 2015 & 2020 ($Million)
Figure 10 Top Drive Market Size, By Application, 2015 & 2020 ($Million)
Figure 11 Top Drive Market Size, By Type, 2015 & 2020 ($Million)
Figure 12 Development of Unconventional Reserves and Increase in Exploration Activities to Drive the Market for Top Drive During 2015-2020
Figure 13 North America is Projected to Be the Fastest Growing Region to Demand Top Drive Systems From 2015 to 2020
Figure 14 China is Expected to Dominate the Top Drive Market in Asia�Pacific in 2015
Figure 15 Onshore Application is Expected to Lead the Market During the Forecast Period
Figure 16 Asia-Pacific Showing the Large Potential in Top Drive Market
Figure 17 U.S is Expected to Hold the Largest Market Size Till 2020
Figure 18 Value Chain Analysis: Top Drive Market
Figure 19 Porter�s Five Forces Analysis: Top Drive Market
Figure 20 Top Drive Market Share (Value), By Application, 2014 ($Million)
Figure 21 Offshore Application is Expected to Witness Substantial Growth in the Comings Years
Figure 22 Offshore Top Drive Market Share (Value), By Vessel Type, 2014
Figure 23 Top Drive Market Share (Value), By Type, 2014
Figure 24 Electric Top Drives Set to Outpace Hydraulic Top Drives in Terms of Growth
Figure 25 Electric Top Drive Market Share (Value), By Region, 2014
Figure 26 Hydraulic Top Drive Market Share (Value), By Region, 2014
Figure 27 Top Drive Market Share (Value), By Region, 2014
Figure 28 Companies Adopted Contracts & Agreements and New Product Developments to Capture the Market
Figure 29 Top Drive Market Share (Value), By Key Players, 2014
Figure 30 Battle for Market Share: Contracts & Agreements is the Key Strategy
Figure 31 Market Evaluation Framework: New Product Launches, Contracts & Agreements, and Merger & Acquisitions Have Fuelled the Growth of Companies From 2011 to 2015
Figure 32 Regional Revenue Mix of the Top 5 Market Players
Figure 33 Aker Solutions: Company Snapshot
Figure 34 SWOT Analysis: Aker Solutions
Figure 35 Cameron International Corporation: Company Snapshot
Figure 36 SWOT Analysis: Cameron International Corporation
Figure 37 Honghua Group: Company Snapshot
Figure 38 SWOT Analysis: Honghua Group
Figure 39 NOV: Company Snapshot
Figure 40 SWOT Analysis: NOV
Figure 41 Tesco Corporation: Company Snapshot
Figure 42 SWOT Analysis: Tesco
Figure 43 Foremost: Company Snapshot


Growth opportunities and latent adjacency in Top Drive Systems Market