Top 15 Petrochemicals Market (Ethylene, Propylene, Benzene, Butadiene, Toluene, Xylenes, Ethylene Oxide, Propylene Oxide, Methanol, PE, PP, PVC, PS, PET, ABS), Applications, and Region - Global Forecast to 2021


[232 Slides Report] The Top 15 Petrochemicals Market report is segmented into three sub parts, basic petrochemicals, basic intermediate chemicals and basic polymers. The basic petrochemicals market is anticipated to grow from 250.3 Million tons in 2016 to 310.3 Million tons by 2021 at a CAGR of 4.4% from 2016 to 2021.
In this study, 2014 has been considered as the historical year, 2015 as the base year, and 2016�2021 as the forecast period for estimating the market size of petrochemicals.
Objectives of the study:
- To define, describe, and forecast the top 15 petrochemicals market based on application & region
- To forecast the petrochemicals market size with respect to five main regions, namely, North America, Europe, Asia-Pacific, the Middle East & Africa, and Latin America
- To provide detailed information regarding the major factors influencing the growth of the market (drivers, restraints, opportunities, and industry-specific challenges)
- To analyze the opportunities in the market for stakeholders and details of a competitive landscape for market leaders
- To analyze competitive developments such as new product launches, expansions, mergers & acquisitions, and contracts & agreements in the global top 15 petrochemicals market
- To profile key players and comprehensively analyze their market shares and core competencies
Research Methodology:
In this report, market sizes have been derived using both bottom-up and top-down approaches. Extensive secondary sources, directories, and databases such as Hoovers, Bloomberg, Chemical Weekly, Factiva, International Monetary Fund (IMF), World bank, Economic Co-operation and Development (OECD), International Energy Agency (IEA), Securities and Exchange Commission (SEC), and other government and private websites are involved to identify and collect information useful for this technical, market-oriented, and commercial study of the top 15 petrochemicals market.
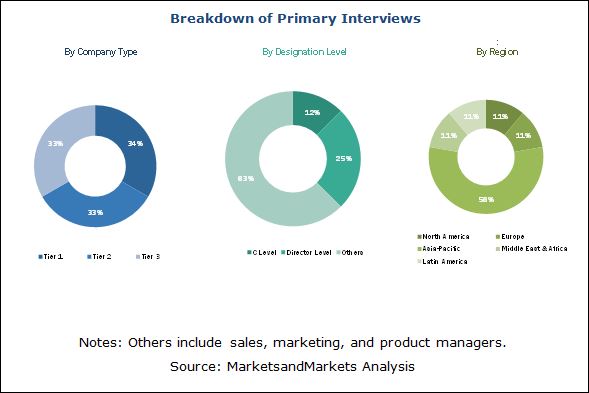
The market size for each petrochemical (ethylene, propylene, butadiene, benzene, xylenes and toluene), intermediate chemicals (methanol, ethylene oxide & propylene oxide) and basic polymers (polyethylene, polypropylene, polyvinyl chloride, polyester, acrylonitrile butadiene styrene) is identified through both secondary and primary research. The market has further been segmented based on application, using percentage split gathered during the research. Findings of this study have been verified through primary research by conducting extensive interviews with key officials, such as CEOs, VPs, directors, and other executives. The breakdown of profiles of the primary interviewees is illustrated in the below figure:
To know about the assumptions considered for the study, download the pdf brochure
Market Ecosystem:
Petrochemicals are derived from various feedstocks, viz ethane, gas oil, methanol, & naphtha. The type of feedstock generally changes from region to region. Generally, the petrochemical industry players are strongly backward integrated. Almost all companies have petrochemical complexes crackers in the U.S., which produces aromatics and olefins products at competitive rates enabling them to produce low cost resins for plastics.
Key Target Audience:
- Petrochemicals Manufacturers
- Raw Material Suppliers
- Manufacturing Technology Providers
- Regional Manufacturers� Associations and General Petrochemicals Association
- Traders, Distributors, and Suppliers Of Petrochemicals & Polymers
- Manufacturers in End-Use Industries
- Government and Regional Agencies and Research Organizations
- Investment Research Firms
Scope of the report:
This research report forecasts market size, in terms of both volume and analyzes trends in each of the submarkets. It categorizes the global market for petrochemicals on the basis of the following segments:
On the basis of Type of Petrochemical
- Ethylene
- Propylene
- Benzene
- Butadiene
- Xylenes
- Toluene
On the basis of Type of Intermediate Chemicals
- Methanol
- Ethylene oxide
- Propylene oxide
On the basis of Type of Polymer
- Polyethylene (PE)
- Polypropylene (PP)
- Polyvinyl chloride (PVC)
- Polystyrene (PS)
- Polyester (PET)
- Acrylonitrile butadiene styrene (ABS)
On the basis of Application
- Construction
- Packaging
- Automotive
- Electrical & Electronics
- Aerospace
- Consumer Goods
- Others
On the basis of Region:
- North America
- Europe including Russia
- Asia-Pacific
- Middle East & Africa
- Latin America
Available Customizations:
With the given market data, MarketsandMarkets offers customizations according to the company�s specific needs. The following customization options are available for the report:
- Product Analysis
Product Matrix that gives a detailed comparison of product portfolio of each company
- Regional Analysis
Further breakdown of a region with respect to a particular country
- Company Information
Detailed analysis and profiling of additional market players (up to 5)
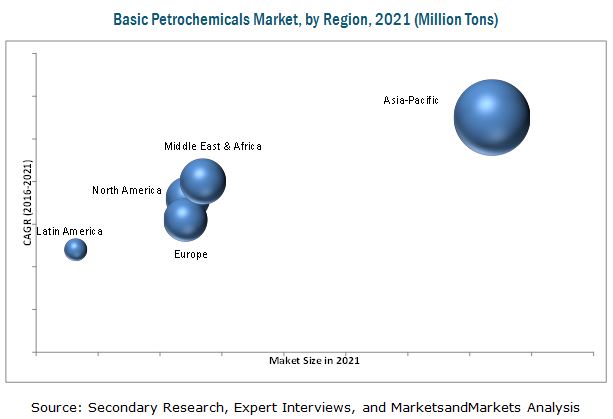
The top 15 petrochemicals report is divided into three sub parts, basic petrochemicals, basic intermediate chemicals and basic polymers. The basic petrochemicals market is projected to grow from 250.3 Million tons in 2016 to 310.3 Million tons by 2021, at a CAGR of 4.4% from 2016 to 2021. Rise in demand of commodity plastics in emerging economies in Southeast Asia and the Middle East. Moreover, rise in construction projects in these regions related to affordable housing is further expected to boost the demand of petrochemicals. Also, the growth in end-use industries such as automotive, packaging, electronics & electricals globally are driving the petrochemicals market.
The segmentation of the top 15 petrochemicals includes basic petrochemicals (ethylene, propylene, butadiene, benzene, xylenes & toluene), intermediate chemicals (methanol, ethylene oxide, propylene oxide), and basic polymers (polyethylene, polypropylene, polystyrene, polyester, polyvinyl chloride and acrylonitrile butadiene styrene). Packaging is projected to remain the fastest-growing market because of significant end use demand of soft drinks, health drinks, and bottled water in emerging economies such as India, UAE, Oman, Kuwait, and Qatar. Methanol is projected to be another fastest-growing market among the top petrochemicals driven by rise in demand of formaldehyde, which is used to manufacture adhesives for construction board products along with increase in gasoline fuel blending application.
Polyethylene is also one of the important type of plastics, which is gaining momentum globally because of low oil prices. New variations of polyethylene such as ultra-high molecular weight PE and Cross linked PE are used in the market and are expected to grow at a significant pace.
Currently, Asia-Pacific is the largest market for the petrochemicals having accounted for more than half of the global market size, by volume, in 2016. Among all the countries, China & India dominated the basic polymers market in 2016 in terms of volume, closely followed by Japan. High economic growth rate, rising demand for construction products made up of plastics, growing health awareness applications, improving standards of living and competitive manufacturing costs are the main factors leading to the growth of the market for petrochemicals in this region.
Though the petrochemicals market is growing at a significant growth rate, few factors hinder the growth of the market globally. Plastic recycling especially in emerging countries remain a restraint for the market growth due to lack of garbage collection methods and poor recycling infrastructure.
Companies such as Exxon Mobil (U.S.), Total (France), SABIC (Saudi Arabia), Dow Chemical Company (U.S.), Lyondell Basell (The Netherlands) are the dominant market players in the global petrochemicals market. The diverse product portfolio and strategically positioned R&D centers, continuous adoption of development strategies, and technological advancements are the few factors that are responsible for strengthening the market position of these companies in the market. These companies have been adopting various organic and inorganic growth strategies such as expansions, new product launches & product developments to enhance their current market share.
To speak to our analyst for a discussion on the above findings, click Speak to Analyst
 Exclusive indicates content/data unique to MarketsandMarkets and not available with any competitors.
Table of Contents
1 Introduction
1.1 Objective of the Study
1.2 Currency
1.3 Market Definition
1.4 Stake Holders
2 Research Methodology
2.1 Research Data
2.2 Top 15 Petrochemicals Market
2.3 Key Data From Secondary Sources
2.4 Key Data From Primary Sources
2.5 Data Triangulation
2.6 Assumptions and Limitations
2.7 Assumptions
2.8 Limitations
3 Executive Summary
3.1 Executive Summary- Basic Petrochemicals
3.2 Executive Summary- Basic Intermediaries
3.3 Executive Summary- Basic Polymers
3.4 Ethylene Market
3.5 Propylene Market
3.6 Butadiene Market
3.7 Methanol Market
3.8 Top 2 Commodity Polymers Market
3.9 Overall Commodity Polymers Market Growth Rate
4 Premium Insights
4.1 Global Petrochemicals Feedstock Consumption,2016
4.2 Pricing Analysis of Feedstock
4.3 Global Feedstock Trends
4.4 North America: Feedstock Market Trends
4.5 Western Europe: Feedstock Market Trends
4.6 Eastern Europe: Feedstock Market Trend
4.7 Middle East: Feedstock Market
4.8 China: Feedstock Market
5 Basic Petrochemicals Market
5.1 Ethylene Market
5.1.1 Ethylene Value Chain
5.1.2 Ethylene New Capacity Outlook-Global & By Company
5.1.3 Ethylene Market Share, By Region (2016-2021), MMT
5.1.4 Ethylene Market Share By Application (2016-2021), MMT
5.1.5 Ethylene: Market Dynamics
5.2 Propylene Market
5.2.1 Propylene Value Chain
5.2.2 Propylene New Capacity Outlook
5.2.3 Propylene Market Share, By Region, (2016-2021),MMT
5.2.4 Propylene Market Share, By Application (2016-2021),MMT
5.2.5 Propylene: Market Dynamics
5.3 Butadiene Market
5.3.1 Butadiene Value Chain
5.3.2 Butadiene New Capacity Outlook
5.3.3 Butadiene Market Share, By Region (2016-2021), KT
5.3.4 Butadiene Market Share, By Application (2016-2021), KT
5.3.5 Butadiene: Market Dynamics
5.4 Benzene Market
5.4.1 Benzene Value Chain
5.4.2 Benzene New Capacity Outlook
5.4.3 Benzene Market Share, By Region (2016-2021), KT
5.4.4 Benzene Market Share, By Application (2016-2021), KT
5.4.5 Benzene: Market Dynamics
5.5 Toluene Market
5.5.1 Toluene Value Chain
5.5.2 Toluene New Capacity Outlook
5.5.3 Toluene Market Share, By Region (2016-2021), KT
5.5.4 Toluene Market Share, By Application (2016-2021), KT
5.5.5 Toluene: Market Dynamics
5.6 Xylenes Market
5.6.1 Xylenes Value Chain
5.6.2 Xylenes New Capacity Outlook
5.6.3 Xylenes Market Share, By Region (2016-2021), KT
5.6.4 Xylenes Market Share, By Application (2016-2021), KT
5.6.5 Xylenes: Market Dynamics
6 Intermediate Chemicals Market
6.1 Methanol Market
6.1.1 Methanol Value Chain
6.1.2 Methanol New Capacity Outlook
6.1.3 Methanol Market Share, By Region (2016-2021), KT
6.1.4 Methanol Market Share, By Application (2016-2021), KT
6.1.5 Methanol : Market Dynamics
6.2 Ethylene Oxide Market
6.2.1 Ethylene Oxide Value Chain
6.2.2 Ethylene Oxide New Capacity Outlook
6.2.3 Ethylene Oxide Market Share, By Region (2016-2021), KT
6.2.4 Ethylene Oxide Market Share, By Application (2016-2021), KT
6.2.5 Ethylene Oxidel : Market Dynamics
6.3 Propylene Oxide Market
6.3.1 Propylene Oxide Value Chain
6.3.2 Propylene Oxide New Capacity Outlook
6.3.3 Propylene Oxide Market Share, By Region (2016-2021), KT
6.3.4 Propylene Oxide Market Share, By Application (2016-2021), KT
6.3.5 Propylene Oxide : Market Dynamics
7 Basic Polymers Market
7.1 Polyethylene Market
7.1.1 Polyethylene Value Chain
7.1.2 Polyethylene New Capacity Outlook
7.1.3 Polyethylene Market Share, By Region (2016-2021), KT
7.1.4 Polyethylene Market Share, By Application (2016-2021), KT
7.1.5 Polyethylene : Market Dynamics
7.2 Polypropylene Market
7.2.1 Polypropylene Value Chain
7.2.2 Polypropylene New Capacity Outlook
7.2.3 Polypropylene Market Share, By Region (2016-2021), KT
7.2.4 Polypropylene Market Share, By Application (2016-2021), KT
7.2.5 Polypropylene : Market Dynamics
7.3 PET Market
7.3.1 PET Value Chain
7.3.2 PET New Capacity Outlook
7.3.3 PET Market Share, By Region (2016-2021), KT
7.3.4 PET Market Share, By Application (2016-2021), KT
7.3.5 PET : Market Dynamics
7.4 PVC Market
7.4.1 PVC Value Chain
7.4.2 PVC New Capacity Outlook
7.4.3 PVC Market Share, By Region (2016-2021), KT
7.4.4 PVC Market Share, By Application (2016-2021), KT
7.4.5 PVC: Market Dynamics
7.5 Polystyrene Market
7.5.1 Polystyrene Value Chain
7.5.2 Polystyrene New Capacity Outlook
7.5.3 Polystyrene Market Share, By Region (2016-2021), KT
7.5.4 Polystyrene Market Share, By Application (2016-2021), KT
7.5.5 Polystyrene : Market Dynamics
7.6 ABS Market
7.6.1 ABS Value Chain
7.6.2 ABS New Capacity Outlook
7.6.3 ABS Market Share, By Region (2016-2021), KT
7.6.4 ABS Market Share, By Application (2016-2021), KT
7.6.5 ABS Market Dynamics
8 Company Profiles
8.1 Lyondell Basell
8.2 BASF SE
8.3 Total SA
8.4 Royal Dutch Shell PLC
8.5 Sinopec Ltd
8.6 E. I. Dupont De Nemours & Company
8.7 The DOW Chemical Company
8.8 Reliance Industries Ltd
8.9 Sabic
8.10 British Petroleum
8.11 Chevron Phillips
8.12 Formosa Plastics
8.13 China National Petroluem Corporation
8.14 Exxonmobil Corporation
8.15 Ineos Group
List of Tables (62 Tables)
Table 1 Ethylene Capacity Addition, By Company (2014-2022), (MT/ Year)
Table 2 Ethylene Capacity Addition, By Company (2014-2022), (MT/ Year)
Table 3 Ethylene Market Size, By Region, 2014-2021 (MMT)
Table 4 Ethylene Market Size, By Application, 2014-2021 (MMT)
Table 5 Propylene Market Size, By Region, 2014-2021 (MMT)
Table 6 Propylene Market Size, By Application, 2014-2021 (MMT)
Table 7 Butadiene Market Size, By Region, 2014-2021 (KT)
Table 8 Butadiene Market Size, By Application, 2014-2021 (KT)
Table 9 Benzene Market Size, By Region, 2014-2021 (KT)
Table 10 Benzene Market Size, By Application, 2014-2021 (KT)
Table 11 Toluene Market Size, By Region, 2014-2021 (KT)
Table 12 Toluene Market Size, By Application, 2014-2021 (KT)
Table 13 Xylenes Market Size, By Region, 2014-2021 (KT)
Table 14 Xylenes Market Size, By Application, 2014-2021 (KT)
Table 15 Methanol Market Size, By Region, 2014-2021 (KT)
Table 16 Methanol Market Size, By Application, 2014-2021 (KT)
Table 17 Ethylene Oxide Market Size, By Region, 2014-2021 (KT)
Table 18 Ethylene Oxide Market Size, By Application, 2014-2021 (KT)
Table 19 Propylene Oxide Market Size, By Region, 2014-2021 (KT)
Table 20 Propylene Oxide Market Size, By Application, 2014-2021 (KT)
Table 21 Polyethylene New Capacity Outlook
Table 22 Polyethylene Market Size, By Region, 2014-2021 (KT)
Table 23 Polyethylene Market Size, By Application, 2014-2021 (KT)
Table 24 Polypropylene Market Size, By Region, 2014-2021 (KT)
Table 25 Polypropylene Market Size, By Application, 2014-2021 (KT)
Table 26 PET Market Size, By Region, 2014-2021 (KT)
Table 27 PET Market Size, By Application, 2014-2021 (KT)
Table 28 PVC Market Size, By Region, 2014-2021 (KT)
Table 29 PVC Market Size, By Application, 2014-2021 (KT)
Table 30 Polystyrene Market Size, By Region, 2014-2021 (KT)
Table 31 Polystyrene Market Size, By Application, 2014-2021 (KT)
Table 32 ABS Market Size, By Region, 2014-2021 (KT)
Table 33 ABS Market Size, By Application, 2014-2021 (KT)
Table 34 Lyondell Basell: Products & Service
Table 35 Lyondell Basell: Recent Developments
Table 36 BASF SE: Products & Services
Table 37 BASF SE: Recent Developments
Table 38 Total SA: Products & Services
Table 39 Total SA: Recent Developments
Table 40 Royal Dutch Shell PLC: Products & Services
Table 41 Royal Dutch Shell PLC: Recent Developments
Table 42 Sinopec Ltd: Products & Services
Table 43 Sinopec Ltd: Recent Developments
Table 44 Dupont: Product & Services
Table 45 Dupont: Recent Developments
Table 46 The DOW Chemical Company: Product & Services
Table 47 The DOW Chemical Company: Recent Developments
Table 48 Reliance Industries Ltd: Products & Services
Table 49 Reliance Industries Ltd: New Developments
Table 50 Sabic : Products & Services
Table 51 Sabic: Recent Developments
Table 52 BP: Products & Services
Table 53 BP: Recent Developments
Table 54 Chevron Phillips: Product & Services
Table 55 Chevron Phillips :Recent Developments
Table 56 Formosa Plastics: Products & Services
Table 57 Formosa Plastic: Recent Developments
Table 58 China National Petroleum Corporation: Product & Services
Table 59 Exxon Mobil Corporation: Product & Services
Table 60 Exxon Mobil Corporation: Recent Developments
Table 61 Ineos Group Ltd: Products & Services
Table 62 Ineos: Recent Developments
List of Figures (85 Figures)
Figure 1 Top 15 Petrochemicals: Market Segmentation (Each Product has Been Segmented By Region & Application)
Figure 2 Years Considered for the Study
Figure 3 Top 15 Petrochemicals Market: Research Design
Figure 4 Research Methodology: Top-Down Approach
Figure 5 Research Methodology: Bottom-Up Approach
Figure 6 Polyethylene Projected to Dominate Ethylene Market, By Application, (2016-2021)
Figure 7 Polypropylene Projected to Dominate Propylene Market, By Application, (2016-2021)
Figure 8 Polybutadiene Application Projected to Grow Fastest During Forecast Period, (2016-2021)
Figure 9 Methanol to Olefin (MTO) Application Projected to Grow Fastest During Forecast Period, (2016-2021)
Figure 10 Top 2 Petrochemicals Market, By Region
Figure 11 PET is Projected to Become the Fastest Growing Market Among Polymers (2014-2021)
Figure 12 Naphtha is Projected to Dominate the Feedstock Market
Figure 13 Products of Ethane & Naphtha Cracking
Figure 14 Middle East & Africa�s Feedtsock Consumption is Expected to Grow Slightly Higher, (2016-2021)
Figure 15 Ethane�s Share is Projected to Grow at A Significant Rate
Figure 16 Napththa is Projected to Dominate the Feedtsock Market for A Long Term
Figure 17 Naphtha Projected to Dominate the Feedtsock Market in Eastern Europe
Figure 18 LPG is Projected to Dominate the Feedstock Market in Middle East in Long Term
Figure 19 Methanol� Share is Projected to Dominate the Feedstock Market in Long Term
Figure 20 Ethylene Value Chain
Figure 21 Ethylene Capacity Addition, By Region (2014-2016), (MMT)
Figure 22 Ethylene Market Share, By Region (2016-2021), MMT
Figure 23 Ethylene Market Share, By Application (2016-2021), MMT
Figure 24 Ethylene Market, Drivers, Restraints, Opportunities and Challenges
Figure 25 Propylene Value Chain
Figure 26 Propylene Capacity Addition, By Region (2014-2016), (MMT
Figure 27 Propylene Market Share, By Region (2016-2021), MMT
Figure 28 Propylene Market Share, By Application (2016-2021), MMT
Figure 29 Propylene Market, Drivers, Restraints, Opportunities and Challenges
Figure 30 Butadiene Value Chain
Figure 31 Butadiene Capacity Addition, By Region (2014-2016), (KT)
Figure 32 Butadiene Market Share, By Region (2016-2021), KT
Figure 33 Butadiene Market Share, By Application (2016-2021), KT
Figure 34 Butadiene Market, Drivers, Restraints, Opportunities and Challenges
Figure 35 Benzene Value Chain
Figure 36 Benzene Capacity Addition, By Region (2014-2016), (KT)
Figure 37 Benzene Market Share, By Region (2016-2021), KT
Figure 38 Benzene Market Share, By Application (2016-2021), KT
Figure 39 Benzene Market, Drivers, Restraints, Opportunities and Challenges
Figure 40 Toluene Value Chain
Figure 41 Toluene Capacity Addition, By Region (2014-2016), (KT)
Figure 42 Toluene Market Share, By Region (2016-2021), KT
Figure 43 Toluene Market Share, By Application (2016-2021), KT
Figure 44 Toulene Market, Drivers, Restraints, Opportunities and Challenges
Figure 45 Xylene Value Chain
Figure 46 Xylenes Capacity Addition, By Region (2014-2016), (KT)
Figure 47 Xylenes Market Share, By Region (2016-2021), KT
Figure 48 Xylenes Market Share, By Application (2016-2021), KT
Figure 49 Xylenes Market, Drivers, Restraints, Opportunities and Challenges
Figure 50 Methanol Value Chain
Figure 51 Methanol Market Share, By Region (2016-2021), KT
Figure 52 Methanol Market Share, By Application (2016-2021), KT
Figure 53 Methanol Market, Drivers, Restraints, Opportunities and Challenges
Figure 54 Ethylene Oxide Value Chain
Figure 55 Ethylene Oxide Market Share, By Region (2016-2021), KT
Figure 56 Ethylene Oxide Market Share, By Application (2016-2021), KT
Figure 57 Ethylene Oxide Market, Drivers, Restraints, Opportunities and Challenges
Figure 58 Propylene Oxide Value Chain
Figure 59 Propylene Oxide Market Share, By Region (2016-2021), KT
Figure 60 Propylene Oxide Market Share, By Application (2016-2021), KT
Figure 61 Propylene Oxide Market, Drivers, Restraints, Opportunities and Challenges
Figure 62 Polyethylene Value Chain
Figure 63 Polyethylene Market Share, By Region (2016-2021), KT
Figure 64 Polyethylene Market Share, By Application (2016-2021), KT
Figure 65 Polyethylene Market, Drivers, Restraints, Opportunities and Challenges
Figure 66 Polypropylene Value Chain
Figure 67 Polypropylene Market Share, By Region (2016-2021), KT
Figure 68 Polypropylene Market Share, By Application (2016-2021), KT
Figure 69 Polypropylene Market, Drivers, Restraints, Opportunities and Challenges
Figure 70 PET Value Chain
Figure 71 PET Market Share, By Region (2016-2021), KT
Figure 72 PET Market Share, By Application (2016-2021), KT
Figure 73 PET Market, Drivers, Restraints, Opportunities and Challenges
Figure 74 PVC Value Chain
Figure 75 PVC Market Share, By Region (2016-2021), KT
Figure 76 PVC Market Share, By Application (2016-2021), KT
Figure 77 PVC Market, Drivers, Restraints, Opportunities and Challenges
Figure 78 Polystyrene (PS) Value Chain
Figure 79 Polystyrene Market Share, By Region (2016-2021), KT
Figure 80 Polystyrene Market Share, By Application (2016-2021), KT
Figure 81 Polystyrene Market, Drivers, Restraints, Opportunities and Challenges
Figure 82 ABS Value Chain
Figure 83 ABS Market Share, By Region (2016-2021), KT
Figure 84 ABS Market Share, By Application (2016-2021), KT
Figure 85 ABS Market, Drivers, Restraints, Opportunities and Challenges


Growth opportunities and latent adjacency in Top 15 Petrochemicals Market