Top 10 Security Technologies � (Software Defined Security, Application Security, Encryption Software, Data Loss Prevention, Cloud Access Security Brokers, Security Orchestration, Adaptive Security, Threat Intelligence, Identity and Access Management, Digital Forensics)


[204 Pages Report] The Top 10 security technologies market is expected to grow at a significant rate during the forecast period. The base year used for this study is 2014/2015, and the forecast period considered is 2015�2020/2016�2021.
The objectives of the study are as follows:
- To define, describe, and forecast the market for Top 10 security technologies Software-defined security, application security, encryption software, cloud access security brokers, security orchestration, adaptive security, threat intelligence, identity & access management, and digital forensics on the basis of various parameters
- To forecast the market size for various technologies with respect to four main regions: North America , Europe, Asia-Pacific (APAC), and Rest of the World (RoW)
- To provide detailed information regarding the major factors influencing the growth of the market (drivers and restraints).
- To strategically profile the key players and comprehensively analyze their market shares and core competencies, along with detailing the competitive landscape for market leaders
- To analyze the competitive developments such as joint ventures, collaborations, agreements, contracts, partnerships, mergers & acquisitions, new product developments, and research & developments (R&D) carried out in the Top 10 security technologies market
The research methodology used to estimate and forecast the Top 10 security technologies market begins with obtaining data on key vendor revenues through secondary research. Some of the secondary sources referred to for this research study include information from various journals and databases such as IEEE journals, Factiva, Hoover�s, Bloomberg BusinessWeek, and OneSource. The vendor offerings have also been taken into consideration to determine the market segmentation. The bottom-up procedure has been employed to arrive at the overall size of the Top 10 security technologies market from the revenues of the key players in the market. After arriving at the overall market size, the total market has been split into several segments and sub-segments, which have then been verified through primary research by conducting extensive interviews of people holding key positions in the industry such as CEOs, VPs, directors, and executives. The market breakdown and data triangulation procedures have been employed to complete the overall market engineering process and arrive at the exact statistics for all segments and sub-segments.
The major players in the market for Top 10 security technologies include IBM Corporation (U.S.), Symantec Corporation (U.S.), Intel Security (U.S.), Trend Micro (Japan), FireEye, Inc. (U.S.), Cisco Systems (U.S.), Check Point Software Technologies (Israel), EMC RSA (U.S.), HPE (U.S), and Rapid7 (U.S.). The end-users of these security technologies include organizations from BFSI, retail, government, healthcare & life sciences, telecommunications & IT, entertainment, industrial, automotive, military, defense, and aviation sectors.
The Target Audiences:
- Cyber Security Vendors
- Network Solution Providers
- System Integrators
- IT Service Providers
- Consulting Service Providers
- Managed Security Service Providers (MSSPs)
- Government Agencies
- Value-Added Resellers (VARs)
- Telecom Service Providers
- Cloud Service Providers
�The study answers several questions for the target audiences, primarily which market segments to focus on in the next two to five years for prioritizing their efforts and investments.�
To know about the assumptions considered for the study, download the pdf brochure
Report Scope:
In this report, the Top 10 security technologies market has been segmented on the basis of the following categories:
- Software-Defined Security Market
- By Component
- By Enforcement Point
- By Vertical
- By Region
- Application Security Market
- By Component
- By Testing Type
- By Vertical
- By Region
- Encryption Software Market
- By Application
- By Service Type
- By Vertical
- By Region
- Data Loss Prevention Market
- By Solution
- By Service Type
- By Application
- By Vertical
- By Region
- Cloud Access Security Brokers Market
- By Solution
- By Service Type
- By Service Model
- By Vertical
- By Region
- Security Orchestration Market
- By Component
- By Application
- By Vertical
- By Region
- Adaptive Security Market
- By Component
- By Application
- By Vertical
- By Region
- Threat Intelligence Market
- By Solution
- By Service
- By Vertical
- By Region
- Identity & Access Management Market
- By Component
- By Vertical
- By Region
- Digital Forensics Market
- By Component
- By Sub-segment
- By Tool Type
- By Vertical
- By Region
Company Profiles: Detailed analysis of the major companies present in the Top 10 security technologies market
Available Customizations:
With the given market data, MarketsandMarkets offers customizations according to the company�s specific needs. The following customization options are available for the report:
Company Information
Detailed analysis and profiling of additional market players (up to five)
Geographic Analysis
- Further breakdown of the North American Top 10 security technologies market
- Further breakdown of the European Top 10 security technologies market
- Further breakdown of the APAC Top 10 security technologies market
- Further breakdown of the MEA Top 10 security technologies market
- Further breakdown of the Latin American Top 10 security technologies market
The Top 10 security technologies market is expected to grow at a significant rate during the forecast period. The growth of this market is being propelled by the increasing security breaches and cyber incidents. The scope of this report covers the top 10 security technologies market on the basis of diverse segments such as solution, services, vertical, and region.
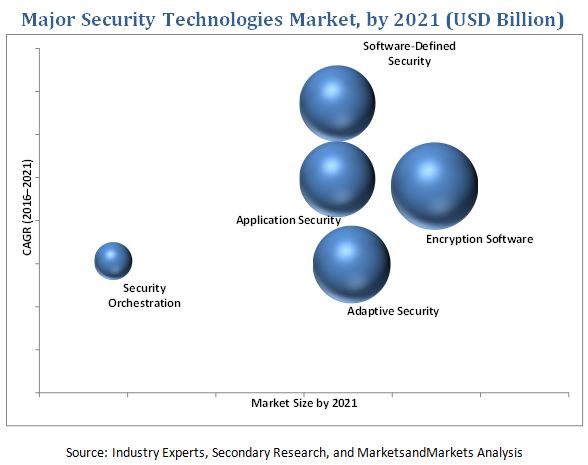
The vital need for a comprehensive and efficient end-to-end security structure gave rise to software-defined security (SDSec) model. Governments as well as commercial businesses want a system that can secure their enterprise computing environment from any malware, spyware, threat, intrusion, or viruses. They need a security framework that safeguards content and information; offers services for threat management, identity management, and access management; and manages the overall security. The SDSec offers support to organizations in creating a secure and agile environment with network control and full visibility. In the SDSec security model, security software is used to manage and monitor the information security. This is a policy-driven architecture where the software is responsible for managing the network access and security controls in the computing environment. The overall SDSec market has significant growth potential during the forecast period (2016�2021).
Application security protects web- and mobile-based applications from vulnerabilities through various security testing procedures throughout the application development lifecycle. The major factors driving the growth of the application security market are the rising security breaches targeting business applications and stringent compliance and regulatory requirements for application security. Furthermore, due to the rise in the demand for Software as a Service (SaaS)-based application security solutions, the application security market finds significant opportunity to grow in the next five years. The biggest challenge for organizations will be meeting the high cost of innovation for application security solutions due to budget constraints as well as lack of application security expertise.
Encryption software encrypts critical information in a way that only authorized parties, with the help of a secret key or password, can access the information. The growing need to secure critical business operations from advanced cyber threats, limitations of traditional security solutions to defend the enterprise network, and the stringent compliance with regulatory standards and guidelines are expected to drive the encryption software market. Growing concerns regarding data theft and loss and increasing usage of mobile devices and Bring Your Own Device (BYOD) trends across businesses have considerably driven the growing adoption rate of encryption software.
Rising compliance and regulatory requirements across the globe are the key factors driving the growth of the data loss prevention (DLP) market. As regulatory requirements set by Sarbanes-Oxley Act (SOX), Health Insurance Portability and Accountability Act (HIPAA), and Gramm-Leach-Bliley Act (GLBA) drive the demand for DLP solutions and services among enterprises regardless of their size. Also, the high rate of Internet penetration and increasing dependency on it for communication has gained the attention of cyber criminals and hackers. Thus, there has been a surge in cases of data breaches. To mitigate these risks, the DLP vendors have started offering DLP as part of a more broadly constituted portfolio of products. Thus, the DLP market is expected to witness significant growth over the coming years.
The cloud access security brokers solutions are used widely by major industries globally such as banking, financial services and insurance (BFSI), education, government, healthcare & life sciences, manufacturing, retail & wholesale, telecommunication & IT, and others (media & entertainment and travel & transportation). The major growth drivers of cloud access security brokers include control data loss, real-time monitoring capabilities, and increasing adoption of cloud-based applications. The cloud access security brokers market faces the challenges of lack of awareness and increasing security concerns. The major factors that are restraining the cloud access security brokers market�s growth are surviving the hype cycle and the risk of information loss. Vendors witness emerging opportunities for cloud access security brokers solutions mainly due to the high adoption rate of pay-as-you-go model among Small and Medium Businesses (SMBs).
This report describes the drivers and restraints pertaining to the Top 10 security technologies market. In addition, it analyzes the current scenario and forecasts the market size till 2020/2021.
The key players in the Top 10 security technologies market include IBM (U.S.), Symantec Corporation (U.S.), Intel Security (U.S.), Trend Micro (Japan), FireEye Inc. (U.S.), Cisco Systems (U.S.), Check Point Software Technologies (Israel), EMC RSA (U.S.), HPE (U.S.), and Rapid7 (U.S.).
To speak to our analyst for a discussion on the above findings, click Speak to Analyst
 Exclusive indicates content/data unique to MarketsandMarkets and not available with any competitors.
Table of Contents
1 Introduction (Page No. - 14)
2 Research Methodology (Page No. - 19)
3 Software-Defined Security (Page No. - 21)
3.1 Executive Summary
3.2 Drivers and Restraints
3.3 Industry Trends
3.4 Software-Defined Security Market Analysis, By Component
3.4.1 Software-Defined Security Market Analysis, By Solution
3.4.2 Software-Defined Security Market Analysis, By Service
3.5 Software-Defined Market Analysis, By Enforcement Point
3.6 Software-Defined Security Market Analysis, By End-User
3.7 Software-Defined Security Market Analysis, By Region
4 Application Security Market (Page No. - 40)
4.1 Executive Summary
4.2 Drivers and Restraints
4.3 Application Security Market Analysis, By Component
4.3.1 Application Security Market Analysis, By Solution
4.3.2 Application Security Market Analysis, By Service
4.4 Application Security Market Analysis, By Testing Type
4.5 Application Security Market Analysis, By Vertical
4.6 Application Security Market Analysis, By Region
5 Encryption Software Market (Page No. - 53)
5.1 Executive Summary
5.2 Drivers and Restraints
5.3 Industry Trends
5.4 Encryption Software Market Analysis, By Application
5.5 Encryption Software Market Analysis, By Service
5.6 Encryption Software Market Analysis, By Vertical
5.7 Encryption Software Market Analysis, By Region
6 Data Loss Prevention (Page No. - 65)
6.1 Executive Summary
6.2 Drivers and Restraints
6.3 Industry Trends
6.4 Data Loss Prevention Market Analysis, By Solution Type
6.5 Data Loss Prevention Market Analysis, By Service
6.6 Data Loss Prevention Market Analysis, By Application
6.7 Data Loss Prevention Market Analysis, By Vertical
6.8 Data Loss Prevention Market Analysis, By Region
7 Cloud Access Security Brokers Market (Page No. - 80)
7.1 Executive Summary
7.2 Drivers and Restraints
7.3 Industry Trends
7.4 Cloud Access Security Brokers Market Analysis, By Solution
7.5 Cloud Access Security Brokers Market Analysis, By Service
7.6 Cloud Access Security Brokers Market Analysis, By Service Model
7.7 Cloud Access Security Brokers Market Analysis, By Vertical
7.8 Cloud Access Security Brokers Market Analysis, By Region
8 Security Orchestration (Page No. - 96)
8.1 Executive Summary
8.2 Drivers and Restraints
8.3 Industry Trends
8.4 Security Orchestration Market Analysis, By Component
8.5 Security Orchestration Market Analysis, By Application
8.6 Security Orchestration Market Analysis, By Vertical
8.7 Security Orchestration Market Analysis, By Region
9 Adaptive Security Market (Page No. - 108)
9.1 Executive Summary
9.2 Drivers and Restraints
9.3 Industry Trends
9.4 Adaptive Security Market Analysis, By Component
9.5 Adaptive Security Market Analysis, By Application
9.6 Adaptive Security Market Analysis, By Vertical
9.7 Adaptive Security Market Analysis, By Region
10 Threat Intelligence (Page No. - 125)
10.1 Executive Summary
10.2 Drivers and Restraints
10.3 Industry Trends
10.4 Threat Intelligence Market Analysis, By Solution
10.5 Threat Intelligence Market Analysis, By Service
10.6 Threat Intelligence Market Analysis, By Vertical
10.7 Threat Intelligence Market Analysis, By Region
11 Identity and Access Management (Page No. - 139)
11.1 Executive Summary
11.2 Drivers and Restraints
11.3 Industry Trends
11.4 Identity and Access Management Market Analysis, By Component
11.5 Identity and Access Management Market Analysis, By Vertical
11.6 Identity and Access Management Market Analysis, By Region
12 Digital Forensics Market (Page No. - 150)
12.1 Executive Summary
12.2 Drivers and Restraints
12.3 Industry Trends
12.4 Digital Forensics Market Analysis, By Component
12.5 Digital Forensics Market Analysis, By Subsegment
12.6 Digital Forensics Market Analysis, By Tools Type
12.7 Digital Forensics Market Analysis, By Vertical
12.8 Digital Forensics Market Analysis, By Region
13 Company Profiles (Page No. - 163)
(Overview, Financial*, Products & Services, Strategy, and Developments)
13.1 IBM Corporation
13.2 Symantec Corporation
13.3 Intel Security
13.4 Trend Micro
13.5 Fireeye, Inc.
13.6 Cisco Systems, Inc.
13.7 Check Point Software Technologies
13.8 EMC RSA
13.9 HPE
13.10 Rapid7
*Details Might Not Be Captured in Case of Unlisted Companies
14 Appendix (Page No. - 201)
14.1 Knowledge Store: Marketsandmarkets� Subscription Portal
14.2 Introducing RT: Real-Time Market Intelligence
14.3 Author Details
List of Tables (62 Tables)
Table 1 Software-Defined Security Market Size and Growth Rate, 2014�2021 (USD Million, Y-O-Y %)
Table 2 Software-Defined Security Market Size, By Component, 2014�2021 (USD Million)
Table 3 Software-Defined Security Market Size, By Solutions, 2014�2021 (USD Million)
Table 4 Software-Defined Security Market Size, By Service, 2014�2021 (USD Million)
Table 5 Software-Defined Security Market Size, By Enforcement Point, 2014�2021 (USD Million)
Table 6 Software-Defined Security Market Size, By End-User, 2014�2021 (USD Million)
Table 7 Enterprises: Software-Defined Security Market Size, By Vertical, 2014�2021 (USD Million)
Table 8 Software-Defined Security Market Size, By Region, 2014�2021 (USD Million)
Table 9 Application Security Market Size and Growth Rate, 2014�2021 (USD Billion, Y-O-Y %)
Table 10 Application Security Market Size, By Component, 2014�2021 (USD Million)
Table 11 Application Security Market Size, By Solution, 2014�2021 (USD Million)
Table 12 Application Security Market Size, By Service, 2014�2021 (USD Million)
Table 13 Application Security Market Size, By Application, 2014�2021 (USD Million)
Table 14 Application Security Market Size, By Vertical, 2014�2021 (USD Million)
Table 15 Application Security Market Size, By Region, 2014�2021 (USD Million)
Table 16 Encryption Software Market Size and Growth Rate, 2014�2021 (USD Million, Y-O-Y %)
Table 17 Encryption Software Market Size, By Application, 2014�2021 (USD Million)
Table 18 Encryption Software Market Size, By Service, 2014�2021 (USD Million)
Table 19 Encryption Software Market Size, By Vertical, 2014�2021 (USD Billion)
Table 20 Encryption Software Market Size, By Region, 2014�2021 (USD Million)
Table 21 Data Loss Prevention Market Size and Growth, 2013�2020 (USD Million, Y-O-Y %)
Table 22 Data Loss Prevention Market Size, By Solution Type, 2013�2020 (USD Million)
Table 23 Data Loss Prevention Market Size, By Service, 2013�2020 (USD Million)
Table 24 Data Loss Prevention Market Size, By Application, 2013�2020 (USD Million)
Table 25 Data Loss Prevention Market Size, By Vertical, 2013�2020 (USD Million)
Table 26 Data Loss Prevention Market Size, By Region, 2013�2020 (USD Million)
Table 27 Cloud Access Security Brokers Market Size and Growth, 2013�2020, (USD Million, Y-O-Y %)
Table 28 Cloud Access Security Brokers Market Size, By Solution, 2013�2020 (USD Million)
Table 29 Cloud Access Security Brokers Market Size, By Service, 2013�2020 (USD Million)
Table 30 Cloud Access Security Brokers Market Size, By Service Model, 2013�2020 (USD Million)
Table 31 Cloud Access Security Brokers Market Size, By Vertical, 2013�2020 (USD Million)
Table 32 Cloud Access Security Brokers Market Size, By Region, 2013�2020 (USD Million)
Table 33 Security Orchestration Market Size and Growth, 2014�2021 (USD Million, Yoy %)
Table 34 Security Orchestration Market Size, By Component, 2014�2021 (USD Million)
Table 35 Services: Security Orchestration Market Size, By Type, 2014�2021 (USD Million)
Table 36 Security Orchestration Market Size, By Application, 2014�2021 (USD Million)
Table 37 Security Orchestration Market Size, By Vertical, 2014�2021 (USD Million)
Table 38 Security Orchestration Market Size, By Region, 2014�2021 (USD Million)
Table 39 Adaptive Security Market Size and Growth Rate, 2014�2021 (USD Million, Y-O-Y %)
Table 40 Adaptive Security Market Size, By Component, 2014�2021 (USD Million)
Table 41 Adaptive Security Market Size, By Services, 2014�2021 (USD Million)
Table 42 Professional Services: Adaptive Security Market Size, By Type, 2014�2021 (USD Million)
Table 43 Adaptive Security Market Size, By Application, 2014�2021 (USD Million)
Table 44 Adaptive Security Market Size, By Vertical, 2014�2021 (USD Million)
Table 45 Adaptive Security Market Size, By Region, 2014�2021 (USD Million)
Table 46 Threat Intelligence Security Market Size and Growth, 2013�2020 (USD Million, Y-O-Y %)
Table 47 Threat Intelligence Security Market Size, By Solution, 2013�2020 (USD Million)
Table 48 Threat Intelligence Security Market Size, By Service, 2013�2020 (USD Million)
Table 49 Managed Services: Threat Intelligence Security Market Size, By Type, 2013�2020 (USD Million)
Table 50 Professional Services: Threat Intelligence Security Market Size, By Type, 2013�2020 (USD Million)
Table 51 Threat Intelligence Security Market Size, By Vertical, 2013�2020 (USD Million)
Table 52 Threat Intelligence Security Market Size, By Region, 2013�2020 (USD Million)
Table 53 Identity and Access Management Market Size, 2013�2020 (USD Million)
Table 54 Identity and Access Management Market Size, By Component, 2013�2020 (USD Million)
Table 55 Identity and Access Management Market Size, By Vertical, 2013�2020 (USD Million)
Table 56 Identity and Access Management Market Size, By Region, 2013�2020 (USD Million)
Table 57 Digital Forensics Market Size and Growth, 2013�2020 (USD Million, Y-O-Y %)
Table 58 Digital Forensics Market Size, By Component, 2013�2020 (USD Million)
Table 59 Digital Forensics Market Size, By Sub-Segment, 2013�2020 (USD Million)
Table 60 Digital Forensics Market Size, By Tool Type, 2013�2020 (USD Million)
Table 61 Digital Forensics Market Size, By Vertical, 2013�2020 (USD Million)
Table 62 Digital Forensics Market Size, By Region, 2013�2020 (USD Million)
List of Figures (77 Figures)
Figure 1 Software-Defined Security Market: Pillars of Sdsec Security Model
Figure 2 Software-Defined Security: Architecture
Figure 3 Architecture Strategic Benchmarking: Acquisitions, Partnerships, and New Product Developments Were the Key Growth Strategies Adopted By Key Market Players From 2014 to 2016
Figure 4 Services Component is Expected to Grow at A Higher CAGR During the Forecast Period
Figure 5 Control Automation and Orchestration Solution Market is Expected to Grow to Highest CAGR During the Forecast Period 2016�2021
Figure 6 Support and Maintenance Services are Expected to Have the Highest CAGR During the Forecast Period 2016�2021
Figure 7 Others (Cloud, Database, and Web) Security is Expected to Record the Highest CAGR During the Forecast Period 2014�2021
Figure 8 Cloud Service Providers End-User Segment is Expected to Have the Highest CAGR During the Forecast Period 2016�2021
Figure 9 Media and Entertainment is Expected to Have the Highest CAGR During the Forecast Period 2016�2021
Figure 10 Middle East and Africa Region to Grow at the Highest Rate During the Forecast Period
Figure 11 Services Segment is Expected to Have the Highest CAGR During the Forecast Period
Figure 12 Mobile Application Security Solution is Expected to Have the Highest CAGR During the Forecast Period 2016�2021
Figure 13 Managed Services is Expected to Have the Highest CAGR During the Forecast Period 2016�2021
Figure 14 Iast Segment is Expected to Record the Highest CAGR During the Forecast Period 2016�2021
Figure 15 BFSI Vertical is Expected to Have the Highest CAGR During the Forecast Period 2016�2021
Figure 16 North America is Expected to Have the Largest Market Size in 2016
Figure 17 Encryption Software Market: Value Chain Analysis
Figure 18 Cloud Encryption Application Segment is Expected to Have the Highest CAGR During the Forecast Period
Figure 19 Managed Services is Expected to Have the Highest CAGR During the Forecast Period of 2016�2021
Figure 20 Telecom Vertical is Expected to Have the Highest CAGR During the Forecast Period 2016�2021
Figure 21 Asia-Pacific is Expected to Grow at Highest CAGR During the Forecast Period
Figure 22 SMBS and Consumers Do Not Spend on Highly Sophisticated DLP Solutions Due to Their Financial Constraints
Figure 23 RSA and Websense Hold the Strategic Position in New Product Launches
Figure 24 Endpoint DLP Market is Expected to Have the Highest CAGR During the Forecast Period
Figure 25 Managed Security Services is Expected to Have the Highest CAGR During the Forecast Period 2015�2020
Figure 26 Cloud Storage is Expected to Have the Highest CAGR During the Forecast Period 2015�2020
Figure 27 BFSI Vertical is Expected to Have the Highest CAGR During the Forecast Period 2015�2020
Figure 28 North America Was Estimated to Have the Largest Market Size in 2015
Figure 29 Cloud Access Security Brokers Market Size, 2015 - 2020 (USD Billion )
Figure 30 Cloud Access Security Brokers Market: Value Chain Analysis
Figure 31 Cloud Access Security Brokers Market: Ecosystem
Figure 32 Strategic Benchmarking: Cloud Access Security Brokers Market
Figure 33 Threat Protection Segment is Expected to Have the Highest CAGR During the Forecast Period
Figure 34 Support, Training and Maintenance Service is Expected to Have the Highest CAGR During the Forecast Period
Figure 35 SaaS is Expected to Have the Largest Market Size Throughout the Forecast Period
Figure 36 Retail and Wholesale Vertical is Expected to Grow at the Highest CAGR During the Forecast Period
Figure 37 North America is Expected to Have the Largest Market Size During the Forecast Period
Figure 38 Security Orchestration Market: Value Chain
Figure 39 Services Segment is Expected to Grow at A Higher CAGR During the Forecast Period
Figure 40 Managed Services Segment is Expected to Grow at A Higher CAGR During the Forecast Period
Figure 41 Network Forensics Application is Expected to Grow at the Highest CAGR During the Forecast Period
Figure 42 BFSI Vertical is Expected to Have the Largest Market Size During the Forecast Period
Figure 43 North America is Expected to Hold the Largest Market Size During the Forecast Period
Figure 44 Adaptive Security Market: Value Chain
Figure 45 Strategic Benchmarking: Technology Integration and Product Enhancement
Figure 46 Services Segment to Grow at the Highest CAGR During the Forecast Period
Figure 47 Managed Services Segment is Expected to Grow at the Highest CAGR During the Forecast Period
Figure 48 Application Security Segment is Expected to Grow at the Highest CAGR During the Forecast Period
Figure 49 BFSI Vertical is Expected to Grow at the Highest CAGR During the Forecast Period
Figure 50 Asia-Pacific Region is Expected to Grow at the Highest CAGR During the Forecast Period
Figure 51 Threat Intelligence Security Market: Value Chain
Figure 52 SIEM is Expected to Hold the Largest Market Size During 2015�2020
Figure 53 Professional Services to Grow the Highest During the Forecast Period
Figure 54 BFSI to Grow the Highest During the Forecast Period
Figure 55 North America has the Largest Market Size in the Global Threat Intelligence Security Market
Figure 56 Identity and Access Management Market: Value Chain
Figure 57 Identity and Access Management Portfolio Comparison
Figure 58 Strategic Benchmarking
Figure 59 Audit, Compliance, and Governance is the Fastest Growing Component During the Forecast Period
Figure 60 Energy Vertical Will Witness A High Rate of Identity and Access Management Solutions Adoption in the Next Five Years
Figure 61 Asia-Pacific is Expected to Be the Fastest-Growing Region During the Forecast Period
Figure 62 Value Chain: Digital Forensics Market
Figure 63 Service is Expected to Dominate Digital Forensics Market During the Forecast Period
Figure 64 Cloud Forensics is Expected to Grow With the Highest CAGR During 2015�2020
Figure 65 Forensic Data Analysis is Expected to Have the Largest Market Size in the Digital Forensics Market By 2020
Figure 66 Digital Forensics Will Witness A High Rate of Adoption From the BFSI Vertical in the Next Five Years
Figure 67 North America is Expected to Hold the Largest Market Size in the Digital Forensics Market During the Forecast Period
Figure 68 IBM Corporation: Company Snapshot
Figure 69 Symantec Corporation: Company Snapshot
Figure 70 Intel Security: Company Snapshot
Figure 71 Trend Micro: Company Snapshot
Figure 72 Fireeye, Inc.: Company Snapshot
Figure 73 Cisco Systems, Inc.: Company Snapshot
Figure 74 Check Point Software Technology: Company Snapshot
Figure 75 EMC RSA: Company Snapshot
Figure 76 HPE : Company Snapshot
Figure 77 Rapid7: Company Snapshot


Growth opportunities and latent adjacency in Top 10 Security Technologies