Top 10 Bioprocess Technology Market by Cell Culture, Cell Expansion, Cell Counting, Cell Line Development, Flow Cytometry, Single-Use Bioprocessing, Biologics Safety Testing, Tangential Flow Filtration, Virus Filtration & Region - Global Forecast to 2021


[257 Pages Report] The global top 10 bioprocess technology market is expected to USD 71.03 Billion by 2021 from USD 39.30 Billion in 2016, at a CAGR of 12.4% between 2016 and 2021.
Growth in the biopharmaceutical industry, increase in R&D spending, rising demand for vaccine production, and technological advancements form important growth drivers for this market. On the other hand, stringent regulatory policies and high cost of instruments are restraining market growth for bioprocess technologies.
The report provides an overall understanding of the global top 10 bioprocess technology market. This report segments the market on the basis of type and region.
On the basis of type, the market is segmented into cell culture, cell expansion, cell counting, cell line development, flow cytometry, single-use bioprocessing, biologics safety testing, virus filtration, tangential flow filtration, and pyrogen testing. In 2016, the cell culture segment is expected to account for the largest share of the global top 10 bioprocess technology market.
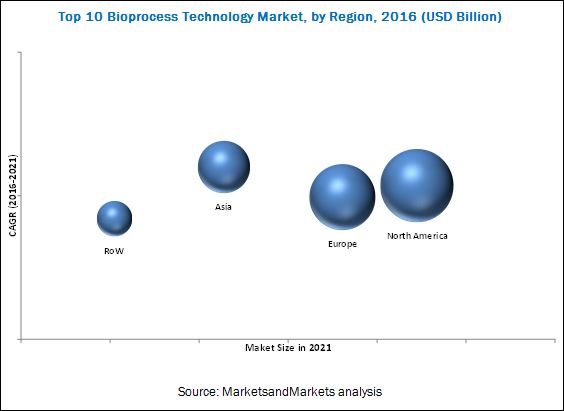
On the basis of region, the market is segmented into North America, Europe, Asia, and the Rest of the World (RoW). The report maps each bioprocess technology in these geographic and regional segments.
A combination of bottom-up and top-down approaches was used to calculate the market sizes and growth rates of the global top 10 bioprocess technology market and its subsegments. All percentage shares, splits, and breakdowns were determined using secondary sources and verified through primary sources. All possible parameters that affect the markets covered in this research study have been accounted for, viewed in extensive detail, verified through primary research, and analyzed to get the final quantitative and qualitative data. Primary interviews with key opinion leaders were also used to determine the percentage shares of each subsegment and the relative differences in growth rates.
In 2016, North America accounted for the largest share of the global top 10 bioprocess technology market. Growth in this market can be attributed to the increase in demand of high quality biologics, rising spending on R&D by top players in this region. Similarly, Asia is estimated to grow at the highest CAGR during the forecast period. The growth of this market is fueled by overall growth in the biopharmaceutical industry, investments by key market players in Asia countries, increasing government support, developments in R&D infrastructure, increasing outsourcing to Asia countries, and growing expertise and academic excellence in Asia.
The prominent players in the top 10 bioprocess technology market include GE Healthcare (U.S.), Merck Millipore (Germany), Thermo Fisher Scientific, Inc. (U.S.), Becton, Dickinson and Company (U.S.), Danaher Corporation (U.S.), Lonza Group AG (Switzerland), Sartorius Stedim Biotech S.A (France), Corning, Inc.(U.S.), Bio-Rad Laboratories (U.S.), and Charles River Laboratories (U.S.).
Target audience for this report:
- Academic Research Institutes
- Pharmaceutical Companies
- Biotechnology Companies
- Bioprocess Technology Manufacturing Companies
- Contract Research Organizations (CROs)
- Market Research & Consulting Firms
To know about the assumptions considered for the study, download the pdf brochure
Scope of the Report
This research report categorizes the global top 10 bioprocess technology market into the following segments and subsegments:
Global top 10 bioprocess technology Market, by Type
-
Cell culture
-
Equipment
- Cell culture supporting equipment
- Cell culture storage equipment
- Cell culture vessels
- Bioreactors
-
CONSUMABLES
- Sera
- Media
- Reagents
- Bioreactor accessories
-
Equipment
-
Cell expansion
-
CONSUMABLES
- Reagents, media, and serum
- Disposables
-
INSTRUMENTS
- Cell expansion supporting equipment
- Bioreactors
- Automated cell expansion systems
-
CONSUMABLES
-
Cell counting
-
CONSUMABLES AND ACCESSORIES
- Reagents
- Assay kits
- Microplates
- Accessories
- Others
-
INSTRUMENTS
- Spectrophotometers
- Flow cytometers
- Hematology analyzers
- Cell counters
-
CONSUMABLES AND ACCESSORIES
-
Cell line development
-
EQUIPMENT
- Biosafety cabinets
- Cell counters & viability analysis systems
- Incubators
- Centrifuges
- Bioreactors
- Storage equipment
- Automation systems
- Microscopes
- Filtration systems
- Other cell line development equipment
-
MEDIA & REAGENTS
- Sera
- Media
- Reagents
-
EQUIPMENT
-
Flow Cytometry
- Reagents and consumables
- Instruments
- Accessories
-
Single-use Bioprocessing
- Media bags and containers
- Filtration assemblies
- Disposable/single-use bioreactors
- Disposable mixers
- Other products (tubing, connectors, and samplers)
-
Biologics Safety Testing
- Kits & reagents
- Instruments
-
Virus Filtration
- Kits and reagents
- Filtration systems
- Other products
-
Tangential Flow Filtration
- Single-use systems
- Reusable systems
- Membrane filters
- Filtration accessories
-
Pyrogen Testing
- Kits and reagents
- Instruments
Global top 10 bioprocess technology Market, by Region
-
North America
- U.S.
- Canada
- Europe
- Asia
- Rest of the World
Available Customizations
With the given market data, MarketsandMarkets offers customizations as per the company’s specific needs. The following customization options are available for the report:
Geographic Analysis
- Further breakdown of the top 10 bioprocess technology market into specific countries/regions in Asia, Europe, and Rest of The World
Company Information
- Detailed analysis and profiling of additional market players (Up to 5)
The top 10 bioprocess technology market is expected to USD 71.03 Billion by 2021 from USD 39.30 Billion in 2016, at a CAGR of 12.4% between 2016 and 2021. Growth in the biopharmaceutical industry, increase in R&D spending, rising demand for vaccine production, and technological advancements form important growth drivers for this market during the forecast period. The rising opportunities in emerging market and increasing pharmaceutical outsourcing provide significant growth opportunities for players operating in the top 10 bioprocess technology market.
The report provides an overall understanding of the global top 10 bioprocess technology market. It segments the global market on the basis of type and region. On the basis of type, the market is segmented into cell culture, cell expansion, cell counting, cell line development, flow cytometry, single-use bioprocessing, biologics safety testing, virus filtration, tangential flow filtration, and pyrogen testing. In 2016, the cell culture segment is expected to account for the largest share of the global top 10 bioprocess technology market. The largest share of this segment is primarily attributed to the repeated purchase of consumables as compared to equipment and increase in funding for cell-based research.
On the basis of region, the market is segmented into North America, Europe, Asia, and RoW. The report maps each bioprocess technology in these geographic and regional segments. In 2016, North America is expected to account for the largest share of the global top 10 bioprocess technology market. Growth in this market can be attributed to the increase in demand of high quality biologics and rising spending on R&D by top players in this region. Similarly, Asia is estimated to grow at the highest CAGR during the forecast period. The wide applications of bioprocess technology in the biopharmaceutical and pharmaceutical industry are expected to drive the demand for top 10 bioprocess technology market in this region.
The major players in top 10 bioprocess technology market include GE Healthcare (U.S.), Danaher Corporation (U.S.), Thermo Fisher Scientific, Inc. (U.S.), Becton, Dickinson and Company (U.S.), Lonza Group AG (Switzerland), Merck Millipore (Germany), Sartorius Stedim Biotech S.A (France), Corning, Inc. (U.S.), Bio-Rad Laboratories (U.S.), and Charles River Laboratories (U.S.).
To speak to our analyst for a discussion on the above findings, click Speak to Analyst
 Exclusive indicates content/data unique to MarketsandMarkets and not available with any competitors.
Table of Contents
1 Introduction (Page No. - 20)
1.1 Objectives of the Study
1.2 Top 10 Bioprocess Technology Market Definition
1.2.1 Markets Covered
1.2.2 Years Considered in the Report
1.3 Currency
1.4 Limitations
1.5 Stakeholders
2 Research Methodology (Page No. - 25)
2.1 Top 10 Bioprocess Technology Market Size Estimation
2.2 Top 10 Bioprocess Technology Market Breakdown and Data Triangulation
2.3 Top 10 Bioprocess Technology Market Share Estimation
2.3.1 Key Data From Secondary Sources
2.3.2 Key Data From Primary Sources
2.3.3 Assumptions for the Study
3 Executive Summary (Page No. - 32)
3.1 Introduction
3.2 Future Outlook
3.3 Conclusion
4 Premium Insights (Page No. - 37)
4.1 Top 10 Bioprocess Technology Market Overview
4.2 Top 10 Bioprocess Technology Market: By Top 4 Technologies & Regions
4.3 Top 10 Bioprocess Technology Market: Geographic Snapshot
4.4 Top 10 Bioprocess Technology Market, By Type
4.5 Life Cycle Analysis, By Region (2016)
5 Market Overview (Page No. - 41)
5.1 Introduction
5.1.1 Drivers
5.1.1.1 Growth in the Biopharmaceutical Industry
5.1.1.2 Increase in R&D Spending in Developed Economies
5.1.1.3 Increasing Demand for Vaccines
5.1.1.4 Technological Advancements
5.1.1.5 Growing Prevalence of HIV and Cancer
5.1.1.6 Increasing Number of New Drug Launches
5.1.2 Restraints
5.1.2.1 Stringent Regulatory Policies
5.1.2.2 High Cost of Instruments
5.1.3 Opportunities
5.1.3.1 Rising Opportunities in Emerging Markets
5.1.3.2 Increasing Pharmaceutical Outsourcing
5.1.4 Challenges
5.1.4.1 Requirement of High Capital Investments to Set Up New Production Facilities
5.1.4.2 Complexities in Reagent Development
6 Top 10 Bioprocess Technology Market, By Type (Page No. - 49)
6.1 Introduction
6.2 Cell Culture
6.2.1 Equipment
6.2.1.1 Cell Culture Supporting Equipment
6.2.1.2 Cell Culture Storage Equipment
6.2.1.3 Cell Culture Vessels
6.2.1.4 Bioreactors
6.2.2 Consumables
6.2.2.1 Sera
6.2.2.2 Media
6.2.2.3 Reagents
6.2.2.4 Bioreactor Accessories
6.3 Cell Expansion
6.3.1 Consumables
6.3.1.1 Reagents, Media, and Serum
6.3.1.2 Disposables
6.3.2 Instruments
6.3.2.1 Cell Expansion Supporting Equipment
6.3.2.2 Bioreactors
6.3.2.3 Automated Cell Expansion Systems
6.4 Cell Counting
6.4.1 Consumables and Accessories
6.4.1.1 Reagents
6.4.1.2 Assay Kits
6.4.1.3 Microplates
6.4.1.4 Accessories
6.4.1.5 Others
6.4.2 Instruments
6.4.2.1 Spectrophotometers
6.4.2.2 Flow Cytometers
6.4.2.3 Hematology Analyzers
6.4.2.4 Cell Counters
6.5 Cell Line Development
6.5.1 Equipment
6.5.1.1 Biosafety Cabinets
6.5.1.2 Cell Counters & Viability Analysis Systems
6.5.1.3 Incubators
6.5.1.4 Centrifuges
6.5.1.5 Bioreactors
6.5.1.6 Storage Equipment
6.5.1.7 Automation Systems
6.5.1.8 Microscopes
6.5.1.9 Filtration Systems
6.5.1.10 Other Cell Line Development Equipment
6.5.2 Media & Reagents
6.5.2.1 Sera
6.5.2.2 Media
6.5.2.3 Reagents
6.6 Flow Cytometry
6.6.1 Reagents and Consumables
6.6.2 Instruments
6.6.3 Accessories
6.7 Single-Use Bioprocessing
6.7.1 Media Bags and Containers
6.7.2 Filtration Assemblies
6.7.3 Disposable/Single-Use Bioreactors
6.7.4 Disposable Mixers
6.7.5 Other Products (Tubing, Connectors, and Samplers)
6.8 Biologics Safety Testing
6.8.1 Kits & Reagents
6.8.2 Instruments
6.9 Virus Filtration
6.9.1 Kits and Reagents
6.9.2 Filtration Systems
6.9.3 Other Products
6.10 Tangential Flow Filtration
6.10.1 Single-Use Systems
6.10.2 Reusable Systems
6.10.3 Membrane Filters
6.10.4 Filtration Accessories
6.11 Pyrogen Testing
6.11.1 Kits and Reagents
6.11.2 Instruments
7 Top 10 Bioprocess Technology Market, By Region (Page No. - 128)
7.1 Introduction
7.2 North America
7.2.1 U.S.
7.2.2 Canada
7.3 Europe
7.4 Asia
7.5 Rest of the World (RoW)
8 Competitive Landscape (Page No. - 181)
8.1 Introduction
8.2 Strategic Analysis
8.3 Market Share Analysis
8.4 Competitive Situation and Trends
8.4.1 Product Launches
8.4.2 Agreements, Collaborations, and Partnerships
8.4.3 Mergers & Acquisitions
8.4.4 Expansions
8.4.5 Approvals
8.4.6 Other Strategies
9 Company Profiles (Page No. - 190)
(Overview, Products and Services, Financials, Strategy & Development)*
9.1 Introduction
9.2 Thermo Fisher Scientific, Inc.
9.3 Merck Millipore
9.4 Bio-Rad Laboratories, Inc.
9.5 GE Healthcare
9.6 Danaher Corporation
9.7 Lonza Group AG
9.8 Charles River Laboratories, Inc.
9.9 Becton, Dickinson and Company
9.10 Sartorius Stedim Biotech S.A.
9.11 Corning, Inc.
*Details on Overview, Products and Services, Financials, Strategy & Development Might Not Be Captured in Case of Unlisted Companies.
10 Appendix (Page No. - 237)
10.1 Insights of Industry Experts
10.2 Discussion Guide
10.3 Other Developments
10.4 Knowledge Store: Marketsandmarkets’ Subscription Portal
10.5 Introducing RT: Real-Time Market Intelligence
10.6 Available Customizations
10.7 Related Reports
10.8 Author Details
List of Tables (219)
Table 1 Global Top 10 Bioprocess Technology Market Summary
Table 2 Global Top 10 Bioprocess Technology Market Size, By Type, 2014-2021 (USD Billion)
Table 3 Global Cell Culture Market Size, By Product, 2014–2021 (USD Billion)
Table 4 Global Cell Culture Market Size, By Region, 2014–2021 (USD Billion)
Table 5 North America: Cell Culture Market Size, By Country, 2014–2021 (USD Billion)
Table 6 Global Cell Culture Equipment Market Size, By Product, 2014–2021 (USD Billion)
Table 7 Global Cell Culture Equipment Market Size, By Region, 2014–2021 (USD Billion)
Table 8 North America: Cell Culture Equipment Market Size, By Country, 2014–2021 (USD Billion)
Table 9 Global Cell Culture Supporting Equipment Market Size, By Region, 2014–2021 (USD Billion)
Table 10 Global Cell Culture Storage Equipment Market Size, By Region, 2014–2021 (USD Million)
Table 11 Global Cell Culture Vessels Market Size, By Region, 2014–2021 (USD Million)
Table 12 Global Cell Culture Bioreactors Market Size, By Region, 2014–2021 (USD Million)
Table 13 Global Cell Culture Consumables Market Size, By Type, 2014–2021 (USD Billion)
Table 14 Global Cell Culture Consumables Market Size, By Region, 2014–2021 (USD Billion)
Table 15 North America: Cell Culture Consumables Market Size, By Country, 2014–2021 (USD Billion)
Table 16 Global Cell Culture Sera Market Size, By Region, 2014–2021 (USD Million)
Table 17 Global Cell Culture Media Market Size, By Region, 2014–2021 (USD Billion)
Table 18 Global Cell Culture Reagents Market Size, By Region, 2014–2021 (USD Billion)
Table 19 Global Cell Culture Bioreactor Accessories Market Size, By Region, 2014–2021 (USD Million)
Table 20 Global Cell Expansion Market Size, By Product, 2014–2021 (USD Billion)
Table 21 Global Cell Expansion Market Size, By Region, 2014–2021 (USD Billion)
Table 22 North America: Cell Expansion Market, By Country, 2014–2021 (USD Billion)
Table 23 Global Cell Expansion Consumables Market Size, By Type, 2014–2021 (USD Billion)
Table 24 Global Cell Expansion Consumables Market Size, By Region, 2014–2021 (USD Billion)
Table 25 North America: Cell Expansion Consumables Market Size, By Country, 2014–2021 (USD Billion)
Table 26 Global Cell Expansion Reagents, Media, and Sera Market Size, By Region, 2014–2021 (USD Billion)
Table 27 Global Cell Expansion Disposables Market Size, By Region, 2014–2021 (USD Billion)
Table 28 Global Cell Expansion Instruments Market Size, By Type, 2014–2021 (USD Billion)
Table 29 Global Cell Expansion Instruments Market Size, By Region, 2014–2021 (USD Billion)
Table 30 North America: Cell Expansion Instruments Market Size, By Country, 2014–2021 (USD Billion)
Table 31 Global Cell Expansion Supporting Equipment Market Size, By Region, 2014–2021 (USD Billion)
Table 32 Global Cell Expansion Bioreactors Market Size, By Region, 2014–2021 (USD Million)
Table 33 Global Automated Cell Expansion Systems Market Size, By Region, 2014–2021 (USD Million)
Table 34 Global Cell Counting Market Size, By Product, 2014–2021 (USD Billion)
Table 35 Global Cell Counting Market Size, By Region, 2014–2021 (USD Billion)
Table 36 North America: Cell Counting Market Size, By Country, 2014–2021 (USD Billion)
Table 37 Global Cell Counting Consumables and Accessories Market Size, By Type, 2014–2021 (USD Billion)
Table 38 Global Cell Counting Consumables and Accessories Market Size, By Region, 2014–2021 (USD Billion)
Table 39 North America: Cell Counting Consumables and Accessories Market Size, By Country, 2014–2021 (USD Billion)
Table 40 Global Cell Counting Reagents Market Size, By Region, 2014–2021 (USD Billion)
Table 41 Global Cell Counting Assay Kits Market Size, By Region, 2014–2021 (USD Billion)
Table 42 Global Cell Counting Microplates Market Size, By Region, 2014–2021 (USD Million)
Table 43 Global Cell Counting Accessories Market Size, By Region, 2014–2021 (USD Million)
Table 44 Global Other Cell Counting Consumables & Accessories Market Size, By Region, 2014–2021 (USD Million)
Table 45 Global Cell Counting Instruments Market Size, By Type, 2014–2021 (USD Billion)
Table 46 Global Cell Counting Instruments Market Size, By Region, 2014–2021 (USD Billion)
Table 47 North America: Cell Counting Instruments Market Size, By Country, 2014–2021 (USD Billion)
Table 48 Global Spectrophotometers Market Size, By Region, 2014–2021 (USD Billion)
Table 49 Global Flow Cytometers Market Size, By Region, 2014–2021 (USD Billion)
Table 50 Global Hematology Analyzers Market Size, By Region, 2014–2021 (USD Billion)
Table 51 Global Cell Counters Market Size, By Region, 2014–2021 (USD Million)
Table 52 Global Cell Line Development Market Size, By Product, 2014–2021 (USD Billion)
Table 53 Global Cell Line Development Market Size, By Region, 2014–2021 (USD Billion)
Table 54 North America: Cell Line Development Market Size, By Country, 2014–2021 (USD Million)
Table 55 Global Cell Line Development Equipment Market Size, By Type, 2014–2021 (USD Million)
Table 56 Global Cell Line Development Equipment Market Size, By Region, 2014–2021 (USD Billion)
Table 57 North America: Cell Line Development Equipment Market Size, By Country, 2014–2021 (USD Million)
Table 58 Global Biosafety Cabinets Market Size for Cell Line Development, By Region, 2014–2021 (USD Million)
Table 59 Global Cell Counters & Viability Analysis Systems Market Size for Cell Line Development, By Region, 2014–2021 (USD Million)
Table 60 Global Incubators Market Size for Cell Line Development, By Region, 2014–2021 (USD Million)
Table 61 Global Centrifuges Market Size for Cell Line Development, By Region, 2014–2021 (USD Million)
Table 62 Global Bioreactors Market Size for Cell Line Development, By Region, 2014–2021 (USD Million)
Table 63 Global Storage Equipment Market Size for Cell Line Development, By Region, 2014–2021 (USD Million)
Table 64 Global Automated Systems Market Size for Cell Line Development, By Region, 2014–2021 (USD Million)
Table 65 Global Microscopes Market Size for Cell Line Development, By Region, 2014–2021 (USD Million)
Table 66 Global Filtration Systems Market Size for Cell Line Development, By Region, 2014–2021 (USD Million)
Table 67 Global Other Cell Line Development Equipment Market Size, By Region, 2014–2021 (USD Million)
Table 68 Global Cell Line Development Media & Reagents Market Size, By Type, 2014–2021 (USD Million)
Table 69 Global Cell Line Development Media & Reagents Market Size, By Region, 2014–2021 (USD Million)
Table 70 Global Cell Line Development Sera Market Size, By Region, 2014–2021 (USD Million)
Table 71 Global Cell Line Development Media Market Size, By Region, 2014–2021 (USD Million)
Table 72 Global Cell Line Development Reagents Market Size, By Region, 2014–2021 (USD Million)
Table 73 Global Flow Cytometry Market Size, By Product, 2014–2021 (USD Billion)
Table 74 Global Flow Cytometry Market Size, By Region, 2014–2021 (USD Billion)
Table 75 Global Flow Cytometry Reagents & Consumables Market Size, By Region, 2014–2021 (USD Billion)
Table 76 Global Flow Cytometry Instruments Market Size, By Region, 2014–2021 (USD Billion)
Table 77 Global Flow Cytometry Accessories Market Size, By Region, 2014–2021 (USD Million)
Table 78 Global Single-Use Bioprocessing Market Size, By Product, 2014–2021 (USD Million)
Table 79 Global Single-Use Bioprocessing Market Size, By Region, 2014–2021 (USD Billion)
Table 80 North America: Single-Use Bioprocessing Market Size, By Country, 2014–2021 (USD Billion)
Table 81 Global Single-Use Bioprocessing Market Size for Media Bags and Containers, By Region, 2014–2021 (USD Billion)
Table 82 North America: Single-Use Bioprocessing Market Size for Media Bags and Containers, By Country, 2014–2021 (USD Million)
Table 83 Global Single-Use Bioprocessing Market Size for Filtration Assemblies, By Region, 2014–2021 (USD Billion)
Table 84 North America: Single-Use Bioprocessing Market Size for Filtration Assemblies, By Country, 2014–2021 (USD Million)
Table 85 Global Single-Use Bioprocessing Market Size for Single-Use Bioreactors, By Region, 2014–2021 (USD Million)
Table 86 North America: Single-Use Bioprocessing Market Size for Single-Use Bioreactors, By Country, 2014–2021 (USD Million)
Table 87 Global Single-Use Bioprocessing Market Size for Disposable Mixers, By Region, 2014–2021 (USD Million)
Table 88 North America: Single-Use Bioprocessing Market Size for Disposable Mixers, By Country, 2014–2021 (USD Million)
Table 89 Global Single-Use Bioprocessing Market Size for Other Products, By Region, 2014–2021 (USD Million)
Table 90 North America: Single-Use Bioprocessing Market Size for Other Products, By Country, 2014–2021 (USD Million)
Table 91 Global Biologics Safety Testing Market Size, By Product, 2014–2021 (USD Million)
Table 92 Global Biologics Safety Testing Market Size, By Region, 2014–2021 (USD Billion)
Table 93 North America: Biologics Safety Testing Market Size, By Country, 2014–2021 (USD Billion)
Table 94 Global Biologics Safety Testing Market Size for Kits & Reagents, By Region, 2014–2021 (USD Million)
Table 95 North America: Biologics Safety Testing Market Size for Kits & Reagents, By Country, 2014–2021 (USD Billion)
Table 96 Global Biologics Safety Testing Market Size for Instruments, By Region, 2014–2021 (USD Million)
Table 97 North America: Biologics Safety Testing Market Size for Instruments, By Country, 2014–2021 (USD Million)
Table 98 Global Virus Filtration Market Size, By Product, 2014–2021 (USD Million)
Table 99 Global Virus Filtration Market Size, By Region, 2014–2021 (USD Billion)
Table 100 Global Virus Filtration Market Size for Kits & Reagents, By Region, 2014–2021 (USD Million)
Table 101 Global Virus Filtration Market Size for Filtration Systems, By Region, 2014–2021 (USD Million)
Table 102 Global Virus Filtration Market Size for Other Products, By Region, 2014–2021 (USD Million)
Table 103 Global Tangential Flow Filtration Market Size, By Product, 2014–2021 (USD Million)
Table 104 Global Tangential Flow Filtration Market Size, By Region, 2014–2021 (USD Million)
Table 105 North America: Tangential Flow Filtration Market Size, By Country, 2014–2021 (USD Million)
Table 106 Global Tangential Flow Filtration Market Size for Single-Use Systems, By Region, 2014–2021 (USD Million)
Table 107 North America: Tangential Flow Filtration Market Size for Single-Use Systems, By Country, 2014–2021 (USD Million)
Table 108 Global Tangential Flow Filtration Market Size for Reusable Systems, By Region, 2014–2021 (USD Million)
Table 109 North America: Tangential Flow Filtration Market Size for Reusable Systems, By Country, 2014–2021 (USD Million)
Table 110 Global Tangential Flow Filtration Market Size for Membrane Filters, By Region, 2014–2021 (USD Million)
Table 111 North America: Tangential Flow Filtration Market Size for Membrane Filters, By Country, 2014–2021 (USD Million)
Table 112 Global Tangential Flow Filtration Market Size for Filtration Accessories, By Region, 2014–2021 (USD Million)
Table 113 North America: Tangential Flow Filtration Market Size for Filtration Accessories, By Country, 2014–2021 (USD Million)
Table 114 Global Pyrogen Testing Market Size, By Product, 2014–2021 (USD Million)
Table 115 Global Pyrogen Testing Market Size, By Region, 2014–2021 (USD Million)
Table 116 North America: Pyrogen Testing Market Size, By Country, 2014–2021 (USD Million)
Table 117 Global Pyrogen Testing Market Size for Kits and Reagents, By Region, 2014–2021 (USD Million)
Table 118 North America: Pyrogen Testing Market for Kits and Reagents, By Country, 2014–2021 (USD Million)
Table 119 Global Pyrogen Testing Market Size for Instruments, By Region, 2014–2021 (USD Million)
Table 120 North America: Pyrogen Testing Market Size for Instruments, By Country, 2014–2021 (USD Million)
Table 121 Global Top 10 Bioprocess Technology Market Size, By Region, 2014–2021 (USD Billion)
Table 122 North America: Top 10 Bioprocess Technology Market Size, By Country, 2014–2021 (USD Billion)
Table 123 North America: Top 10 Bioprocess Technology Market Size, By Type, 2014–2021 (USD Billion)
Table 124 North America: Cell Culture Market Size, By Product, 2014–2021 (USD Billion)
Table 125 North America: Cell Culture Equipment Market Size, By Product, 2014–2021 (USD Billion)
Table 126 North America: Cell Culture Consumables Market Size, By Type, 2014–2021 (USD Billion)
Table 127 North America: Cell Expansion Market Size, By Product, 2014–2021 (USD Billion)
Table 128 North America: Cell Expansion Consumables Market Size, By Type, 2014–2021 (USD Billion)
Table 129 North America: Cell Expansion Instruments Market Size, By Type, 2014–2021 (USD Billion)
Table 130 North America: Cell Counting Market Size, By Product, 2014–2021 (USD Billion)
Table 131 North America: Cell Counting Consumables & Accessories Market Size, By Type, 2014–2021 (USD Million)
Table 132 North America: Cell Counting Instruments Market Size, By Type, 2014–2021 (USD Billion)
Table 133 North America: Cell Line Development Market Size, By Product, 2014–2021 (USD Million)
Table 134 North America: Cell Line Development Equipment Market Size, By Type, 2014–2021 (USD Million)
Table 135 North America: Cell Line Development Media & Reagents Market Size, By Type, 2014–2021 (USD Million)
Table 136 North America: Single-Use Bioprocessing Market Size, By Product, 2014–2021 (USD Million)
Table 137 North America: Flow Cytometry Market Size, By Product, 2014–2021 (USD Million)
Table 138 North America: Virus Filtration Market Size, By Product, 2014–2021 (USD Million)
Table 139 North America: Biologics Safety Testing Market Size, By Product, 2014–2021 (USD Million)
Table 140 North America: Pyrogen Testing Market Size, By Product, 2014–2021 (USD Million)
Table 141 North America: Tangential Flow Filtration Market Size, By Product, 2014–2021 (USD Million)
Table 142 U.S.: Bioprocess Technologies Market Size, By Type, 2014–2021 (USD Billion)
Table 143 U.S.: Cell Culture Market Size, By Product, 2014–2021 (USD Billion)
Table 144 U.S.: Cell Expansion Market Size, By Product, 2014–2021 (USD Billion)
Table 145 U.S.: Cell Counting Market Size, By Product, 2014–2021 (USD Billion)
Table 146 U.S.: Single-Use Bioprocessing Market Size, By Product, 2014–2021 (USD Million)
Table 147 U.S.: Biologics Safety Testing Market Size, By Product, 2014–2021 (USD Million)
Table 148 U.S.: Tangential Flow Filtration Market Size, By Product, 2014–2021 (USD Million)
Table 149 Canada: Bioprocess Technologies Market Size, By Type, 2014–2021 (USD Million)
Table 150 Canada: Cell Culture Market Size, By Product, 2014–2021 (USD Million)
Table 151 Canada: Cell Expansion Market Size, By Product, 2014–2021 (USD Million)
Table 152 Canada: Cell Counting Market Size, By Product, 2014–2021 (USD Million)
Table 153 Canada: Single-Use Bioprocessing Market Size, By Product, 2014–2021 (USD Million)
Table 154 Canada: Biologics Safety Testing Market Size, By Product, 2014–2021 (USD Million)
Table 155 Canada: Tangential Flow Filtration Market Size, By Product, 2014–2021 (USD Million)
Table 156 Europe: Top 10 Bioprocess Technology Market Size, By Type, 2014–2021 (USD Billion)
Table 157 Europe: Cell Culture Market Size, By Product, 2014–2021 (USD Billion)
Table 158 Europe: Cell Culture Equipment Market Size, By Product, 2014–2021 (USD Million)
Table 159 Europe: Cell Culture Consumables Market Size, By Type, 2014–2021 (USD Million)
Table 160 Europe: Cell Expansion Market Size, By Product, 2014–2021 (USD Million)
Table 161 Europe: Cell Expansion Consumables Market Size, By Type, 2014–2021 (USD Million)
Table 162 Europe: Cell Expansion Instruments Market Size, By Type, 2014–2021 (USD Million)
Table 163 Europe: Cell Counting Market Size, By Product, 2014–2021 (USD Million)
Table 164 Europe: Cell Counting Consumables & Accessories Market Size, By Type, 2014–2021 (USD Million)
Table 165 Europe: Cell Counting Instruments Market Size, By Type, 2014–2021 (USD Million)
Table 166 Europe: Cell Line Development Market Size, By Product, 2014–2021 (USD Million)
Table 167 Europe: Cell Line Development Equipment Market Size, By Type, 2014–2021 (USD Million)
Table 168 Europe: Cell Line Development Media & Reagents Market Size, By Type, 2014–2021 (USD Million)
Table 169 Europe: Single-Use Bioprocessing Market Size, By Product, 2014–2021 (USD Million)
Table 170 Europe: Flow Cytometry Market Size, By Product, 2014–2021 (USD Million)
Table 171 Europe: Virus Filtration Market Size, By Product, 2014–2021 (USD Million)
Table 172 Europe: Biologics Safety Testing Market Size, By Product, 2014–2021 (USD Million)
Table 173 Europe: Pyrogen Testing Market Size, By Product, 2014–2021 (USD Million)
Table 174 Europe: Tangential Flow Filtration Market Size, By Product, 2014–2021 (USD Million)
Table 175 Asia: Top 10 Bioprocess Technology Market Size, By Type, 2014–2021 (USD Billion)
Table 176 Asia: Cell Culture Market Size, By Product, 2014–2021 (USD Billion)
Table 177 Asia: Cell Culture Equipment Market Size, By Product, 2014–2021 (USD Million)
Table 178 Asia: Cell Culture Consumables Market Size, By Type, 2014–2021 (USD Million)
Table 179 Asia: Cell Expansion Market Size, By Product, 2014–2021 (USD Million)
Table 180 Asia: Cell Expansion Consumables Market Size, By Type, 2014–2021 (USD Million)
Table 181 Asia: Cell Expansion Instruments Market Size, By Type, 2014–2021 (USD Million)
Table 182 Asia: Cell Counting Market Size, By Product, 2014–2021 (USD Million)
Table 183 Asia: Cell Counting Consumables & Accessories Market Size, By Type, 2014–2021 (USD Million)
Table 184 Asia: Cell Counting Instruments Market Size, By Type, 2014–2021 (USD Million)
Table 185 Asia: Cell Line Development Market Size, By Product, 2014–2021 (USD Million)
Table 186 Asia: Cell Line Development Equipment Market Size, By Type, 2014–2021 (USD Million)
Table 187 Asia: Cell Line Development Media & Reagents Market Size, By Type, 2014–2021 (USD Million)
Table 188 Asia: Single-Use Bioprocessing Market Size, By Product, 2014–2021 (USD Million)
Table 189 Asia: Flow Cytometry Market Size, By Product, 2014–2021 (USD Million)
Table 190 Asia: Virus Filtration Market Size, By Product, 2014–2021 (USD Million)
Table 191 Asia: Biologics Safety Testing Market Size, By Product, 2014–2021 (USD Million)
Table 192 Asia: Pyrogen Testing Market Size, By Product, 2014–2021 (USD Million)
Table 193 Asia: Tangential Flow Filtration Market Size, By Product, 2014–2021 (USD Million)
Table 194 RoW: Top 10 Bioprocess Technology Market Size, By Type, 2014–2021 (USD Million)
Table 195 RoW: Cell Culture Market Size, By Product, 2014–2021 (USD Million)
Table 196 RoW: Cell Culture Equipment Market Size, By Product, 2014–2021 (USD Million)
Table 197 RoW: Cell Culture Consumables Market Size, By Type, 2014–2021 (USD Million)
Table 198 RoW: Cell Expansion Market Size, By Product, 2014–2021 (USD Million)
Table 199 RoW: Cell Expansion Consumables Market Size, By Type, 2014–2021 (USD Million)
Table 200 RoW: Cell Expansion Instruments Market Size, By Type, 2014–2021 (USD Million)
Table 201 RoW: Cell Counting Market Size, By Product, 2014–2021 (USD Million)
Table 202 RoW: Cell Counting Consumables & Accessories Market Size, By Type, 2014–2021 (USD Million)
Table 203 RoW: Cell Counting Instruments Market Size, By Type, 2014–2021 (USD Million)
Table 204 RoW: Cell Line Development Market Size, By Product, 2014–2021 (USD Million)
Table 205 RoW: Cell Line Development Equipment Market Size, By Type, 2014–2021 (USD Million)
Table 206 RoW: Cell Line Development Media & Reagents Market Size, By Type, 2014–2021 (USD Million)
Table 207 RoW: Single-Use Bioprocessing Market Size, By Product, 2014–2021 (USD Million)
Table 208 RoW: Flow Cytometry Market Size, By Product, 2014–2021 (USD Million)
Table 209 RoW: Virus Filtration Market Size, By Product, 2014–2021 (USD Million)
Table 210 RoW: Biologics Safety Testing Market Size, By Product, 2014–2021 (USD Million)
Table 211 RoW: Pyrogen Testing Market Size, By Product, 2014–2021 (USD Million)
Table 212 RoW: Tangential Flow Filtration Market Size, By Product, 2014–2021 (USD Million)
Table 213 Market Developments Between 2014 and 2016
Table 214 Product Launches, 2014–2016
Table 215 Agreements, Collaborations, and Partnerships, 2014–2016
Table 216 Mergers & Acquisitions, 2014–2016
Table 217 Expansions, 2014–2016
Table 218 Approvals, 2014–2016
Table 219 Other Strategies, 2014–2016
List of Figures (46 Figures)
Figure 1 Research Design
Figure 2 Top 10 Bioprocess Technology Market Size Estimation Methodology: Bottom-Up Approach
Figure 3 Top 10 Bioprocess Technology Market Size Estimation Methodology: Top-Down Approach
Figure 4 Breakdown of Primary Interviews: By Company Type, Designation, and Region
Figure 5 Data Triangulation Methodology
Figure 6 Single-Use Bioprocessing to Be the Fastest-Growing Segment in the Global Top 10 Bioprocess Technology Market
Figure 7 Geographical Snapshot: North America to Dominate the Top 10 Bioprocess Technology Market in 2016
Figure 8 North America to Account for the Largest Share of the Top 10 Bioprocess Technology Market in 2016
Figure 9 Rapid Growth in the Biopharmaceutical Industry to Drive Market Growth
Figure 10 Cell Culture Technology Segment to Command the Largest Market Share in 2016
Figure 11 Asia to Register Highest Growth During the Forecast Period
Figure 12 Single-Use Bioprocessing to Be the Fastest-Growing Technology Segment During the Forecast Period
Figure 13 Asia Presents Lucrative Growth Opportunities for Players in the Top 10 Bioprocess Technology Market
Figure 14 Bioprocess Technologies Market: Drivers, Restraints, Opportunities, and Challenges
Figure 15 R&D Expenditure of Phrma Members, 2000–2014 (USD Billion)
Figure 16 Number of New Pharmaceutical Drugs Launched, 2003–2013
Figure 17 Top 10 Bioprocess Technology Market, By Type, 2016 vs 2021
Figure 18 Consumables Command the Largest Share of the Cell Culture Market, By Product, in 2016
Figure 19 Consumables Command the Largest Share of the Cell Expansion Market, By Product, in 2016
Figure 20 Consumables & Accessories Command the Largest Share of the Cell Counting Market, By Product, in 2016
Figure 21 Media & Reagents to Dominate the Cell Line Development Market in 2016
Figure 22 Reagents & Consumables Command the Largest Share of the Flow Cytometry Market, By Product, in 2016
Figure 23 Media Bags and Containers to Dominate the Single-Use Bioprocessing Products Market in 2016
Figure 24 Kits & Reagents to Register the Highest CAGR in the Biologics Safety Testing Market During the Forecast Period
Figure 25 Kits & Reagents Segment to Dominate the Global Virus Filtration Market in 2016
Figure 26 Single-Use Systems Segment to Dominate the Tangential Flow Filtration Market in 2016
Figure 27 Kits & Reagents Segment to Account for the Largest Share of the Pyrogen Testing Market in 2016
Figure 28 Geographic Snapshot: Asia to Grow at the Highest CAGR During 2016-2021
Figure 29 Single-Use Bioprocessing to Witness High Growth in the Global Top 10 Bioprocess Technology Market
Figure 30 North America: Market Snapshot
Figure 31 U.S. to Dominate the North American Top 10 Bioprocess Technology Market
Figure 32 Europe: Market Snapshot
Figure 33 Asia: Market Snapshot
Figure 34 Key Developments in the Top 10 Bioprocess Technology Market, 2014–2016
Figure 35 Top 10 Bioprocess Technology Market Share Analysis, By Key Player, 2015
Figure 36 Geographic Revenue Mix of the Top 5 Players in the Top 10 Bioprocess Technology Market
Figure 37 Thermo Fisher Scientific, Inc.: Company Snapshot
Figure 38 Merck Millipore: Company Snapshot
Figure 39 Bio-Rad Laboratories: Company Snapshot
Figure 40 GE Healthcare: Company Snapshot
Figure 41 Danaher Corporation: Company Snapshot
Figure 42 Lonza Group AG: Company Snapshot
Figure 43 Charles River Laboratories, Inc. : Company Snapshot
Figure 44 Becton, Dickinson and Company: Company Snapshot
Figure 45 Sartorius Stedim Biotech S.A.: Company Snapshot
Figure 46 Corning, Inc.: Company Snapshot

 Generating Response ...


Growth opportunities and latent adjacency in Top 10 Bioprocess Technology Market