The study involved four major activities in estimating the market size of the technical ceramics market. Exhaustive secondary research was done to collect information on the market, the peer market, and the parent market. The next step was to validate these findings, assumptions, and sizing with industry experts across the value chain through primary research. Both top-down and bottom-up approaches were employed to estimate the complete market size. Thereafter, the market breakdown and data triangulation procedures were used to estimate the market size of the segments and subsegments.
Secondary Research
In the secondary research process, various secondary sources have been referred to for identifying and collecting information for this study. These secondary sources include annual reports, press releases, investor presentations of companies, white papers, certified publications, trade directories, certified publications, articles from recognized authors, gold standard and silver standard websites, and databases.
Secondary research has been used to obtain key information about the value chain of the industry, monetary chain of the market, the total pool of key technical ceramics, market classification and segmentation according to industry trends to the bottom-most level, and regional markets. It was also used to obtain information about the key developments from a market-oriented perspective.
Primary Research
The technical ceramics market comprises several stakeholders in the value chain, which include raw material suppliers, manufacturers, and end users. Various primary sources from the supply and demand sides of the technical ceramics market have been interviewed to obtain qualitative and quantitative information. The primary interviewees from the demand side include key opinion leaders in end-use sectors. The primary sources from the supply side include manufacturers, associations, and institutions involved in the technical ceramics industry.
Primary interviews were conducted to gather insights such as market statistics, data of revenue collected from the products and services, market breakdowns, market size estimations, market forecasting, and data triangulation. Primary research also helped in understanding the various trends related to material, product type, end-use industry, and region. Stakeholders from the demand side, such as CIOs, CTOs, and CSOs were interviewed to understand the buyer’s perspective on the suppliers, products, component providers, and their current usage of technical ceramics and the future outlook of their business which will affect the overall market.
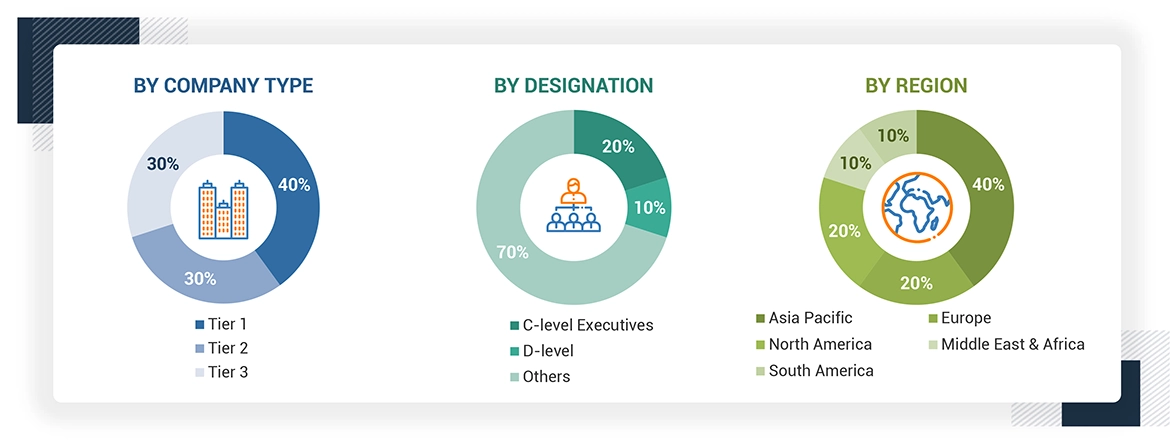
The breakdown of profiles of the primary interviewees is illustrated in the figure below:
To know about the assumptions considered for the study, download the pdf brochure
Note: Tier 1, Tier 2, and Tier 3 companies are classified based on their market revenue in 2023 available in the public domain, product portfolios, and geographical presence.
Other designations include sales representatives, production heads, and technicians.
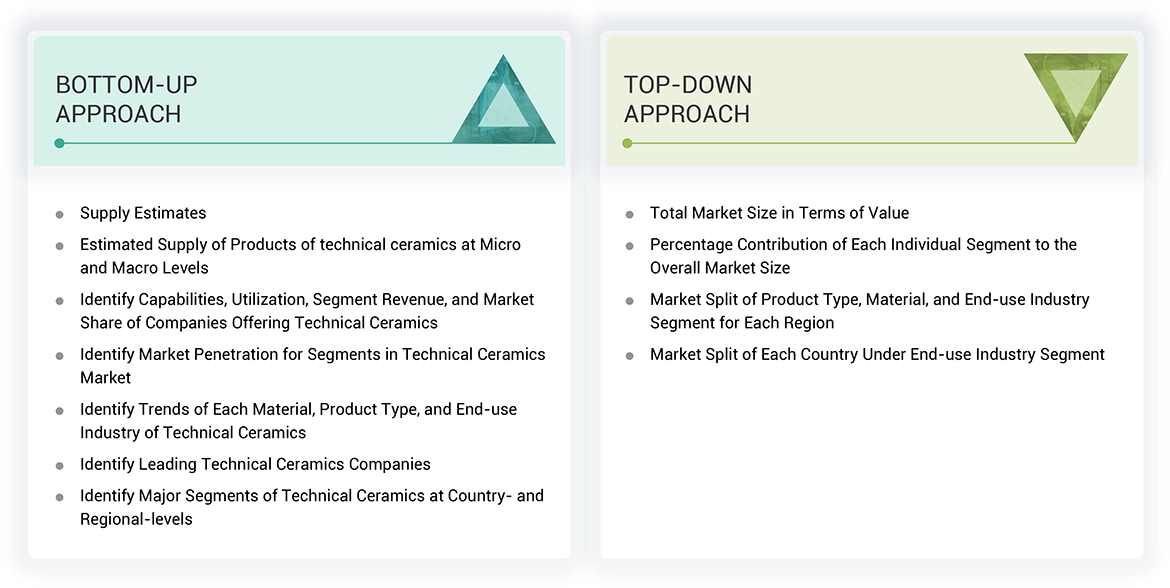
Market Size Estimation
The top-down approach was used to estimate and validate the size of various submarkets for technical ceramics for each region. The research methodology used to estimate the market size included the following steps:
-
The key players in the industry have been identified through extensive secondary research.
-
The supply chain of the industry has been determined through primary and secondary research.
-
The global market was then segmented into five major regions and validated by industry experts.
-
All percentage shares, splits, and breakdowns based on application, end-use industry, and region were determined using secondary sources and verified through primary sources.
-
All possible parameters that affect the markets covered in this research study were accounted for, viewed in extensive detail, verified through primary research, and analyzed to get the final quantitative and qualitative data. This data was consolidated and added with detailed inputs and analysis and presented in this report.
Data Triangulation
After arriving at the total market size from the estimation process technical ceramics above, the overall market has been split into several segments and sub-segments. To complete the overall market engineering process and arrive at the exact statistics for all the segments and sub-segments, the data triangulation and market breakdown procedures have been employed, wherever applicable. The data has been triangulated by studying various factors and trends from both the demand and supply sides. Along with this, the market size has been validated by using both the top-down and bottom-up approaches and primary interviews. Hence, for every data segment, there have been three sources—top-down approach, bottom-up approach, and expert interviews. The data was assumed correct when the values arrived from the three sources matched.
Market Definition
Technical ceramics are used for engineering applications as they are inorganic, non-metallic ceramic products. They carry excellent properties such as high performance and temperature stability, increased toughness, low thermal expansion, and various electrical properties such as excellent dielectric strength, electrical resistance, and electrical insulation for insulators and semiconductors. In the electronics & semiconductor end-use industry oxide ceramics are the most widely used material type as they possess high fracture toughness, wear resistance, and temperature resistance properties. Whereas non oxide ceramics are widely used in aerospace industry for manufacturing of components such as turbine blades, nozzles, and heat exchangers due to their excellent wear resistance and high-temperature capabilities. Additionally, these ceramics are used as coatings in automotive industry.
Stakeholders
-
Technical Ceramics Manufacturers
-
Technical Ceramics Traders, Distributors, and Suppliers
-
Raw Type Suppliers
-
Government and Private Research Organizations
-
Associations and Industrial Bodies
-
R&D Institutions
-
Environmental Support Agencies
Report Objectives
-
To define, describe, and forecast the technical ceramics market size in terms of value and volume
-
To provide detailed information regarding the drivers, restraints, opportunities, and challenges influencing the growth of the technical ceramics market
-
To analyze and forecast the market by material, product type, end-use industry, and region
-
To describe and forecast the market with respect to five main regions: North America, Europe, Asia Pacific, South America, and the Middle East & Africa, along with their key countries
-
To analyze opportunities for stakeholders by identifying high-growth segments of the technical ceramics market
-
To strategically analyze the ecosystem, Porter’s Five Forces, technology analysis, tariffs and regulations, patent landscape, trade landscape, key conferences and events, and case studies/use cases pertaining to the market under study
-
To strategically analyze micromarkets with respect to individual growth trends, prospects, and contributions to the overall market
-
To strategically profile the key players and comprehensively analyze their market positions in terms of their ranking and core competencies, along with detailing the competitive landscape for market leaders
-
To analyze competitive developments such as investments & expansions and mergers & acquisitions.


 HIGHEST CAGR MARKET IN 2023
 CHINA FASTEST GROWING MARKET IN THE REGION


Gaurang
May, 2016
Interested in this report..
Papantonopoulos
Feb, 2015
Data on innovative technology commercialization in Technical Ceramics segment in the Eastern Europe..
Edith
Apr, 2015
Detail raw material and value chain analysis in Technical Ceramics industry segment..