Synthetic Natural Gas Market

Synthetic Natural Gas Market by Source (Coal, Biomass, Renewable Energy), Technology (Anaerobic Digestion & Fermentation, Thermal Gasification, Power to Gas, Fluidized bed gasifier, Entrained flow gasifier), Application & Region - Global Forecast to 2029

Report Code: EP 9010 Apr, 2024, by marketsandmarkets.com

[226 Pages Report] The global synthetic natural gas market is projected to reach USD 68.4 billion by 2029 from an estimated USD 23.9 billion in 2024, at a CAGR of 23.4% during the forecast period. The rise of intermittent renewables necessitates the need for grid balancing and flexibility solutions to match supply with demand. SNG production facilities can be strategically located near renewable energy generation sites, enabling surplus electricity from renewables to be converted into SNG during times of excess generation. This stored energy can then be utilized during peak demand periods or when renewable output is low, thereby enhancing grid stability and resilience.

Synthetic Natural Gas Market

To know about the assumptions considered for the study, Request for Free Sample Report

Synthetic Natural Gas Market Opportunities

To know about the assumptions considered for the study, download the pdf brochure

Synthetic Natural Gas Market Dynamics

Driver: Technological advanacements in Synthetic natural gas Infrastructure

The rising global demand for natural gas, propelled by factors like population growth and industrial expansion, has led to a growing interest in synthetic natural gas (SNG) as a viable solution. SNG, produced through gasification processes using materials such as coal or biomass, offers versatility in sourcing and production. Unlike conventional natural gas, SNG can be synthesized from various feedstocks, providing flexibility in meeting demand. Moreover, SNG presents environmental benefits, with technologies like carbon capture and storage mitigating its carbon footprint. SNG's potential is particularly noteworthy in regions lacking access to conventional natural gas reserves, offering a sustainable energy alternative. The World Bank underscores the role of natural gas in driving industrial growth in developing nations, with its cleaner combustion making it an attractive option for industries like steel and cement manufacturing, especially in light of tightening environmental regulations.

Restraint: Lack of infrastructure in Market

The synthetic natural gas (SNG) market faces significant obstacles due to inadequate infrastructure, inconsistent regulations, and strong competition from traditional energy sources. Regions lacking pipelines and storage facilities, like parts of Africa, struggle to establish the necessary infrastructure for SNG production and distribution. Moreover, varying emissions standards and safety protocols across jurisdictions create uncertainty for investors. Competition from conventional natural gas and renewables further hampers SNG market growth. In regions with abundant natural gas reserves, like the United States, traditional extraction methods offer cost advantages over SNG. Additionally, the decreasing costs of renewable energy technologies, such as solar and wind power, pose a competitive challenge to both natural gas and SNG.

Opportunities: Increased focus on waste-to-energy projects

The increasing focus on waste-to-energy initiatives presents a notable opportunity for the synthetic natural gas (SNG) market, offering a viable pathway to mitigate environmental impact while fulfilling energy needs. Waste-to-energy projects have the potential to utilize diverse waste sources, including landfill gas, municipal solid waste, and agricultural residues, as inputs for SNG production. This not only redirects waste away from landfills but also mitigates greenhouse gas emissions from decomposition, while concurrently generating a valuable source of clean energy. When waste serves as the feedstock for SNG production, the resulting synthetic natural gas can be classified as renewable SNG (RSNG) if the waste source is biogenic. This distinction significantly enhances the sustainability credentials of SNG compared to its production from fossil fuels. For example, in California, facilities specializing in renewable natural gas (RNG) are leveraging landfill gas and sewage biogas to produce environmentally friendly transportation fuel.

Challenges: Leakage of methane

A significant challenge for Synthetic Natural Gas (SNG) to uphold its environmentally friendly reputation lies in methane leakage. Methane, a potent greenhouse gas with over 80 times the short-term warming potential of carbon dioxide, poses a substantial threat to the climate. Even minor leaks during SNG production can release significant amounts of methane, thereby undermining the emissions reductions achieved by substituting SNG for fossil fuels. According to the Natural Resource Defense Council (NRDC), methane is highly effective at trapping heat in the atmosphere, with a warming potential around 30 times greater than that of carbon dioxide over a century. The environmental advantage of SNG hinges on the materials used and the production process employed. If methane leakage is prevalent, it can nullify the lifecycle greenhouse gas benefits that SNG offers compared to conventional natural gas. Leakage incidents can occur at various stages, including production, transportation, and storage of SNG. Therefore, stringent measures are imperative throughout the entire SNG process to mitigate these fugitive methane emissions.

Synthetic Natural Gas market Ecosystem

In this market, prominent companies stand out as well-established and financially stable providers of synthetic natural gas. With years of experience, these companies boast a diverse product portfolio, cutting-edge technologies, and robust global sales and marketing networks. Their proven track record in the industry positions them as reliable and trusted partners for customers seeking synthetic natural gas. These companies have demonstrated their ability to adapt to market dynamics and consistently deliver high-quality products and services, making them leaders in meeting the demands of the energy and power sector. Prominent companies in this market Basin Electric Power Cooperative (US), Air Liquide (France), EnviTec Biogas AG (Germany), Verbio SE (Germany), Kinder Morgan (US).

Synthetic Natural Gas Market Ecosystem

The thermal gassification segment, by application, is expected to be the largest market during the forecast period.

This report segments the synthetic natural gas market based on application into four categories: anaerobic digestion & fermentation, thermal gasification, power-to-gas and others. The thermal gasification segment is expected to be the largest market during the forecast period. The need for effective waste management solutions, especially for organic waste streams like agricultural residues and municipal solid waste, is driving interest in thermal gasification for SNG production. Converting waste into valuable energy products helps address both energy and waste management challenges.

By Application, Transportation is expected to be the fastest growing segment during the forecast period.

This report segments the synthetic natural gas market based on application into four segments: Transportation, power generation, industrial, and grid injection. The transportation segment is expected to be the fastest-growing segment of the synthetic natural gas and transportation market during the forecast period. Consumer demand for vehicles powered by cleaner fuels such as synthetic natural gas (SNG) is experiencing a significant upsurge due to a growing awareness of the environmental consequences of traditional fossil fuels. With increased access to information about climate change and air pollution, consumers are becoming more conscious of their carbon footprint and are actively seeking greener alternatives for their transportation needs.

Europe: The largest growing region in the Synthetic Natural Gas market.

Europe is expected to be the largest region in the synthetic natural gas market between 2024–2029. European partnerships with other countries, such as Japan and South Korea, which are also investing heavily in synthetic natural gas technologies, are accelerating the development of global synthetic natural gas supply chain networks.

Europe Synthetic Natural Gas Market Size, and Share

Key Market Players

The synthetic natural gas market is dominated by a few major players that have a wide regional presence. The major players in the synthetic natural gas market include Basin Electric Power Cooperative (US), Air Liquide (France), EnviTec Biogas AG (Germany), Verbio SE (Germany), Kinder Morgan (US).  Between 2020 and 2024, Strategies such as new product launches, contracts, agreements, partnerships, collaborations, acquisitions, and expansions are followed by these companies to capture a larger share of the synthetic natural gas market.

Get online access to the report on the World's First Market Intelligence Cloud

  • Easy to Download Historical Data & Forecast Numbers
  • Company Analysis Dashboard for high growth potential opportunities
  • Research Analyst Access for customization & queries
  • Competitor Analysis with Interactive dashboard
  • Latest News, Updates & Trend analysis
Request Sample

Scope of the Report

Report Metric

Details

Market size available for years

2019–2029

Base year considered

2023

Forecast period

2024–2029

Forecast units

Value (USD Million/Billion)

Segments Covered

Synthetic natural gas Market by source, technology, application, and Region.

Geographies covered

North America, Europe, Asia Pacific, and RoW.

Companies covered

Basin Electric Power Cooperative (US), Air Liquide (France), EnviTec Biogas AG (Germany), Verbio SE (Germany), Kinder Morgan (US), OPAL Fuels (US), TotalEnergies (France), E. ON SE (Germany), Chevron Corporation (US), Waga Energy (France), Ameresco (US), Shell (UK), Naturgy (Spain), Gevo, Inc (US), EDL (Australia), Electrochaea GmbH (Germany), Future Biogas Limited (Canada), PlanET Biogas Group (Germany), AB Holding SPA (Italy), KIWI AG (Germany), Cycle0 (UK), Archaea Energy inc., (US), TURN2X (Germany), Monarch Bioenergy (US) and Uniper SE (Germany).

This research report categorizes the Synthetic natural gas Market based on source, technology, application and region.

On the basis of Application, the Synthetic natural gas market has been segmented as follows:
  • Transportation
  • Power generation
  • Industrial
  • Grid injection
On the basis of Technology, the Synthetic natural gas market has been segmented as follows:
  • Anaerobic digestion & fermentation
  • Thermal gasification
    • Moving bed gasifier
    • Fluidized bed gasifier
    • Entrained flow gasifier
  • Power-to-gas
  • Others
Based on region, the Synthetic natural gas market has been segmented as follows:
  • North America
  • Europe
  • Asia Pacific
  • RoW

Recent Developments

  • In April 2024, Air Liquide continues to expand its capacities in biomethane, also known as Renewable Natural Gas (RNG) in the U.S., with the construction of two new production units. These units, located in Center Township, Pennsylvania, and Holland Township, Michigan, will treat waste sourced from dairy farms.
  • In April 2024, Brightmark RNG Holdings, a joint venture between Chevron USA Inc. and Brightmark, has opened its Eloy Renewable Natural Gas (RNG) center, producing pipeline fuel by capturing methane from dairy operations. Eloy RNG will produce RNG using anaerobic digesters at the Caballero Dairy farm in Arizona.
  • In April 2024, AMERESCO, A leading cleantech integrator specializing in energy efficiency and renewable ENERGY, DEVELOPED and construct advanced technology biogas cogeneration facility for the Sacramento Area Sewer District located at the EchoWater Resource Recovery Facility which will cost nearly USD 140 million.
  • In March 2024, Electrochaea and Erik Thun AB have signed an agreement to enter negotiations on the off-take of e-methane to be produced by Electrochaea’ s subsidiary BioCAT Roslev Aps in Denmark for usage as maritime fuel in the vessels operated by Erik Thun AB.  

Frequently Asked Questions (FAQ):

To speak to our analyst for a discussion on the above findings, click Speak to Analyst

TABLE OF CONTENTS
 
1 INTRODUCTION (Page No. - 24)
    1.1 STUDY OBJECTIVES 
    1.2 MARKET DEFINITION 
    1.3 INCLUSIONS AND EXCLUSIONS 
    1.4 MARKET SCOPE 
           1.4.1 MARKET SEGMENTATION
           1.4.2 REGIONS COVERED
           1.4.3 YEARS CONSIDERED
           1.4.4 CURRENCY CONSIDERED
           1.4.5 UNITS CONSIDERED
    1.5 LIMITATIONS 
    1.6 STAKEHOLDERS 
    1.7 IMPACT OF RECESSION 
 
2 RESEARCH METHODOLOGY (Page No. - 29)
    2.1 RESEARCH DATA 
    2.2 DATA TRIANGULATION 
    2.3 PRIMARY AND SECONDARY RESEARCH 
           2.3.1 SECONDARY DATA
                    2.3.1.1 List of major secondary sources
                    2.3.1.2 Key data from secondary sources
           2.3.2 PRIMARY DATA
                    2.3.2.1 List of key participants for primary interviews
                    2.3.2.2 Key industry insights
                    2.3.2.3 Breakdown of primary interviews
    2.4 MARKET SIZE ESTIMATION 
           2.4.1 BOTTOM-UP APPROACH
           2.4.2 TOP-DOWN APPROACH
    2.5 DEMAND-SIDE METRICS 
           2.5.1 ASSUMPTIONS FOR DEMAND-SIDE ANALYSIS
           2.5.2 CALCULATIONS FOR DEMAND-SIDE ANALYSIS
    2.6 SUPPLY-SIDE ANALYSIS 
           2.6.1 ASSUMPTIONS FOR SUPPLY-SIDE ANALYSIS
           2.6.2 CALCULATIONS FOR SUPPLY-SIDE ANALYSIS
    2.7 FORECAST 
    2.8 RECESSION IMPACT ANALYSIS 
    2.9 RESEARCH ASSUMPTIONS 
    2.1 RESEARCH LIMITATIONS 
    2.11 RISK ASSESSMENT 
 
3 EXECUTIVE SUMMARY (Page No. - 43)
 
4 PREMIUM INSIGHTS (Page No. - 46)
    4.1 ATTRACTIVE OPPORTUNITIES FOR PLAYERS IN SYNTHETIC NATURAL GAS MARKET 
    4.2 SYNTHETIC NATURAL GAS MARKET, BY SOURCE 
    4.3 SYNTHETIC NATURAL GAS MARKET, BY TECHNOLOGY 
    4.4 SYNTHETIC NATURAL GAS MARKET, BY APPLICATION 
    4.5 SYNTHETIC NATURAL GAS MARKET, BY REGION 
 
5 MARKET OVERVIEW (Page No. - 49)
    5.1 INTRODUCTION 
    5.2 MARKET DYNAMICS 
           5.2.1 DRIVERS
                    5.2.1.1 Growing demand for natural gas
                    5.2.1.2 Rapid technological advancements, increased investments, and energy security considerations
           5.2.2 RESTRAINTS
                    5.2.2.1 Requirement for high initial investments
                    5.2.2.2 Lack of infrastructure, standardized regulatory policies, and intense competition
           5.2.3 OPPORTUNITIES
                    5.2.3.1 Increased focus on waste-to-energy projects to reduce environmental impact
                    5.2.3.2 Incorporation of diverse feedstocks in synthetic natural gas production
           5.2.4 CHALLENGES
                    5.2.4.1 Leakage of methane into atmosphere
                    5.2.4.2 High production costs
    5.3 TRENDS/DISRUPTIONS IMPACTING CUSTOMER BUSINESS 
    5.4 PRICING ANALYSIS 
           5.4.1 AVERAGE SELLING PRICE TREND OF SYNTHETIC NATURAL GAS, BY REGION
           5.4.2 INDICATIVE PRICING ANALYSIS, BY SOURCE
    5.5 SUPPLY CHAIN ANALYSIS 
           5.5.1 RAW MATERIAL PROVIDERS
           5.5.2 TECHNOLOGY/EQUIPMENT PROVIDERS
           5.5.3 EPC PROVIDERS
           5.5.4 SYNTHETIC NATURAL GAS PRODUCERS
           5.5.5 END USERS
    5.6 MARKET MAP 
    5.7 TARIFFS AND REGULATORY LANDSCAPE 
           5.7.1 TARIFFS RELATED TO NATURAL GAS IN GASEOUS STATE
           5.7.2 SYNTHETIC NATURAL GAS MARKET: REGULATORY FRAMEWORK
           5.7.3 REGULATORY BODIES, GOVERNMENT AGENCIES, AND OTHER ORGANIZATIONS
    5.8 PATENT ANALYSIS 
           5.8.1 LIST OF MAJOR PATENTS
    5.9 CASE STUDY ANALYSIS 
           5.9.1 DEVELOPING SUPPORTIVE POLICY FRAMEWORKS FOR BIOMETHANE ADOPTION
                    5.9.1.1 Problem statement
                    5.9.1.2 Solution
           5.9.2 SYNTHETIC NATURAL GAS INTEGRATION IN CHINA’S ENERGY LANDSCAPE
                    5.9.2.1 Problem statement
                    5.9.2.2 Solution
           5.9.3 ENVIROGAS RNG PROJECT TRANSFORMS METHANE EMISSIONS INTO RENEWABLE ENERGY FOR SUSTAINABLE FUTURE
                    5.9.3.1 Problem statement
                    5.9.3.2 Solution
    5.1 TECHNOLOGY ANALYSIS 
           5.10.1 KEY TECHNOLOGIES
                    5.10.1.1 Reforming
                    5.10.1.2 Methanation
           5.10.2 COMPLEMENTARY TECHNOLOGIES
                    5.10.2.1 Carbon capture, utilization, and storage
                    5.10.2.2 High temperature electrolysis
                    5.10.2.3 Advanced catalysts
           5.10.3 ADJACENT TECHNOLOGIES
                    5.10.3.1 Smart grid integration
                    5.10.3.2 Energy storage technologies
                    5.10.3.3 Waste-to-energy technologies
    5.11 KEY CONFERENCES AND EVENTS, 2023–2024 
    5.12 TRADE ANALYSIS 
           5.12.1 EXPORT SCENARIO
           5.12.2 IMPORT SCENARIO
    5.13 PORTER’S FIVE FORCES ANALYSIS 
           5.13.1 THREAT OF SUBSTITUTES
           5.13.2 BARGAINING POWER OF SUPPLIERS
           5.13.3 BARGAINING POWER OF BUYERS
           5.13.4 THREAT OF NEW ENTRANTS
           5.13.5 INTENSITY OF COMPETITIVE RIVALRY
    5.14 KEY STAKEHOLDERS AND BUYING CRITERIA 
           5.14.1 KEY STAKEHOLDERS IN BUYING PROCESS
           5.14.2 BUYING CRITERIA
    5.15 INVESTMENT AND FUNDING SCENARIO 
 
6 SYNTHETIC NATURAL GAS MARKET, BY SOURCE (Page No. - 78)
    6.1 INTRODUCTION 
    6.2 COAL 
           6.2.1 ACCESS TO ABUNDANT AND ECONOMICALLY VIABLE COAL RESERVES TO DRIVE MARKET
    6.3 BIOMASS 
           6.3.1 ABILITY TO ENABLE A GREENER FUTURE TO DRIVE MARKET
    6.4 RENEWABLE ENERGY 
           6.4.1 GOVERNMENT INITIATIVES TO SUPPORT DECARBONIZATION TO DRIVE MARKET
 
7 SYNTHETIC NATURAL GAS MARKET, BY TECHNOLOGY (Page No. - 83)
    7.1 INTRODUCTION 
    7.2 ANAEROBIC DIGESTION & FERMENTATION 
           7.2.1 CORPORATE SUSTAINABILITY INITIATIVES TO DRIVE ADOPTION OF ANAEROBIC DIGESTION AND FERMENTATION TECHNOLOGIES FOR SYNTHETIC NATURAL GAS PRODUCTION
    7.3 THERMAL GASIFICATION 
           7.3.1 INTEGRATION OF THERMAL GASIFICATION PLANTS WITH WASTEWATER TREATMENT FACILITIES TO BE PIVOTAL DRIVER
                    7.3.1.1 Moving bed gasifiers
                    7.3.1.2 Fluidized bed gasifiers
                    7.3.1.3 Entrained flow gasifiers
                    7.3.1.4 Others
    7.4 POWER-TO-GAS 
           7.4.1 USE OF SYNTHETIC NATURAL GAS AS CLEANER ALTERNATIVE TO DRIVE MARKET
    7.5 OTHER TECHNOLOGIES 
 
8 SYNTHETIC NATURAL GAS MARKET, BY APPLICATION (Page No. - 91)
    8.1 INTRODUCTION 
    8.2 TRANSPORTATION 
           8.2.1 SYNTHETIC NATURAL GAS AS ALTERNATIVE TO BEVS IN LONG-HAUL LOGISTICS TO DRIVE MARKET
    8.3 POWER GENERATION 
           8.3.1 TRANSFORMING WASTE INTO CLEAN POWER WITH SYNTHETIC NATURAL GAS TECHNOLOGY TO DRIVE MARKET
    8.4 INDUSTRIAL 
           8.4.1 DIVERSIFICATION OF ENERGY PORTFOLIOS TO DRIVE MARKET
    8.5 GRID INJECTION 
           8.5.1 RISING AWARENESS OF CLEANER ENERGY SOURCES TO DRIVE MARKET
 
9 SYNTHETIC NATURAL GAS MARKET, BY REGION (Page No. - 97)
    9.1 INTRODUCTION 
    9.2 NORTH AMERICA 
           9.2.1 IMPACT OF RECESSION ON SYNTHETIC NATURAL GAS MARKET IN NORTH AMERICA
           9.2.2 US
                    9.2.2.1 Need for sustainable and environmentally friendly alternatives to fossil fuels and collaborative investments to drive market
           9.2.3 CANADA
                    9.2.3.1 Rising government initiatives to foster adoption of renewable energy to propel market
           9.2.4 MEXICO
                    9.2.4.1 Increasing demand for renewable energy to reduce greenhouse gas emissions to drive market
    9.3 EUROPE 
           9.3.1 IMPACT OF RECESSION ON SYNTHETIC NATURAL GAS MARKET IN EUROPE
           9.3.2 GERMANY
                    9.3.2.1 Commitment to renewable energy transition to boost market growth
           9.3.3 UK
                    9.3.3.1 Investing in synthetic natural gas infrastructure for energy security to drive growth
           9.3.4 NORWAY
                    9.3.4.1 Drive for domestic synthetic natural gas production to boost market
           9.3.5 DENMARK
                    9.3.5.1 Enhancing energy resilience with strategic synthetic natural gas storage planning to fuel growth
           9.3.6 SWEDEN
                    9.3.6.1 Increase in public awareness for synthetic natural gas to drive market
           9.3.7 FRANCE
                    9.3.7.1 Harnessing biomass power for clean energy to drive market
           9.3.8 ITALY
                    9.3.8.1 Green gas strategy for limited reserves to drive growth
           9.3.9 REST OF EUROPE
    9.4 ASIA PACIFIC 
           9.4.1 IMPACT OF RECESSION ON SYNTHETIC NATURAL GAS MARKET IN ASIA PACIFIC
           9.4.2 CHINA
                    9.4.2.1 Emphasis on harnessing agricultural and organic wastes to generate biomethane to drive market
           9.4.3 INDIA
                    9.4.3.1 Accelerating biomethane adoption for clean energy and circular economy transformation to boost market
           9.4.4 REST OF ASIA PACIFIC
    9.5 ROW 
           9.5.1 IMPACT OF RECESSION ON SYNTHETIC NATURAL GAS MARKET IN ROW
           9.5.2 SOUTH & CENTRAL AMERICA
                    9.5.2.1 Need for decarbonization and meeting fuel demand from energy sector to drive market
           9.5.3 MIDDLE EAST & AFRICA
                    9.5.3.1 Leveraging abundant biomass resources and rising focus on exploring more sustainable energy sources to drive market
 
10 COMPETITIVE LANDSCAPE (Page No. - 135)
     10.1 OVERVIEW 
     10.2 STRATEGIES ADOPTED BY KEY PLAYERS 
     10.3 MARKET SHARE ANALYSIS 
     10.4 RANKING OF KEY PLAYERS 
     10.5 MARKET EVALUATION FRAMEWORK 
     10.6 REVENUE ANALYSIS 
     10.7 COMPANY VALUATION AND FINANCIAL MATRIX 
     10.8 BRAND COMPARISON 
     10.9 COMPANY EVALUATION MATRIX: KEY PLAYERS, 2023 
             10.9.1 STARS
             10.9.2 EMERGING LEADERS
             10.9.3 PERVASIVE PLAYERS
             10.9.4 PARTICIPANTS
             10.9.5 COMPANY FOOTPRINT: KEY PLAYERS, 2023
                       10.9.5.1 Product footprint
                       10.9.5.2 Market footprint
                       10.9.5.3 Regional footprint
                       10.9.5.4 Source footprint
                       10.9.5.5 Technology footprint
                       10.9.5.6 Application footprint
     10.1 COMPANY EVALUATION MATRIX: STARTUPS/SMES, 2023 
               10.10.1 PROGRESSIVE COMPANIES
               10.10.2 RESPONSIVE COMPANIES
               10.10.3 DYNAMIC COMPANIES
               10.10.4 STARTING BLOCKS
               10.10.5 COMPETITIVE BENCHMARKING: STARTUPS/SMES
            10.10.5.1 Synthetic natural gas market: Startups/SMEs, 2023
               10.10.6 COMPETITIVE SCENARIO
            10.10.6.1 Product launches
            10.10.6.2 Deals
            10.10.6.3 Expansions
            10.10.6.4 Other developments
 
11 COMPANY PROFILES (Page No. - 158)
     11.1 KEY PLAYERS 
             11.1.1 BASIN ELECTRIC POWER COOPERATIVE
                       11.1.1.1 Business overview
                       11.1.1.2 Products/Solutions/Services offered
                       11.1.1.3 Recent developments
                                   11.1.1.3.1 Deals
                                   11.1.1.3.2 Expansions
                       11.1.1.4 MnM view
                                   11.1.1.4.1 Key strengths
                                   11.1.1.4.2 Strategic choices
                                   11.1.1.4.3 Weaknesses and competitive threats
             11.1.2 AIR LIQUIDE
                       11.1.2.1 Business overview
                       11.1.2.2 Products/Solutions/Services offered
                       11.1.2.3 Recent developments
                                   11.1.2.3.1 Deals
                                   11.1.2.3.2 Expansions
                                   11.1.2.3.3 Other developments
                       11.1.2.4 MnM view
                                   11.1.2.4.1 Key strengths
                                   11.1.2.4.2 Strategic choices
                                   11.1.2.4.3 Weaknesses and competitive threats
             11.1.3 ENVITEC BIOGAS AG
                       11.1.3.1 Business overview
                       11.1.3.2 Products/Solutions/Services offered
                       11.1.3.3 Recent developments
                                   11.1.3.3.1 Deals
                                   11.1.3.3.2 Expansions
                                   11.1.3.3.3 Other developments
                       11.1.3.4 MnM view
                                   11.1.3.4.1 Key strengths
                                   11.1.3.4.2 Strategic choices
                                   11.1.3.4.3 Weaknesses and competitive threats
             11.1.4 VERBIO SE
                       11.1.4.1 Business overview
                       11.1.4.2 Products/Solutions/Services offered
                       11.1.4.3 Recent developments
                                   11.1.4.3.1 Deals
                                   11.1.4.3.2 Expansions
                       11.1.4.4 MnM view
                                   11.1.4.4.1 Key strengths
                                   11.1.4.4.2 Strategic choices
                                   11.1.4.4.3 Weaknesses and competitive threats
             11.1.5 KINDER MORGAN
                       11.1.5.1 Business overview
                       11.1.5.2 Products/Solutions/Services offered
                       11.1.5.3 Recent developments
                                   11.1.5.3.1 Deals
                       11.1.5.4 MnM view
                                   11.1.5.4.1 Key strengths
                                   11.1.5.4.2 Strategic choices
                                   11.1.5.4.3 Weaknesses and competitive threats
             11.1.6 OPAL FUELS
                       11.1.6.1 Business overview
                       11.1.6.2 Products/Solutions/Services offered
                       11.1.6.3 Recent developments
                                   11.1.6.3.1 Deals
                                   11.1.6.3.2 Expansions
                                   11.1.6.3.3 Other developments
             11.1.7 TOTALENERGIES
                       11.1.7.1 Business overview
                       11.1.7.2 Products/Solutions/Services offered
                       11.1.7.3 Recent developments
                                   11.1.7.3.1 Deals
             11.1.8 E. ON SE
                       11.1.8.1 Business overview
                       11.1.8.2 Products/Solutions/Services offered
                       11.1.8.3 Recent developments
                                   11.1.8.3.1 Deals
             11.1.9 CHEVRON CORPORATION
                       11.1.9.1 Business overview
                       11.1.9.2 Products/Solutions/Services offered
                       11.1.9.3 Recent developments
                                   11.1.9.3.1 Deals
               11.1.10 WAGA ENERGY
            11.1.10.1 Business overview
            11.1.10.2 Products/Solutions/Services offered
            11.1.10.3 Recent developments
                     11.1.10.3.1 Deals
                     11.1.10.3.2 Expansions
               11.1.11 AMERESCO
            11.1.11.1 Business overview
            11.1.11.2 Products/Solutions/Services offered
            11.1.11.3 Recent developments
                     11.1.11.3.1 Deals
                     11.1.11.3.2 Expansions
               11.1.12 SHELL PLC
            11.1.12.1 Business overview
            11.1.12.2 Products/Solutions/Services offered
            11.1.12.3 Recent developments
                     11.1.12.3.1 Deals
                     11.1.12.3.2 Other developments
               11.1.13 NATURGY
            11.1.13.1 Business overview
            11.1.13.2 Products/Solutions/Services offered
            11.1.13.3 Recent developments
                     11.1.13.3.1 Deals
                     11.1.13.3.2 Expansions
               11.1.14 GEVO, INC
            11.1.14.1 Business overview
            11.1.14.2 Products/Solutions/Services offered
            11.1.14.3 Recent developments
                     11.1.14.3.1 Deals
                     11.1.14.3.2 Expansions
               11.1.15 EDL
            11.1.15.1 Business overview
            11.1.15.2 Products/Solutions/Services offered
            11.1.15.3 Recent developments
                     11.1.15.3.1 Deals
                     11.1.15.3.2 Expansions
     11.2 OTHER PLAYERS 
             11.2.1 ELECTROCHAEA GMBH
             11.2.2 FUTURE BIOGAS LIMITED
             11.2.3 PLANET BIOGAS GROUP
             11.2.4 AB HOLDING SPA
             11.2.5 KIWI AG
             11.2.6 CYCLE0
             11.2.7 ARCHAEA ENERGY INC.
             11.2.8 TURN2X
             11.2.9 MONARCH BIOENERGY
               11.2.10 UNIPER SE
 
12 APPENDIX (Page No. - 218)
     12.1 INSIGHTS FROM INDUSTRY EXPERTS 
     12.2 DISCUSSION GUIDE 
     12.3 KNOWLEDGESTORE: MARKETSANDMARKETS’ SUBSCRIPTION PORTAL 
     12.4 CUSTOMIZATION OPTIONS 
     12.5 RELATED REPORTS 
     12.6 AUTHOR DETAILS 
 
 
LIST OF TABLES (197 Tables)
 
TABLE 1 LIST OF MAJOR SECONDARY SOURCES
TABLE 2 SYNTHETIC NATURAL GAS MARKET SNAPSHOT
TABLE 3 AVERAGE SELLING PRICE TREND OF SYNTHETIC NATURAL GAS, BY REGION, 2021–2029 (USD PER MMBTU)
TABLE 4 INDICATIVE PRICE TREND OF SYNTHETIC NATURAL GAS, BY SOURCE, 2023 (USD PER MMBTU)
TABLE 5 SYNTHETIC NATURAL GAS MARKET: COMPANIES AND THEIR ROLES IN ECOSYSTEM
TABLE 6 IMPORT TARIFFS FOR HS 271121—NATURAL GAS IN GASEOUS STATE, 2022
TABLE 7 EXPORT TARIFFS FOR HS 271121—NATURAL GAS IN GASEOUS STATE, 2022
TABLE 8 SYNTHETIC NATURAL GAS MARKET: REGULATIONS
TABLE 9 ASIA PACIFIC: LIST OF REGULATORY BODIES, GOVERNMENT AGENCIES, AND OTHER ORGANIZATIONS
TABLE 10 NORTH AMERICA: LIST OF REGULATORY BODIES, GOVERNMENT AGENCIES, AND OTHER ORGANIZATIONS
TABLE 11 EUROPE: LIST OF REGULATORY BODIES, GOVERNMENT AGENCIES, AND OTHER ORGANIZATIONS
TABLE 12 ROW: LIST OF REGULATORY BODIES, GOVERNMENT AGENCIES, AND OTHER ORGANIZATIONS
TABLE 13 SYNTHETIC NATURAL GAS MARKET: INNOVATIONS AND PATENT REGISTRATIONS, 2019–2024
TABLE 14 SYNTHETIC NATURAL GAS MARKET: KEY CONFERENCES AND EVENTS, 2023–2024
TABLE 15 EXPORT DATA FOR HS CODE 271121, BY COUNTRY, 2020–2022 (USD THOUSAND)
TABLE 16 IMPORT SCENARIO FOR HS CODE 271121, BY COUNTRY, 2020–2022 (USD THOUSAND)
TABLE 17 SYNTHETIC NATURAL GAS MARKET: PORTER’S FIVE FORCES ANALYSIS
TABLE 18 INFLUENCE OF STAKEHOLDERS ON BUYING PROCESS, BY APPLICATION
TABLE 19 KEY BUYING CRITERIA, BY SOURCE
TABLE 20 SYNTHETIC NATURAL GAS MARKET, BY SOURCE, 2021–2023 (USD MILLION)
TABLE 21 SYNTHETIC NATURAL GAS MARKET, BY SOURCE, 2024–2029 (USD MILLION)
TABLE 22 COAL: SYNTHETIC NATURAL GAS MARKET, BY REGION, 2021–2023 (USD MILLION)
TABLE 23 COAL: SYNTHETIC NATURAL GAS MARKET, BY REGION, 2024–2029 (USD MILLION)
TABLE 24 BIOMASS: SYNTHETIC NATURAL GAS MARKET, BY REGION, 2021–2023 (USD MILLION)
TABLE 25 BIOMASS: SYNTHETIC NATURAL GAS MARKET, BY REGION, 2024–2029 (USD MILLION)
TABLE 26 RENEWABLE ENERGY: SYNTHETIC NATURAL GAS MARKET, BY REGION, 2021–2023 (USD MILLION)
TABLE 27 RENEWABLE ENERGY: SYNTHETIC NATURAL GAS MARKET, BY REGION, 2024–2029 (USD MILLION)
TABLE 28 SYNTHETIC NATURAL GAS MARKET, BY TECHNOLOGY, 2021–2023 (USD MILLION)
TABLE 29 SYNTHETIC NATURAL GAS MARKET, BY TECHNOLOGY, 2024–2029 (USD MILLION)
TABLE 30 ANAEROBIC DIGESTION & FERMENTATION: SYNTHETIC NATURAL GAS MARKET, BY REGION, 2021–2023 (USD MILLION)
TABLE 31 ANAEROBIC DIGESTION & FERMENTATION: SYNTHETIC NATURAL GAS MARKET, BY REGION, 2024–2029 (USD MILLION)
TABLE 32 THERMAL GASIFICATION: SYNTHETIC NATURAL GAS MARKET, BY REGION, 2021–2023 (USD MILLION)
TABLE 33 THERMAL GASIFICATION: SYNTHETIC NATURAL GAS MARKET, BY REGION, 2024–2029 (USD MILLION)
TABLE 34 POWER-TO-GAS: SYNTHETIC NATURAL GAS MARKET, BY REGION, 2021–2023 (USD MILLION)
TABLE 35 POWER-TO-GAS: SYNTHETIC NATURAL GAS MARKET, BY REGION, 2024–2029 (USD MILLION)
TABLE 36 OTHER TECHNOLOGIES: SYNTHETIC NATURAL GAS MARKET, BY REGION, 2021–2023 (USD MILLION)
TABLE 37 OTHER TECHNOLOGIES: SYNTHETIC NATURAL GAS MARKET, BY REGION, 2024–2029 (USD MILLION)
TABLE 38 SYNTHETIC NATURAL GAS MARKET, BY APPLICATION, 2021–2023 (USD MILLION)
TABLE 39 SYNTHETIC NATURAL GAS MARKET, BY APPLICATION, 2024–2029 (USD MILLION)
TABLE 40 TRANSPORTATION: SYNTHETIC NATURAL GAS MARKET, BY REGION, 2021–2023 (USD MILLION)
TABLE 41 TRANSPORTATION: SYNTHETIC NATURAL GAS MARKET, BY REGION, 2024–2029 (USD MILLION)
TABLE 42 POWER GENERATION: SYNTHETIC NATURAL GAS MARKET, BY REGION, 2021–2023 (USD MILLION)
TABLE 43 POWER GENERATION: SYNTHETIC NATURAL GAS MARKET, BY REGION, 2024–2029 (USD MILLION)
TABLE 44 INDUSTRIAL: SYNTHETIC NATURAL GAS MARKET, BY REGION, 2021–2023 (USD MILLION)
TABLE 45 INDUSTRIAL: SYNTHETIC NATURAL GAS MARKET, BY REGION, 2024–2029 (USD MILLION)
TABLE 46 GRID INJECTION: SYNTHETIC NATURAL GAS MARKET, BY REGION, 2021–2023 (USD MILLION)
TABLE 47 GRID INJECTION: SYNTHETIC NATURAL GAS MARKET, BY REGION, 2024–2029 (USD MILLION)
TABLE 48 SYNTHETIC NATURAL GAS MARKET, BY REGION, 2021–2023 (USD MILLION)
TABLE 49 SYNTHETIC NATURAL GAS MARKET, BY REGION, 2024–2029 (USD MILLION)
TABLE 50 SYNTHETIC NATURAL GAS MARKET, BY REGION, 2021–2023 (BCM)
TABLE 51 SYNTHETIC NATURAL GAS MARKET, BY REGION, 2024–2029 (BCM)
TABLE 52 NORTH AMERICA: SYNTHETIC NATURAL GAS MARKET, BY SOURCE, 2021–2023 (USD MILLION)
TABLE 53 NORTH AMERICA: SYNTHETIC NATURAL GAS MARKET, BY SOURCE, 2024–2029 (USD MILLION)
TABLE 54 NORTH AMERICA: SYNTHETIC NATURAL GAS MARKET, BY TECHNOLOGY, 2021–2023 (USD MILLION)
TABLE 55 NORTH AMERICA SYNTHETIC NATURAL GAS MARKET, BY TECHNOLOGY, 2024–2029 (USD MILLION)
TABLE 56 NORTH AMERICA: SYNTHETIC NATURAL GAS MARKET, BY APPLICATION, 2021–2023 (USD MILLION)
TABLE 57 NORTH AMERICA: SYNTHETIC NATURAL GAS MARKET, BY APPLICATION, 2024–2029 (USD MILLION)
TABLE 58 NORTH AMERICA: SYNTHETIC NATURAL GAS MARKET, BY COUNTRY, 2021–2023 (USD MILLION)
TABLE 59 NORTH AMERICA: SYNTHETIC NATURAL GAS MARKET, BY COUNTRY, 2024–2029 (USD MILLION)
TABLE 60 US: SYNTHETIC NATURAL GAS MARKET, BY APPLICATION, 2021–2023 (USD MILLION)
TABLE 61 US: SYNTHETIC NATURAL GAS MARKET, BY APPLICATION, 2024–2029 (USD MILLION)
TABLE 62 CANADA: SYNTHETIC NATURAL GAS MARKET, BY APPLICATION, 2021–2023 (USD MILLION)
TABLE 63 CANADA: SYNTHETIC NATURAL GAS MARKET, BY APPLICATION, 2024–2029 (USD MILLION)
TABLE 64 MEXICO: SYNTHETIC NATURAL GAS MARKET, BY APPLICATION, 2021–2023 (USD MILLION)
TABLE 65 MEXICO: SYNTHETIC NATURAL GAS MARKET, BY APPLICATION, 2024–2029 (USD MILLION)
TABLE 66 EUROPE: SYNTHETIC NATURAL GAS MARKET, BY SOURCE, 2021–2023 (USD MILLION)
TABLE 67 EUROPE: SYNTHETIC NATURAL GAS MARKET, BY SOURCE, 2024–2029 (USD MILLION)
TABLE 68 EUROPE: SYNTHETIC NATURAL GAS MARKET, BY TECHNOLOGY, 2021–2023 (USD MILLION)
TABLE 69 EUROPE: SYNTHETIC NATURAL GAS MARKET, BY TECHNOLOGY, 2024–2029 (USD MILLION)
TABLE 70 EUROPE: SYNTHETIC NATURAL GAS MARKET, BY APPLICATION, 2021–2023 (USD MILLION)
TABLE 71 EUROPE: SYNTHETIC NATURAL GAS MARKET, BY APPLICATION, 2024–2029 (USD MILLION)
TABLE 72 EUROPE: SYNTHETIC NATURAL GAS MARKET, BY COUNTRY, 2021–2023 (USD MILLION)
TABLE 73 EUROPE: SYNTHETIC NATURAL GAS MARKET, BY COUNTRY, 2024–2029 (USD MILLION)
TABLE 74 GERMANY: SYNTHETIC NATURAL GAS MARKET, BY APPLICATION, 2021–2023 (USD MILLION)
TABLE 75 GERMANY: SYNTHETIC NATURAL GAS MARKET, BY APPLICATION, 2024–2029 (USD MILLION)
TABLE 76 UK: SYNTHETIC NATURAL GAS MARKET, BY APPLICATION, 2021–2023 (USD MILLION)
TABLE 77 UK: SYNTHETIC NATURAL GAS MARKET, BY APPLICATION, 2024–2029 (USD MILLION)
TABLE 78 NORWAY: SYNTHETIC NATURAL GAS MARKET, BY APPLICATION, 2021–2023 (USD MILLION)
TABLE 79 NORWAY: SYNTHETIC NATURAL GAS MARKET, BY APPLICATION, 2024–2029 (USD MILLION)
TABLE 80 DENMARK: SYNTHETIC NATURAL GAS MARKET, BY APPLICATION, 2021–2023 (USD MILLION)
TABLE 81 DENMARK: SYNTHETIC NATURAL GAS MARKET, BY APPLICATION, 2024–2029 (USD MILLION)
TABLE 82 SWEDEN: SYNTHETIC NATURAL GAS MARKET, BY APPLICATION, 2021–2023 (USD MILLION)
TABLE 83 SWEDEN: SYNTHETIC NATURAL GAS MARKET, BY APPLICATION, 2024–2029 (USD MILLION)
TABLE 84 FRANCE: SYNTHETIC NATURAL GAS MARKET, BY APPLICATION, 2021–2023 (USD MILLION)
TABLE 85 FRANCE: SYNTHETIC NATURAL GAS MARKET, BY APPLICATION, 2024–2029 (USD MILLION)
TABLE 86 ITALY: SYNTHETIC NATURAL GAS MARKET, BY APPLICATION, 2021–2023 (USD MILLION)
TABLE 87 ITALY: SYNTHETIC NATURAL GAS MARKET, BY APPLICATION, 2024–2029 (USD MILLION)
TABLE 88 REST OF EUROPE: SYNTHETIC NATURAL GAS MARKET, BY APPLICATION, 2021–2023 (USD MILLION)
TABLE 89 REST OF EUROPE: SYNTHETIC NATURAL GAS MARKET, BY APPLICATION, 2024–2029 (USD MILLION)
TABLE 90 ASIA PACIFIC: SYNTHETIC NATURAL GAS MARKET, BY SOURCE, 2021–2023 (USD MILLION)
TABLE 91 ASIA PACIFIC: SYNTHETIC NATURAL GAS MARKET, BY SOURCE, 2024–2029 (USD MILLION)
TABLE 92 ASIA PACIFIC: SYNTHETIC NATURAL GAS MARKET, BY TECHNOLOGY, 2021–2023 (USD MILLION)
TABLE 93 ASIA PACIFIC SYNTHETIC NATURAL GAS MARKET, BY TECHNOLOGY, 2024–2029 (USD MILLION)
TABLE 94 ASIA PACIFIC: SYNTHETIC NATURAL GAS MARKET, BY APPLICATION, 2021–2023 (USD MILLION)
TABLE 95 ASIA PACIFIC: SYNTHETIC NATURAL GAS MARKET, BY APPLICATION, 2024–2029 (USD MILLION)
TABLE 96 ASIA PACIFIC: SYNTHETIC NATURAL GAS MARKET, BY COUNTRY, 2021–2023 (USD MILLION)
TABLE 97 ASIA PACIFIC: SYNTHETIC NATURAL GAS MARKET, BY COUNTRY, 2024–2029 (USD MILLION)
TABLE 98 CHINA: SYNTHETIC NATURAL GAS MARKET, BY APPLICATION, 2021–2023 (USD MILLION)
TABLE 99 CHINA: SYNTHETIC NATURAL GAS MARKET, BY APPLICATION, 2024–2029 (USD MILLION)
TABLE 100 INDIA: SYNTHETIC NATURAL GAS MARKET, BY APPLICATION, 2021–2023 (USD MILLION)
TABLE 101 INDIA: SYNTHETIC NATURAL GAS MARKET, BY APPLICATION, 2024–2029 (USD MILLION)
TABLE 102 REST OF ASIA PACIFIC: SYNTHETIC NATURAL GAS MARKET, BY APPLICATION, 2021–2023 (USD MILLION)
TABLE 103 REST OF ASIA PACIFIC: SYNTHETIC NATURAL GAS MARKET, BY APPLICATION, 2024–2029 (USD MILLION)
TABLE 104 ROW: SYNTHETIC NATURAL GAS MARKET, BY SOURCE, 2021–2023 (USD MILLION)
TABLE 105 ROW: SYNTHETIC NATURAL GAS MARKET, BY SOURCE, 2024–2029 (USD MILLION)
TABLE 106 ROW: SYNTHETIC NATURAL GAS MARKET, BY TECHNOLOGY, 2021–2023 (USD MILLION)
TABLE 107 ROW: SYNTHETIC NATURAL GAS MARKET, BY TECHNOLOGY, 2024–2029 (USD MILLION)
TABLE 108 ROW: SYNTHETIC NATURAL GAS MARKET, BY APPLICATION, 2021–2023 (USD MILLION)
TABLE 109 ROW: SYNTHETIC NATURAL GAS MARKET, BY APPLICATION, 2024–2029 (USD MILLION)
TABLE 110 ROW: SYNTHETIC NATURAL GAS MARKET, BY REGION, 2021–2023 (USD MILLION)
TABLE 111 ROW: SYNTHETIC NATURAL GAS MARKET, BY REGION, 2024–2029 (USD MILLION)
TABLE 112 SOUTH & CENTRAL AMERICA: SYNTHETIC NATURAL GAS MARKET, BY APPLICATION, 2021–2023 (USD MILLION)
TABLE 113 SOUTH & CENTRAL AMERICA: SYNTHETIC NATURAL GAS MARKET, BY APPLICATION, 2024–2029 (USD MILLION)
TABLE 114 MIDDLE EAST & AFRICA: SYNTHETIC NATURAL GAS MARKET, BY APPLICATION, 2021–2023 (USD MILLION)
TABLE 115 MIDDLE EAST & AFRICA: SYNTHETIC NATURAL GAS MARKET, BY APPLICATION, 2024–2029 (USD MILLION)
TABLE 116 SYNTHETIC NATURAL GAS MARKET: OVERVIEW OF STRATEGIES ADOPTED BY KEY PLAYERS, 2019–2023
TABLE 117 SYNTHETIC NATURAL GAS MARKET: DEGREE OF COMPETITION
TABLE 118 SYNTHETIC NATURAL GAS MARKET: MARKET EVALUATION FRAMEWORK, 2019–2023
TABLE 119 SYNTHETIC NATURAL GAS MARKET: REGIONAL FOOTPRINT
TABLE 120 SYNTHETIC GAS MARKET: SOURCE FOOTPRINT
TABLE 121 SYNTHETIC GAS MARKET: TECHNOLOGY FOOTPRINT
TABLE 122 SYNTHETIC GAS MARKET: APPLICATION FOOTPRINT
TABLE 123 SYNTHETIC NATURAL GAS MARKET: KEY STARTUPS/SMES
TABLE 124 SYNTHETIC NATURAL GAS MARKET: COMPETITIVE BENCHMARKING OF STARTUPS/SMES
TABLE 125 SYNTHETIC NATURAL GAS MARKET: PRODUCT LAUNCHES, DECEMBER 2019–JANUARY 2024
TABLE 126 SYNTHETIC NATURAL GAS MARKET: DEALS, DECEMBER 2019–JANUARY 2024
TABLE 127 SYNTHETIC NATURAL GAS MARKET: EXPANSIONS, DECEMBER 2019–JANUARY 2024
TABLE 128 SYNTHETIC NATURAL GAS MARKET: OTHER DEVELOPMENTS, SEPTEMBER 2019–JANUARY 2024
TABLE 129 BASIN ELECTRIC POWER COOPERATIVE: COMPANY OVERVIEW
TABLE 130 BASIN ELECTRIC POWER COOPERATIVE: PRODUCTS/SOLUTIONS/SERVICES OFFERED
TABLE 131 BASIN ELECTRIC POWER COOPERATIVE: DEALS
TABLE 132 BASIN ELECTRIC POWER COOPERATIVE: EXPANSIONS
TABLE 133 AIR LIQUIDE: COMPANY OVERVIEW
TABLE 134 AIR LIQUIDE: PRODUCTS/SOLUTIONS/SERVICES OFFERED
TABLE 135 AIR LIQUIDE: DEALS
TABLE 136 AIR LIQUIDE: EXPANSIONS
TABLE 137 AIR LIQUIDE: OTHER DEVELOPMENTS
TABLE 138 ENVITEC BIOGAS AG: COMPANY OVERVIEW
TABLE 139 ENVITEC BIOGAS AG: PRODUCTS/SOLUTIONS/SERVICES OFFERED
TABLE 140 ENVITEC BIOGAS AG: DEALS
TABLE 141 ENVITEC BIOGAS AG: EXPANSIONS
TABLE 142 ENVITEC BIOGAS AG: OTHER DEVELOPMENTS
TABLE 143 VERBIO SE: COMPANY OVERVIEW
TABLE 144 VERBIO SE: PRODUCTS/SOLUTIONS/SERVICES OFFERED
TABLE 145 VERBIO SE: DEALS
TABLE 146 VERBIO SE: EXPANSIONS
TABLE 147 KINDER MORGAN: COMPANY OVERVIEW
TABLE 148 KINDER MORGAN: PRODUCTS/SOLUTIONS/SERVICES OFFERED
TABLE 149 KINDER MORGAN: DEALS
TABLE 150 OPAL FUELS: COMPANY OVERVIEW
TABLE 151 OPAL FUELS: PRODUCTS/SOLUTIONS/SERVICES OFFERED
TABLE 152 OPAL FUELS: DEALS
TABLE 153 OPAL FUELS: EXPANSIONS
TABLE 154 OPAL FUELS: OTHER DEVELOPMENTS
TABLE 155 TOTALENERGIES: COMPANY OVERVIEW
TABLE 156 TOTALENERGIES: PRODUCTS/SOLUTIONS/SERVICES OFFERED
TABLE 157 TOTALENERGIES: DEALS
TABLE 158 E. ON SE: COMPANY OVERVIEW
TABLE 159 E. ON SE: PRODUCTS/SOLUTIONS/SERVICES OFFERED
TABLE 160 E. ON SE: DEALS
TABLE 161 CHEVRON CORPORATION: COMPANY OVERVIEW
TABLE 162 CHEVRON CORPORATION: PRODUCTS/SOLUTIONS/SERVICES OFFERED
TABLE 163 CHEVRON CORPORATION: DEALS
TABLE 164 WAGA ENERGY: COMPANY OVERVIEW
TABLE 165 WAGA ENERGY: PRODUCTS/SOLUTIONS/SERVICES OFFERED
TABLE 166 WAGA ENERGY: DEALS
TABLE 167 WAGA ENERGY: EXPANSIONS
TABLE 168 AMERESCO: COMPANY OVERVIEW
TABLE 169 AMERESCO: PRODUCTS/SOLUTIONS/SERVICES OFFERED
TABLE 170 AMERESCO: DEALS
TABLE 171 AMERESCO: EXPANSIONS
TABLE 172 SHELL PLC: COMPANY OVERVIEW
TABLE 173 SHELL PLC: PRODUCTS/SOLUTIONS/SERVICES OFFERED
TABLE 174 SHELL PLC: DEALS
TABLE 175 SHELL PLC: OTHER DEVELOPMENTS
TABLE 176 NATURGY: COMPANY OVERVIEW
TABLE 177 NATURGY: PRODUCTS/SOLUTIONS/SERVICES OFFERED
TABLE 178 NATURGY: DEALS
TABLE 179 NATURGY: EXPANSIONS
TABLE 180 GEVO, INC: COMPANY OVERVIEW
TABLE 181 GEVO, INC: PRODUCTS/SOLUTIONS/SERVICES OFFERED
TABLE 182 GEVO, INC: DEALS
TABLE 183 GEVO, INC: EXPANSIONS
TABLE 184 EDL: COMPANY OVERVIEW
TABLE 185 EDL: PRODUCTS/SOLUTIONS/SERVICES OFFERED
TABLE 186 EDL: DEALS
TABLE 187 EDL: EXPANSIONS
TABLE 188 ELECTROCHAEA GMBH: COMPANY OVERVIEW
TABLE 189 FUTURE BIOGAS LIMITED: COMPANY OVERVIEW
TABLE 190 PLANET BIOGAS GROUP: COMPANY OVERVIEW
TABLE 191 AB HOLDING SPA: COMPANY OVERVIEW
TABLE 192 KIWI AG: COMPANY OVERVIEW
TABLE 193 CYCLE0: COMPANY OVERVIEW
TABLE 194 ARCHAEA ENERGY INC.: COMPANY OVERVIEW
TABLE 195 TURN2X: COMPANY OVERVIEW
TABLE 196 MONARCH BIOENERGY: COMPANY OVERVIEW
TABLE 197 UNIPER SE: COMPANY OVERVIEW
 
  
LIST OF FIGURES (62 Figures)
 
FIGURE 1 SYNTHETIC NATURAL GAS MARKET: RESEARCH DESIGN
FIGURE 2 DATA TRIANGULATION METHODOLOGY
FIGURE 3 SYNTHETIC NATURAL GAS MARKET: BOTTOM-UP APPROACH
FIGURE 4 SYNTHETIC NATURAL GAS MARKET: TOP-DOWN APPROACH
FIGURE 5 MAIN METRICS CONSIDERED FOR ANALYZING AND ASSESSING DEMAND FOR SYNTHETIC NATURAL GAS
FIGURE 6 KEY STEPS CONSIDERED FOR ASSESSING SUPPLY OF SYNTHETIC NATURAL GAS
FIGURE 7 SYNTHETIC NATURAL GAS MARKET: SUPPLY-SIDE ANALYSIS, 2023
FIGURE 8 BIOMASS SOURCE SEGMENT TO REGISTER HIGHEST CAGR IN SYNTHETIC NATURAL GAS MARKET 2024–2029
FIGURE 9 THERMAL GASIFICATION TECHNOLOGY TO REGISTER HIGHEST CAGR
FIGURE 10 INDUSTRIAL APPLICATION TO REGISTER HIGHEST CAGR IN SYNTHETIC NATURAL GAS MARKET
FIGURE 11 EUROPE HELD LARGEST SHARE OF SYNTHETIC NATURAL GAS MARKET IN 2023
FIGURE 12 GOVERNMENT INITIATIVES FOR ACHIEVING ENERGY INDEPENDENCE TO DRIVE SYNTHETIC NATURAL GAS MARKET
FIGURE 13 BIOMASS SOURCE TO ACCOUNT FOR LARGEST MARKET SHARE IN 2029
FIGURE 14 ANAEROBIC DIGESTION & FERMENTATION TECHNOLOGY TO ACCOUNT FOR LARGEST MARKET SHARE
FIGURE 15 TRANSPORTATION TO BE LARGEST APPLICATION SEGMENT
FIGURE 16 ASIA PACIFIC SYNTHETIC NATURAL GAS MARKET TO WITNESS HIGHEST GROWTH DURING FORECAST PERIOD
FIGURE 17 SYNTHETIC NATURAL GAS MARKET: DRIVERS, RESTRAINTS, OPPORTUNITIES, AND CHALLENGES
FIGURE 18 NATURAL GAS CONSUMPTION
FIGURE 19 TRENDS/DISRUPTIONS IMPACTING CUSTOMER BUSINESS
FIGURE 20 AVERAGE SELLING PRICE TREND OF SYNTHETIC NATURAL GAS, BY REGION, 2021–2029 (USD PER MMBTU)
FIGURE 21 INDICATIVE PRICE TREND OF SYNTHETIC NATURAL GAS, BY SOURCE, 2023 (USD PER MMBTU)
FIGURE 22 SYNTHETIC NATURAL GAS MARKET: SUPPLY CHAIN ANALYSIS
FIGURE 23 SYNTHETIC NATURAL GAS: MARKET MAP
FIGURE 24 ECOSYSTEM MAP
FIGURE 25 SYNTHETIC NATURAL GAS MARKET: INNOVATIONS AND PATENT REGISTRATIONS, 2013–2023
FIGURE 26 EXPORT DATA FOR HS CODE 271121 FOR TOP FIVE COUNTRIES, 2020–2022 (USD THOUSAND)
FIGURE 27 IMPORT DATA FOR HS CODE 271121 FOR TOP FIVE COUNTRIES, 2020–2022 (USD THOUSAND)
FIGURE 28 SYNTHETIC NATURAL GAS MARKET: PORTER’S FIVE FORCES ANALYSIS
FIGURE 29 INFLUENCE OF KEY STAKEHOLDERS ON BUYING PROCESS, BY APPLICATION
FIGURE 30 KEY BUYING CRITERIA, BY SOURCE
FIGURE 31 INVESTMENT AND FUNDING SCENARIO
FIGURE 32 SYNTHETIC NATURAL GAS MARKET, BY SOURCE, 2023
FIGURE 33 SYNTHETIC NATURAL GAS MARKET, BY TECHNOLOGY, 2023
FIGURE 34 SYNTHETIC NATURAL GAS MARKET, BY APPLICATION, 2023
FIGURE 35 ASIA PACIFIC TO REGISTER HIGHEST CAGR IN SYNTHETIC NATURAL GAS MARKET DURING FORECAST PERIOD
FIGURE 36 SYNTHETIC NATURAL GAS MARKET SHARE, BY REGION, 2023
FIGURE 37 NORTH AMERICA: SYNTHETIC NATURAL GAS MARKET SNAPSHOT
FIGURE 38 EUROPE: SYNTHETIC NATURAL GAS MARKET SNAPSHOT
FIGURE 39 SYNTHETIC NATURAL GAS MARKET: MARKET SHARE ANALYSIS, 2023
FIGURE 40 SYNTHETIC NATURAL GAS MARKET: RANKING OF KEY PLAYERS, 2023
FIGURE 41 SYNTHETIC NATURAL GAS MARKET: SEGMENTAL REVENUE ANALYSIS OF FIVE KEY PLAYERS, 2019–2023
FIGURE 42 SYNTHETIC NATURAL GAS MARKET: COMPANY VALUATION
FIGURE 43 SYNTHETIC NATURAL GAS MARKET: FINANCIAL MATRIX
FIGURE 44 SYNTHETIC NATURAL GAS MARKET: BRAND COMPARISON
FIGURE 45 SYNTHETIC NATURAL GAS MARKET: COMPANY EVALUATION MATRIX: KEY PLAYERS, 2023
FIGURE 46 SYNTHETIC NATURAL GAS MARKET: PRODUCT FOOTPRINT
FIGURE 47 SYNTHETIC NATURAL GAS MARKET: MARKET FOOTPRINT
FIGURE 48 SYNTHETIC NATURAL GAS MARKET: COMPANY EVALUATION MATRIX: STARTUPS/SMES, 2023
FIGURE 49 BASIN ELECTRIC POWER COOPERATIVE: COMPANY SNAPSHOT
FIGURE 50 AIR LIQUIDE: COMPANY SNAPSHOT
FIGURE 51 ENVITEC BIOGAS AG: COMPANY SNAPSHOT
FIGURE 52 VERBIO SE: COMPANY SNAPSHOT
FIGURE 53 KINDER MORGAN: COMPANY SNAPSHOT
FIGURE 54 OPAL FUELS: COMPANY SNAPSHOT
FIGURE 55 TOTALENERGIES: COMPANY SNAPSHOT
FIGURE 56 E. ON SE: COMPANY SNAPSHOT
FIGURE 57 CHEVRON CORPORATION: COMPANY SNAPSHOT
FIGURE 58 WAGA ENERGY: COMPANY SNAPSHOT
FIGURE 59 AMERESCO: COMPANY SNAPSHOT
FIGURE 60 SHELL PLC: COMPANY SNAPSHOT
FIGURE 61 NATURGY: COMPANY SNAPSHOT
FIGURE 62 GEVO, INC: COMPANY SNAPSHOT

The study involved major activities in estimating the current size of the synthetic natural gas market. Exhaustive secondary research was done to collect information on the peer and parent markets. The next step was to validate these findings, assumptions, and sizing with industry experts across the value chain through primary research. Both top-down and bottom-up approaches were employed to estimate the total market size. Thereafter, market breakdown and data triangulation were used to estimate the market size of the segments and subsegments.

Secondary Research

This research study on the synthetic natural gas market involved the use of extensive secondary sources, directories, and databases, such as Hoover’s, Bloomberg, Factiva, IRENA, International Energy Agency, and Statista Industry Journal, to collect and identify information useful for a technical, market-oriented, and commercial study of the synthetic natural gas market. The other secondary sources included annual reports, press releases & investor presentations of companies, white papers, certified publications, articles by recognized authors, manufacturer associations, trade directories, and databases.

Primary Research

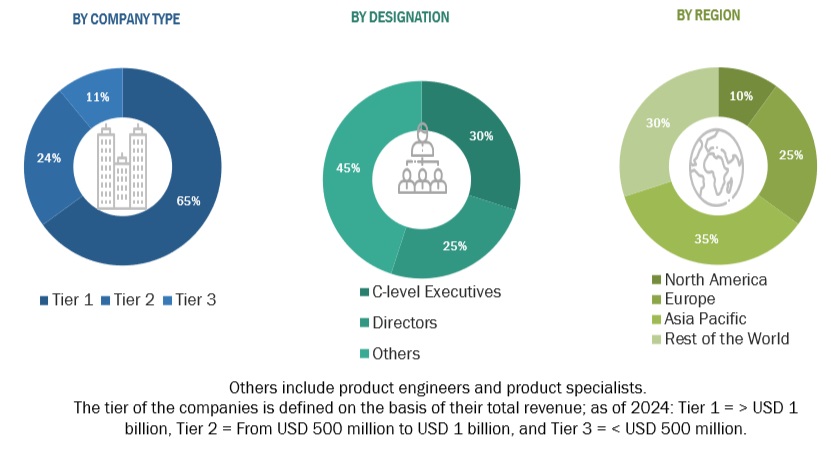
The synthetic natural gas market comprises several stakeholders, such as synthetic natural gas manufacturers, technology providers, and technical support providers in the supply chain. The demand side of this market is characterized by the rising demand for storage solutions in various applications such as energy, mobility, industrial, and transportation. The supply side is characterized by rising demand for contracts from the industrial sector and mergers & acquisitions among big players. Various primary sources from both the supply and demand sides of the market were interviewed to obtain qualitative and quantitative information. Following is the breakdown of primary respondents:
Synthetic Natural Gas Market  Market Size, and Share

To know about the assumptions considered for the study, download the pdf brochure

Market Size Estimation

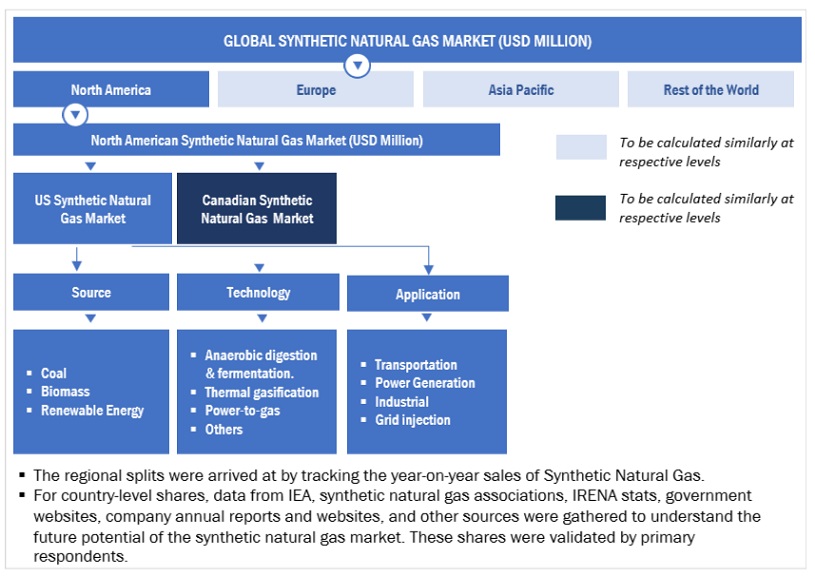
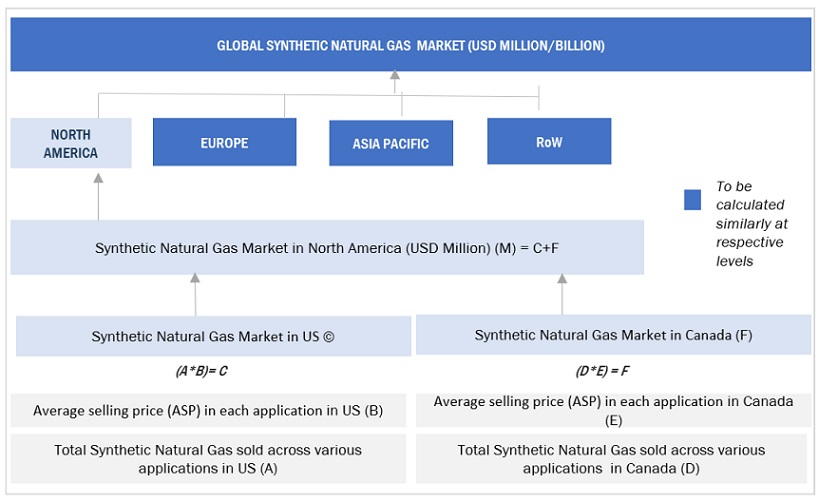
Both top-down and bottom-up approaches were used to estimate and validate the total size of the synthetic natural gas market. These methods were also used extensively to estimate the size of various subsegments in the market. The research methodology used to estimate the market size includes the following:

  • The key players in the industry and market have been identified through extensive secondary research, and their market share has been determined through primary and secondary research.
  • The industry’s value chain and market size, in terms of value, have been determined through both primary and secondary research processes.
  • All percentage shares, splits, and breakdowns have been determined using secondary sources and verified through primary sources.  

Synthetic Natural Gas Market Size: Top-Down Approach
Synthetic Natural Gas Market  Market Top Down Approach

To know about the assumptions considered for the study, Request for Free Sample Report

Synthetic Natural Gas Market Size: Bottom-Up Approach
Synthetic Natural Gas Market  Market Bottom Up Approach

Data Triangulation

After arriving at the overall market size from the above estimation process, the total market has been split into several segments and subsegments. Data triangulation and market breakdown processes have been employed to complete the overall market engineering process and arrive at the exact statistics for all the segments and sub-segments, wherever applicable. The data has been triangulated by studying various factors and trends from both the demand- and supply sides. Along with this, the market has been validated using both the top-down and bottom-up approaches.

Market Definition

Synthetic natural gas (SNG) is an artificially created substitute for natural gas, often made through a process called gasification, which transforms solid or liquid carbon-based materials into a methane-rich gas. SNG, is synthetically derived from various feedstocks including coal, biomass, and renewable energy sources, or municipal solid waste, mirrors natural gas in its properties and utility, suitable for purposes ranging from heating to power generation and transportation.

Key Stakeholders

  • Synthetic natural gas Dealers and Suppliers
  • Research institutes
  • Government and Research Organizations
  • Power and Energy Associations
  • State and National Regulatory Authorities
  • Research And Consulting Companies in the Clean Energy Generation Sector
  • Organizations, Forums, Alliances, And Associations
  • Industrial Authorities and Association

State and National Regulatory Authorities Objectives of the Study

  • To define, describe, segment, and forecast the Synthetic natural gas market size, by source, technology, and application, in terms of value.
  • To forecast the synthetic natural gas Dealers and Suppliers
  • Research institutes
  • Government and Research Organizations
  • Power and Energy Associations
  • State and National Regulatory Authorities
  • Research And Consulting Companies in the Clean Energy Generation Sector
  • Organizations, Forums, Alliances, And Associations
  • Industrial Authorities and Association
  • market size, by tank type, and application  in terms of volume.
  • To forecast the market size across four key regions: North America, Europe, Asia Pacific, and RoW, along with country-level analysis, in terms of value and volume.
  • To describe key elements required to manufacture a Synthetic natural gas.
  • To provide statistical data for installed Synthetic natural gas for each region and country.
  • To provide detailed information regarding key drivers, restraints, opportunities, and challenges influencing the market growth.
  • To provide the supply chain analysis, trends/disruptions impacting customer business, market mapping, pricing analysis, and regulatory landscape pertaining to Synthetic natural gas market.
  • To strategically analyze the ecosystem, standards and regulations, patent analysis, trade analysis, Porter’s five forces, and case studies pertaining to the market under study.
  • To strategically analyze micromarkets1 with respect to individual growth trends, prospects, contributions to the overall market size.
  • To analyze opportunities for stakeholders in the Synthetic natural gas market and draw a competitive landscape for market players.
  • To benchmark players within the market using the company evaluation matrix, which analyzes market players based on several parameters within the broad categories of business and product strategies.
  • To compare the key market players with respect to the market share, product specifications, and applications.
  • To strategically profile the key players and comprehensively analyze their market ranking and core competencies.
  • To analyze competitive developments in the Synthetic natural gas market, such as contracts, agreements, investments, expansions, product launches, partnerships, joint ventures, and collaborations.

Available Customizations:

With the given market data, MarketsandMarkets offers customizations according to the specific requirements of companies. The following customization options are available for the report:

Product Analysis

  • Product Matrix, which provides a detailed comparison of the product portfolio of each company

Company Information

  • Detailed analyses and profiling of additional market players
Custom Market Research Services

We will customize the research for you, in case the report listed above does not meet with your exact requirements. Our custom research will comprehensively cover the business information you require to help you arrive at strategic and profitable business decisions.

Request Customization
Report Code
EP 9010
Published ON
Apr, 2024
Choose License Type
BUY NOW
  • SHARE
X
Request Customization
Speak to Analyst
Speak to Analyst
OR FACE-TO-FACE MEETING
PERSONALIZE THIS RESEARCH
  • Triangulate with your Own Data
  • Get Data as per your Format and Definition
  • Gain a Deeper Dive on a Specific Application, Geography, Customer or Competitor
  • Any level of Personalization
REQUEST A FREE CUSTOMIZATION
LET US HELP YOU!
  • What are the Known and Unknown Adjacencies Impacting the Synthetic Natural Gas Market
  • What will your New Revenue Sources be?
  • Who will be your Top Customer; what will make them switch?
  • Defend your Market Share or Win Competitors
  • Get a Scorecard for Target Partners
CUSTOMIZED WORKSHOP REQUEST
  • Call Us
  • +1-888-600-6441 (Corporate office hours)
  • +1-888-600-6441 (US/Can toll free)
  • +44-800-368-9399 (UK office hours)
CONNECT WITH US
ABOUT TRUST ONLINE
©2024 MarketsandMarkets Research Private Ltd. All rights reserved
DMCA.com Protection Status Website Feedback