Synthetic Aperture Radar Market by Frequency Band (X, L, C, S, K/Ku/Ka, UHF/VHF), Component (Receiver, Transmitter, Antenna), Platform (Airborne, Ground), Application Area (Defense, Commercial), Mode (Multimode, Single mode), and Region - Global Forecast to 2022


The Synthetic Aperture Radar Market is estimated to be USD 2.42 Billion in 2017 and is projected to reach USD 4.21 Billion by 2022, and at a CAGR of 11.75% during the forecast period. The objectives of this study are to analyze the synthetic aperture radar market, along with its statistics from 2017 to 2022. The study also aims to define, describe, and forecast the market on the basis of frequency band, component, application area, mode, platform, and region. The year 2016 has been considered as the base year for this study on the synthetic aperture radar market, whereas 2017 to 2022 has been considered as the forecast period.
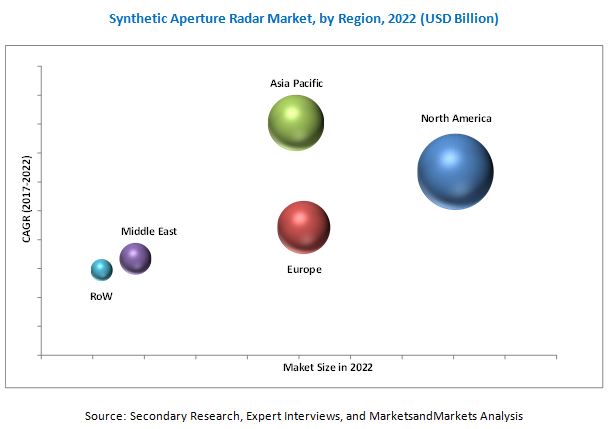
The synthetic aperture radar market is projected to grow from USD 2.42 Billion in 2017 to USD 4.21 Billion by 2022, at a CAGR of 11.75% from 2017 to 2022. The increasing deployment of space-based radars due to long-range propagation characteristics of radar signals and complex information processing capability of modern digital electronics to provide high-resolution imagery are expected to drive the market during the forecast period. The market has been segmented on the basis of frequency band, application area, component, mode, platform, and region.
Based on frequency band, the synthetic aperture radar market has been segmented into X band, L band, C band, S band, VHF/UHF, K/Ku/Ka, and others. A frequency band is an interval at which a particular radar transmits a signal. These frequency bands are distinguished based on their wavelength, which ranges from 0 GHz to 40 GHz. Radio frequency waves are sent through antennas into the space that are then reflected from the target.
Based on mode, the synthetic aperture radar market has been segmented into multimode and single mode. The multimode segment is expected to lead the market in 2017. Synthetic aperture radars using multimode are in huge demand due to their ability to capture images based on application requirement.
Based on platform, the synthetic aperture radars market has been segmented into airborne and ground. The airborne segment of the market is projected to witness the highest growth during the forecast period. Manufacturers of airborne synthetic aperture radars are taking efforts to develop specialized airborne synthetic aperture radars for Unmanned Aerial Vehicles (UAVs), as the use of airborne synthetic aperture radars in UAVs enables easy data collection of fast-changing terrains such as snow slopes and active volcanoes.
The synthetic aperture radar market has been studied for North America, Europe, Asia Pacific, Middle East, and Rest of the World (RoW). The North American region is expected to lead the market in 2017, as several leading manufacturers of synthetic aperture radars, which include Lockheed Martin Corporation (US), Northrop Grumman Corporation (US), Raytheon Company (US), etc., have their headquarters in North America.
The cost involved in the development of a synthetic aperture radar is a major factor restraining the growth of the global synthetic aperture radar market. Significant investments are required at different stages of the value chain of the synthetic aperture radar industry (especially in R&D, manufacturing, system integration, and assembly stages).
Products offered by various companies operating in the synthetic aperture radars market have been listed in the report. The recent developments section of the report provides information on strategies adopted by various companies between March 2012 and July 2017 to strengthen their position in the market. Major players in the synthetic aperture radar market include Lockheed Martin Corporation (US), Northrop Grumman Corporation (US), Raytheon Company (US), Thales Group (France), etc. These companies have excellent geographic reach and distribution channels.
To speak to our analyst for a discussion on the above findings, click Speak to Analyst
 Exclusive indicates content/data unique to MarketsandMarkets and not available with any competitors.
Table of Contents
1 Introduction (Page No. - 17)
1.1 Objectives of the Study
1.2 Market Definition
1.3 Market Scope
1.3.1 Markets Covered
1.3.2 Regional Scope
1.3.3 Years Considered for the Study
1.4 Currency & Pricing
1.5 Study Limitations
1.6 Market Stakeholders
2 Research Methodology (Page No. - 21)
2.1 Research Data
2.1.1 Secondary Data
2.1.1.1 Key Data From Secondary Sources
2.1.2 Primary Data
2.1.2.1 Key Data From Primary Sources
2.1.2.2 Breakdown of Primaries
2.2 Market Size Estimation
2.2.1 Bottom-Up Approach
2.2.2 Top-Down Approach
2.3 Market Breakdown & Data Triangulation
2.4 Research Assumptions & Limitations
3 Executive Summary (Page No. - 30)
4 Premium Insights (Page No. - 36)
4.1 Attractive Opportunities in the Synthetic Aperture Radar Market
4.2 Market, By Frequency Band
4.3 Market, By Platform
4.4 Market, By Component
4.5 Market, By Mode
5 Market Overview (Page No. - 39)
5.1 Introduction
5.2 Market Segmentation
5.2.1 By Platform
5.2.2 By Mode
5.2.3 By Frequency Band
5.2.4 By Component
5.2.5 By Application Area
5.3 Market Dynamics
5.3.1 Drivers
5.3.1.1 Growing Demand for Technologies Providing Situational Awareness
5.3.1.2 Geopolitical Instabilities in Asia Pacific and the Middle East are Fueling the Demand for Airborne and Maritime Surveillance Applications
5.3.1.3 Increasing Deployment of Space-Based Radars
5.3.2 Opportunities
5.3.2.1 Increased Development of Dual-Band Synthetic Aperture Radars
5.3.2.2 Miniaturization and Automation of Radars for UAVs and Unmanned Combat Vehicles
5.3.3 Challenges
5.3.3.1 Limited Bandwidth Allocation By Government
5.3.3.2 High Development Cost of Sar Due to Frequent Customization
6 Industry Trends (Page No. - 47)
6.1 Introduction
6.2 Technologies in the Market
6.2.1 Frequency Modulated Continuous Wave Radar
6.2.2 High-Resolution Interferometry Sar
6.2.3 Remote Sensing Technology
6.2.4 3D Radar
6.2.5 Digital Beam Forming
6.2.6 Dual Band (UHF/VHF) Sensors
6.3 Patent Listings, 2010-2016
7 Synthetic Aperture Radar Market, By Application Area (Page No. - 50)
7.1 Introduction
7.2 Defense
7.3 Commercial
7.3.1 Public Safety
7.3.2 Environmental Monitoring
7.3.3 Natural Resource Exploration
7.3.4 Others
8 By Platform (Page No. - 58)
8.1 Introduction
8.2 Airborne
8.2.1 Spacecraft
8.2.2 Aircraft
8.2.3 UAV
8.3 Ground
9 Synthetic Aperture Radar Market, By Mode (Page No. - 63)
9.1 Introduction
9.2 Single Mode
9.3 Multimode
10 By Frequency Band (Page No. - 66)
10.1 Introduction
10.2 X Band
10.3 C Band
10.4 S Band
10.5 L Band
10.6 VHF/UHF Band
10.7 K/Ku/Ka Band
10.8 Others
11 Synthetic Aperture Radar Market, By Component (Page No. - 70)
11.1 Introduction
11.2 Receiver
11.3 Transmitter
11.4 Antenna
12 Regional Analysis (Page No. - 73)
12.1 Introduction
12.2 North America
12.2.1 By Platform
12.2.1.1 Airborne Segment, By Type
12.2.2 By Application Area
12.2.2.1 Commercial Segment, By Type
12.2.3 By Country
12.2.3.1 US
12.2.3.1.1 By Platform
12.2.3.1.1.1 Airborne Segment, By Type
12.2.3.1.2 By Application Area
12.2.3.1.2.1 Commercial Segment, By Type
12.2.3.2 Canada
12.2.3.2.1 By Platform
12.2.3.2.1.1 Airborne Segment, By Type
12.2.3.2.2 By Application Area
12.2.3.2.2.1 Commercial Segment, By Type
12.3 Europe
12.3.1 By Platform
12.3.1.1 Airborne Segment, By Type
12.3.2 By Application Area
12.3.2.1 Commercial Segment, By Type
12.3.3 By Country
12.3.3.1 UK
12.3.3.1.1 By Platform
12.3.3.1.1.1 Airborne Segment, By Type
12.3.3.1.2 By Application Area
12.3.3.1.2.1 Commercial Segment, By Type
12.3.3.2 Germany
12.3.3.2.1 By Platform
12.3.3.2.1.1 Airborne Segment, By Type
12.3.3.2.2 By Application Area
12.3.3.2.2.1 Commercial Segment, By Type
12.3.3.3 France
12.3.3.3.1 By Platform
12.3.3.3.1.1 Airborne Segment, By Type
12.3.3.3.2 By Application Area
12.3.3.3.2.1 Commercial Segment, By Type
12.3.3.4 Italy
12.3.3.4.1 By Platform
12.3.3.4.1.1 Airborne Segment, By Type
12.3.3.4.2 By Application Area
12.3.3.4.2.1 Commercial Segment, By Type
12.3.3.5 Russia
12.3.3.5.1 By Platform
12.3.3.5.1.1 Airborne Segment, By Type
12.3.3.5.2 By Application Area
12.3.3.5.2.1 Commercial Segment, By Type
12.3.3.6 Rest of Europe
12.3.3.6.1 By Platform
12.3.3.6.1.1 Airborne Segment, By Type
12.3.3.6.2 By Application Area
12.3.3.6.2.1 Commercial Segment, By Type
12.4 Asia Pacific
12.4.1 By Platform
12.4.1.1 Airborne Segment, By Type
12.4.2 By Application Area
12.4.2.1 Commercial Segment, By Type
12.4.3 By Country
12.4.3.1 China
12.4.3.1.1 By Platform
12.4.3.1.1.1 Airborne Segment, By Type
12.4.3.1.2 By Application Area
12.4.3.1.2.1 Commercial Segment, By Type
12.4.3.2 India
12.4.3.2.1 By Platform
12.4.3.2.1.1 Airborne Segment, By Type
12.4.3.2.2 By Application Area
12.4.3.2.2.1 Commercial Segment, By Type
12.4.3.3 Japan
12.4.3.3.1 By Platform
12.4.3.3.1.1 Airborne Segment, By Type
12.4.3.3.2 By Application Area
12.4.3.3.2.1 Commercial Segment, By Type
12.4.3.4 Rest of Asia-Pacific
12.4.3.4.1 By Platform
12.4.3.4.1.1 Airborne Segment, By Type
12.4.3.4.2 By Application Area
12.4.3.4.2.1 Commercial Segment, By Type
12.5 Middle East
12.5.1 By Platform
12.5.1.1 Airborne Segment, By Type
12.5.2 By Application Area
12.5.2.1 Commercial Segment, By Type
12.5.3 By Country
12.5.3.1 Saudi Arabia
12.5.3.1.1 By Platform
12.5.3.1.1.1 Airborne Segment, By Type
12.5.3.1.2 By Application Area
12.5.3.1.2.1 Commercial Segment, By Type
12.5.3.2 UAE
12.5.3.2.1 By Platform
12.5.3.2.1.1 Airborne Segment, By Type
12.5.3.2.2 By Application Area
12.5.3.2.2.1 Commercial Segment, By Type
12.5.3.3 Israel
12.5.3.3.1 By Platform
12.5.3.3.1.1 Airborne Segment, By Type
12.5.3.3.2 By Application Area
12.5.3.3.2.1 Commercial Segment, By Type
12.5.3.4 Rest of Middle East
12.5.3.4.1 By Platform
12.5.3.4.1.1 Airborne Segment, By Type
12.5.3.4.2 By Application Area
12.5.3.4.2.1 Commercial Segment, By Type
12.6 Rest of the World
12.6.1 By Platform
12.6.1.1 Airborne, By Type
12.6.2 By Application Area
12.6.2.1 Commercial Segment, By Type
13 Competitive Landscape (Page No. - 124)
13.1 Market Ranking Analysis
14 Company Profiles (Page No. - 126)
(Overview, Strength of Product Portfolio, Business Strategy Excellence, Products Offering, and Recent Developments)*
14.1 Lockheed Martin Corporation
14.2 Northrop Grumman Corporation
14.3 Raytheon Company
14.4 Thales Group
14.5 Israel Aerospace Industries Ltd.
14.6 Saab AB
14.7 Harris Corporation
14.8 BAE Systems
14.9 Leonardo S.P.A.
14.10 Aselsan A.ª.
14.11 Cobham PLC
14.12 General Atomics Aeronautical Systems, Inc.
*Details on Overview, Strength of Product Portfolio, Business Strategy Excellence, Products Offering, and Recent Developments Might Not Be Captured in Case of Unlisted Companies.
15 Appendix (Page No. - 159)
15.1 Discussion Guide
15.2 Knowledge Store: Marketsandmarkets’ Subscription Portal
15.3 Introducing RT: Real-Time Market Intelligence
15.4 Available Customizations
15.5 Related Reports
15.6 Author Details
List of Tables (109 Tables)
Table 1 Synthetic Aperture Radar Market, By Mode
Table 2 Market, By Frequency Band
Table 3 Market, By Component
Table 4 Active Conflicts Across the Globe, 2008-2014
Table 5 Innovation & Patent Registrations, 2010-2016
Table 6 Market Size, By Application Area, 2015-2022 (USD Million)
Table 7 Defense: Market Size, By Region, 2015-2022 (USD Million)
Table 8 Commercial: Market Size, By Region, 2015-2022 (USD Million)
Table 9 Commercial: Market Size, By Type, 2015-2022 (USD Million)
Table 10 Public Safety: Market Size, By Region, 2015-2022 (USD Million)
Table 11 Environmental Monitoring: Market Size, By Region, 2015-2022 (USD Million)
Table 12 Natural Resource Exploration: Market Size, By Region, 2015-2022 (USD Million)
Table 13 Others: Market Size, By Region, 2015-2022 (USD Million)
Table 14 Market Size, By Platform, 2015-2022 (USD Million)
Table 15 Airborne: Market Size, By Region, 2015-2022 (USD Million)
Table 16 Airborne: Market Size, By Type, 2015-2022 (USD Million)
Table 17 Ground: Market Size, By Region, 2015-2022 (USD Million)
Table 18 Market Size, By Mode, 2015-2022 (USD Million)
Table 19 Market Size, By Frequency Band, 2015-2022 (USD Million)
Table 20 Market, By Component, 2015-2022 (USD Million)
Table 21 Market Size, By Region, 2015-2022 (USD Million)
Table 22 North America: Market Size, By Platform, 2015-2022 (USD Million)
Table 23 North America: Airborne Segment, By Type, 2015-2022 (USD Million)
Table 24 North America: Market Size, By Application Area, 2015-2022 (USD Billion)
Table 25 North America: Commercial Segment, By Type, 2015-2022 (USD Million)
Table 26 North America: Market Size, By Country, 2015-2022 (USD Million)
Table 27 US: Market Size, By Platform, 2015-2022 (USD Million)
Table 28 US: Airborne Segment, By Type, 2015-2022 (USD Million)
Table 29 US: Market Size, By Application Area, 2015-2022 (USD Million)
Table 30 US: Commercial Segment, By Type, 2015-2022 (USD Million)
Table 31 Canada: Market Size, By Platform, 2015-2022 (USD Million)
Table 32 Canada: Airborne Segment, By Type, 2015-2022 (USD Million)
Table 33 Canada: Market Size, By Application Area, 2015-2022 (USD Million)
Table 34 Canada: Commercial Segment, By Type, 2015-2022 (USD Million)
Table 35 Europe: Market Size, By Platform, 2015-2022 (USD Million)
Table 36 Europe: Airborne Segment, By Type, 2015-2022 (USD Million)
Table 37 Europe: Market Size, By Application Area, 2015-2022 (USD Billion)
Table 38 Europe: Commercial Segment, By Type, 2015-2022 (USD Million)
Table 39 Europe: Market Size, By Country, 2015-2022 (USD Million)
Table 40 UK: Market Size, By Platform, 2015-2022 (USD Million)
Table 41 UK: Airborne Segment, By Type, 2015-2022 (USD Million)
Table 42 UK: Market Size, By Application Area, 2015-2022 (USD Million)
Table 43 UK: Commercial Segment, By Type, 2015-2022 (USD Million)
Table 44 Germany: Market Size, By Platform, 2015-2022 (USD Million)
Table 45 Germany: Airborne Segment, By Type, 2015-2022 (USD Million)
Table 46 Germany: Market Size, By Application Area, 2015-2022 (USD Million)
Table 47 Germany: Commercial Segment, By Type, 2015-2022 (USD Million)
Table 48 France: Market Size, By Platform, 2015-2022 (USD Million)
Table 49 France: Airborne Segment, By Type, 2015-2022 (USD Million)
Table 50 France: Market Size, By Application Area, 2015-2022 (USD Million)
Table 51 France: Commercial Segment, By Type, 2015-2022 (USD Million)
Table 52 Italy: Market Size, By Platform, 2015-2022 (USD Million)
Table 53 Italy: Airborne Segment, By Type, 2015-2022 (USD Million)
Table 54 Italy: Market Size, By Application Area, 2015-2022 (USD Million)
Table 55 Italy: Commercial Segment, By Type, 2015-2022 (USD Million)
Table 56 Russia: Market Size, By Platform, 2015-2022 (USD Million)
Table 57 Russia: Airborne Segment, By Type, 2015-2022 (USD Million)
Table 58 Russia: Market Size, By Application Area, 2015-2022 (USD Million)
Table 59 Russia: Commercial Segment, By Type, 2015-2022 (USD Million)
Table 60 Rest of Europe: Market Size, By Platform, 2015-2022 (USD Million)
Table 61 Rest of Europe: Airborne Segment, By Type, 2015-2022 (USD Million)
Table 62 Rest of Europe: Market Size, By Platform, 2015-2022 (USD Million)
Table 63 Rest of Europe: Commercial Segment, By Type, 2015-2022 (USD Million)
Table 64 Asia Pacific: Market Size, By Platform, 2015-2022 (USD Million)
Table 65 Asia Pacific: Airborne Segment, By Type, 2015-2022 (USD Million)
Table 66 Asia Pacific: Market Size, By Application Area, 2015-2022 (USD Billion)
Table 67 Asia Pacific: Commercial Segment, By Type, 2015-2022 (USD Million)
Table 68 Asia Pacific: Market Size, By Country, 2015-2022 (USD Million)
Table 69 China: Market Size, By Platform, 2015-2022 (USD Million)
Table 70 China: Airborne Segment, By Type, 2015-2022 (USD Million)
Table 71 China: Market Size, By Application Area, 2015-2022 (USD Million)
Table 72 China: Commercial Segment, By Type, 2015-2022 (USD Million)
Table 73 India: Market Size, By Platform, 2015-2022 (USD Million)
Table 74 India: Airborne Segment, By Type, 2015-2022 (USD Million)
Table 75 India: Market Size, By Application Area, 2015-2022 (USD Million)
Table 76 India: Commercial Segment, By Type, 2015-2022 (USD Million)
Table 77 Japan: Market Size, By Platform, 2015-2022 (USD Million)
Table 78 Japan: Airborne Segment, By Type, 2015-2022 (USD Million)
Table 79 Japan: Market Size, By Application Area, 2015-2022 (USD Million)
Table 80 Japan: Commercial Segment, By Type, 2015-2022 (USD Million)
Table 81 Rest of Asia Pacific: Market Size, By Platform, 2015-2022 (USD Million)
Table 82 Rest of Asia Pacific: Airborne Segment, By Type, 2015-2022 (USD Million)
Table 83 Rest of Asia Pacific: Market Size, By Application Area, 2015-2022 (USD Million)
Table 84 Rest of Asia Pacific: Commercial Segment, By Type, 2015-2022 (USD Million)
Table 85 Middle East: Market Size, By Platform, 2015-2022 (USD Million)
Table 86 Middle East: Airborne Segment, By Type, 2015-2022 (USD Million)
Table 87 Middle East: Market Size, By Application Area, 2015-2022 (USD Billion)
Table 88 Middle East: Commercial Segment, By Type, 2015-2022 (USD Million)
Table 89 Middle East: Market Size, By Country, 2015-2022 (USD Million)
Table 90 Saudi Arabia: Market Size, By Platform, 2015-2022 (USD Million)
Table 91 Saudi Arabia: Airborne Segment, By Type, 2015-2022 (USD Million)
Table 92 Saudi Arabia: Market Size, By Platform, 2015-2022 (USD Million)
Table 93 Saudi Arabia: Commercial Segment, By Type, 2015-2022 (USD Million)
Table 94 UAE: Market Size, By Platform, 2015-2022 (USD Million)
Table 95 UAE: Airborne Segment, By Type, 2015-2022 (USD Million)
Table 96 UAE: Market Size, By Application Area, 2015-2022 (USD Million)
Table 97 UAE: Commercial Segment, By Type, 2015-2022 (USD Million)
Table 98 Israel: Market Size, By Platform, 2015-2022 (USD Million)
Table 99 Israel: Airborne Segment, By Type, 2015-2022 (USD Million)
Table 100 Israel: Market Size, By Application Area, 2015-2022 (USD Million)
Table 101 Israel: Commercial Segment, By Type, 2015-2022 (USD Million)
Table 102 Rest of Middle East: Market Size, By Platform, 2015-2022 (USD Million)
Table 103 Rest of Middle East: Airborne Segment, By Type, 2015-2022 (USD Million)
Table 104 Rest of Middle East: Market Size, By Application Area, 2015-2022 (USD Million)
Table 105 Rest of Middle East: Commercial Segment, By Type, 2015-2022 (USD Million)
Table 106 Rest of the World: Market Size, By Platform, 2015-2022 (USD Million)
Table 107 Rest of the World: Airborne Segment, By Type, 2015-2022 (USD Million)
Table 108 Rest of the World: Market Size, By Application Area, 2015-2022 (USD Billion)
Table 109 Rest of the World: Commercial Segment, By Type, 2015-2022 (USD Million)
List of Figures (43 Figures)
Figure 1 Research Process Flow
Figure 2 Synthetic Aperture Radar Market: Research Design
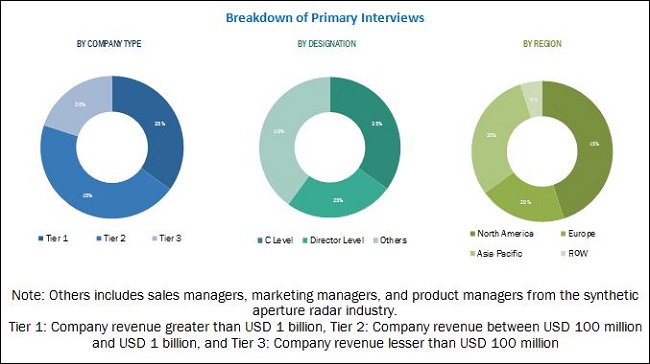
Figure 3 Breakdown of Primary Interviews: By Company Type, Designation, & Region
Figure 4 Market Size Estimation Methodology: Bottom-Up Approach
Figure 5 Market Size Estimation Methodology: Top-Down Approach
Figure 6 Data Triangulation
Figure 7 Assumptions of the Research Study
Figure 8 Based on Frequency Band, the X Band Segment is Projected to Lead the Market During the Forecast Period
Figure 9 Based on Application Area, the Defense Segment is Estimated to Account for the Largest Share of the Market in 2017
Figure 10 Based on Mode, the Multimode Segment is Projected to Lead the Market During the Forecast Period
Figure 11 The Asia Pacific Market is Projected to Grow at the Highest CAGR During the Forecast Period
Figure 12 Contracts, Agreements, & Partnerships Accounted for the Largest Share of the Total Growth Strategies Adopted By the Key Players in the Market Between March 2012 and July 2017
Figure 13 Growing Demand From Asia Pacific to Offer Unexplored Opportunities to the Manufacturers of Synthetic Aperture Radars
Figure 14 The X Band Segment is Projected to Lead the Market During the Forecast Period
Figure 15 The Airborne Segment is Expected to Be the Largest Segment of the Market During the Forecast Period
Figure 16 The Receiver Segment is Expected to Be the Largest Segment of the Market During the Forecast Period
Figure 17 The Multimode Segment is Expected to Be the Largest Segment of the Market During the Forecast Period
Figure 18 Market, By Platform
Figure 19 Market, By Application Area
Figure 20 Synthetic Aperture Radar Market Dynamics
Figure 21 Synthetic Aperture Radar Technologies
Figure 22 Based on Application Area, the Commercial Segment is Expected to Grow at the Higher CAGR During the Forecast Period
Figure 23 The Airborne Segment is Expected to Dominate the Market During the Forecast Period
Figure 24 Multimode Segment is Expected to Grow at the Highest CAGR During the Forecast Period
Figure 25 The X Band Segment is Projected to Lead the Market During the Forecast Period
Figure 26 Receiver Component Segment is Projected to Lead the Market During the Forecast Period
Figure 27 North America is Estimated to Account for the Largest Share of the Market in 2017
Figure 28 North America Market Snapshot
Figure 29 Europe Market Snapshot
Figure 30 Asia Pacific Market Snapshot
Figure 31 Middle East Market Snapshot
Figure 32 Market Ranking Analysis of Key Player
Figure 33 Lockheed Martin Corporation: Company Snapshot
Figure 34 Northrop Grumman Corporation: Company Snapshot
Figure 35 Raytheon Company: Company Snapshot
Figure 36 Thales Group: Company Snapshot
Figure 37 Israel Aerospace Industries Ltd.: Company Snapshot
Figure 38 Saab AB: Company Snapshot
Figure 39 Harris Corporation: Company Snapshot
Figure 40 BAE Systems: Company Snapshot
Figure 41 Leonardo S.P.A.: Company Snapshot
Figure 42 Aselsan A.ª.: Company Snapshot
Figure 43 Cobham PLC: Company Snapshot
The research methodology that has been used to estimate begins with bottom-up approach that has been employed to arrive at the overall size of the synthetic aperture radar market by estimating the revenue of key players and their shares in the market. Calculations based on the revenue of key players identified in the market have been used to determine the size of the market. Synthetic aperture radar offerings have also been taken into consideration to determine the market segmentation. The bottom-up procedure has been employed to arrive at the overall size of the market from the revenue of key players in the market. After arriving at the overall market size, the total market has been split into several segments and subsegments, which have then been verified through primary research by conducting extensive interviews with key experts such as Chief Executive Officers (CEOs), Vice Presidents (VPs), directors, and executives of leading companies operating in the market. Data triangulation and market breakdown procedures have been employed to complete the overall market engineering process and arrive at the exact statistics for all the segments and subsegments. The breakdown of profiles of primaries has been depicted in the figure below:
To know about the assumptions considered for the study, download the pdf brochure
The synthetic aperture radar ecosystem component providers such as Lockheed Martin Corporation (US), Northrop Grumman Corporation (US), Raytheon Company (US), Thales Group (France), BAE Systems (UK), etc., and manufacturers of synthetic aperture radars such as Harris Corporation (US), SAAB Group (Sweden), Israel Aerospace Industry (Israel), Leonardo S.p.A. (Italy), Aselsan A.S. (Turkey), Cobham Plc. (UK), etc., have been profiled in the report.
Target Audience for this Report:
- Original Equipment Manufacturers (OEMs)
- Defense Organizations
- Defense System Manufacturers
- Synthetic Aperture Radar System Component and Material Manufacturers
- Synthetic Aperture Radar Research Centers
“This study on the synthetic aperture radar market answers several questions for stakeholders, primarily which market segments to focus on in the next two to five years for prioritizing their efforts and investments.”
Scope of the Report
This research report categorizes the synthetic aperture radar market into the following segments:
-
Synthetic Aperture Radar Market, by Component
- Receiver
- Transmitter
- Antenna
-
by Platform
-
Airborne
- Spacecraft
- Aircraft
- Unmanned Aerial Vehicle (UAV)
- Ground
-
Airborne
-
by Frequency Band
- X Band
- L Band
- C Band
- S Band
- K, Ku, Ka Band
- UHF/VHF Band
- Others
-
by Application Area
- Defense
-
Commercial
- Public Safety
- Environmental Monitoring
- Natural Resource Exploration
- Others
-
by Mode
- Multimode
- Single Mode
-
by Region
- North America
- Europe
- Asia Pacific
- Middle East
- Rest of the World
Available Customizations
Along with the market data, MarketsandMarkets offers customizations as per specific needs of the companies. The following customization options are available for the report on the synthetic aperture radar market:
-
Regional Analysis
- Further breakdown of the Rest of the World synthetic aperture radar market
-
Company Information
- Detailed analysis and profiling of additional market players (up to 22 players)


Growth opportunities and latent adjacency in Synthetic Aperture Radar Market