Surgical Navigation Systems Market by Application (ENT, Orthopedic (Type (Imageless, Fluoroscopy, CT), Procedure (Knee, Hip)), Neuro, Spinal, Dental), Technology (EM, Hybrid, Optical), Patient Care Setting (Hospital, Clinic, Ambulatory)- Global Forecast to 2022


The global surgical navigation systems market size is projected to grow at a CAGR of 6.5%. Growth of this market is primarily driven by factors such as the rising adoption of minimally invasive surgical procedures; growing number of regulatory approvals, and partnerships, agreements, and collaborations among market players; increasing incidence of orthopedic and neurological disorders; and high prevalence of ENT disorders. However, the high cost of surgical navigation systems and product recalls are likely to create a negative impact on the growth of this market.
The market is categorized on the basis of technology, application, patient care setting, and region. Based on technology, the market is categorized into optical navigation systems, electromagnetic (EM) navigation systems and hybrid navigation systems. The optical navigation systems segment is poised to grow at the highest CAGR during the forecast period owing to its advantages over EM systems such as reduced radiation exposure and accuracy provided during complex surgeries, which enable surgeons to navigate properly through a patient’s anatomy. In addition to this, rise in awareness regarding the advantages of optical systems are also influencing the growth of the market.
North America is estimated to account for the largest share of the global market, followed by Europe. The dominance of the North American market is due to the high prevalence of ENT disorders, growing adoption of minimally invasive surgeries, government funding for the development of surgical navigation systems, increasing adoption by ambulatory settings, and increasing regulatory approvals.
Prominent players in this market include Medtronic plc (Ireland), Stryker Corporation (U.S.), Brainlab AG (Germany), B. Braun Melsungen AG (Germany), Scopis GmbH (Germany), Fiagon AG (Germany), Karl Storz GmbH & Co. KG (Germany), Amplitude Surgical (France), Zimmer Biomet Holdings, Inc. (U.S.), and Siemens Healthineers (Germany).
Target Audience:
- Surgical Navigation Systems Manufacturing Companies
- Medical Device Manufacturers
- Venture Capitalists
- Research and Consulting Firms
- Healthcare Providers
To know about the assumptions considered for the study, download the pdf brochure
Surgical Navigation Systems Market Report Scope
This report categorizes the Surgical Navigation Systems market into the following segments and subsegments.
By Application
- Neurosurgery navigation systems
-
Orthopedic navigation systems
-
Orthopedic navigation systems, by referencing type
- Imageless
- Fluoroscopy-based
- CT-based
-
Orthopedic navigation systems, by procedure
- Knee replacement
- Hip replacement
-
Orthopedic navigation systems, by referencing type
- ENT navigation systems
- Spinal navigation systems
- Dental navigation systems
By Technology
- Optical
- Electromagnetic (EM)
- Hybrid
By Patient Care Setting
- Hospitals
- Physician Practices & Ambulatory Settings
By Region
-
North America
- U.S.
- Canada
-
Europe
- Germany
- U.K.
- France
- Rest of the Europe (RoE)
-
Asia
- Japan
- China
- India
- Rest of Asia (RoA)
- Rest of the World (RoW)
Rest of the World (RoW) (Pacific countries, LATAM, the Middle East, and Africa)
Available Customizations
With the given market data, MarketsandMarkets offers customizations as per the company‘s specific needs.
The following customization options are available for this report.
Company Information
Detailed analysis and profiling of additional market players (up to 5)
Further Split of the Surgical Navigation Systems Market for the Rest of the World
Surgical navigation systems market size and growth rate estimates for Pacific countries, Latin America, the Middle East, and Africa
The market is mainly driven by factors such as rising adoption of minimally invasive surgical procedures; growing number of partnerships, agreements, and collaborations among market players; increasing incidence of orthopedic and neurological disorders; high prevalence of ENT disorders; and increasing number of regulatory approvals. In addition to this, growing government funding initiatives for research and development activities for surgical navigation systems are also providing an impetus for the growth of this market. However, the high cost of surgical navigation systems and product recalls are likely to create a negative impact on the growth of this market.
On the basis of application, the market is segmented into neuron avigation systems, ENT navigation systems, orthopedic navigation systems, spinal navigation systems, and dental navigation systems. ENT navigation systems are expected to grow at the highest CAGR during the forecast period. Growth in this segment can be attributed to the rise in prevalence of ENT disorders such as chronic sinusitis; new product launches and approvals; and growing partnerships, collaborations, and agreements between market players (leading to availability of technologically advanced products and stronger distribution networks).
Based on technology, surgical navigation systems are segmented into optical navigation systems, electromagnetic navigation (EM) systems, and hybrid navigation systems. Optical navigation systems are estimated grow at the highest CAGR during the forecast period. Growth in this segment can be attributed to its advantages over EM systems such as reduced radiation exposure and accuracy provided during complex surgeries, which enable surgeons to navigate properly through a patient’s anatomy. In addition to this, rise in awareness regarding the advantages of optical systems are also influencing the growth of the market.
Based on patient care settings, the market is segmented into hospitals and physician practices & ambulatory settings. In 2016, the hospitals segment is expected to account for the largest share of the market, primarily due to the greater number of patients undergoing treatments in hospitals than in clinics; implementation of government initiatives for installing surgical navigation systems in hospitals, and increasing number of hospitals in emerging Asian countries.
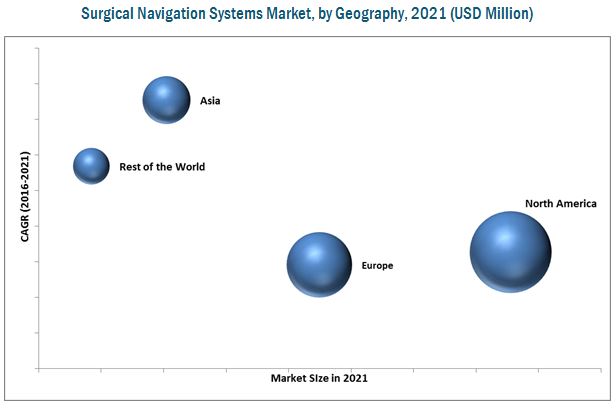
Geographically, North America is estimated to account for the largest share of the global market in 2016, followed by Europe. On the other hand, Asia is estimated to be the fastest-growing regional segment during the forecast period. Huge patient population (leading to more surgeries and invasive procedures), increasing prevalence of orthopedic disorders, improving healthcare infrastructure, partnerships/collaborations among key players, growing medical tourism, and growing elderly population (especially in Japan) are some of the key factors fuelling the growth of this market.
Key players in this market include Medtronic plc (Ireland), Stryker Corporation (U.S.), Brainlab AG (Germany), B. Braun Melsungen AG (Germany), Scopis GmbH (Germany), Fiagon AG (Germany), Karl Storz GmbH & Co. KG (Germany), Amplitude Surgical (France), Zimmer Biomet Holdings, Inc. (U.S.), and Siemens Healthineers (Germany).
Frequently Asked Questions (FAQ):
What is the size of Surgical Navigation Systems Market ?
The global Surgical Navigation Systems Market size is growing at a CAGR of 6.5%
What are the major growth factors of Surgical Navigation Systems Market ?
Growth of this market is primarily driven by factors such as the rising adoption of minimally invasive surgical procedures; growing number of regulatory approvals, and partnerships, agreements, and collaborations among market players; increasing incidence of orthopedic and neurological disorders; and high prevalence of ENT disorders. However, the high cost of surgical navigation systems and product recalls are likely to create a negative impact on the growth of this market.
Who all are the prominent players of Surgical Navigation Systems Market ?
Prominent players in this market include Medtronic plc (Ireland), Stryker Corporation (U.S.), Brainlab AG (Germany), B. Braun Melsungen AG (Germany), Scopis GmbH (Germany), Fiagon AG (Germany), Karl Storz GmbH & Co. KG (Germany), Amplitude Surgical (France), Zimmer Biomet Holdings, Inc. (U.S.), and Siemens Healthineers (Germany). .
To speak to our analyst for a discussion on the above findings, click Speak to Analyst
 Exclusive indicates content/data unique to MarketsandMarkets and not available with any competitors.
Table of Contents
1 Introduction (Page No. - 17)
1.1 Objectives of the Study
1.2 Market Definition
1.3 Study Scope
1.3.1 Markets Covered
1.3.2 Years Considered for the Study
1.4 Currency
1.5 Limitations
1.6 Stakeholders
2 Research Methodology (Page No. - 20)
2.1 Market Size Estimation
2.2 Market Breakdown and Data Triangulation
2.3 Assumptions for the Study
3 Executive Summary (Page No. - 27)
4 Premium Insights (Page No. - 31)
4.1 Market: Market Overview
4.2 Market, By Application
4.3 Market, By Technology
4.4 Market, By Patient Care Setting
4.5 Market: Geographic Snapshot
5 Market Overview (Page No. - 35)
5.1 Introduction
5.2 Market Dynamics
5.2.1 Market Drivers
5.2.1.1 Rising Adoption of Minimally Invasive Surgical Procedures
5.2.1.2 Rise in Orthopedic& Neurology Disorder Prevalence
5.2.1.3 High Prevalence of ENT Disorders
5.2.1.4 Technological Advancements and New Product Launches
5.2.1.5 Rise in Regulatory Approvals
5.2.2 Market Restraints
5.2.2.1 High Cost
5.2.2.2 Product Recalls
5.2.3 Market Opportunities
5.2.3.1 Untapped Asian Economies
5.2.3.2 Acceptance of Surgical Navigation Systems in Ambulatory Settings
5.2.4 Market Challenge
5.2.4.1 Survival of Small Players and New Entrants
6 Surgical Navigation Systems Market, By Application (Page No. - 41)
6.1 Introduction
6.1.1 Neur0navigation Systems
6.1.2 ENT Navigation Systems
6.1.3 Orthopedic Navigation Systems
6.1.3.1 Orthopedic Navigation Systems, By Referencing Type
6.1.3.1.1 Imageless Orthopedic Navigation Systems
6.1.3.1.2 Ct-Based Orthopedic Navigation Systems
6.1.3.1.3 Fluoroscopy-Based Orthopedic Navigation Systems
6.1.3.2 Orthopedic Navigation Systems Market, By Procedure
6.1.3.2.1 Knee Replacement
6.1.3.2.2 Hip Replacement
6.1.4 Spinal Navigation Systems
6.1.5 Dental Navigation Systems
7 Surgical Navigation Systems Market, By Technology (Page No. - 68)
7.1 Introduction
7.1.1 Optical Navigation Systems
7.1.2 Electromagnetic (EM) Navigation Systems
7.1.3 Hybrid Navigation Systems
8 Surgical Navigation Systems Market, By Patient Care Setting (Page No. - 77)
8.1 Introduction
8.1.1 Hospitals
8.1.2 Physician Practices & Ambulatory Settings
9 Surgical Navigation Systems Market, By Region (Page No. - 84)
9.1 Introduction
9.2 North America
9.2.1 U.S.
9.2.2 Canada
9.3 Europe
9.3.1 Germany
9.3.2 France
9.3.3 U.K.
9.3.4 Rest of Europe (RoE)
9.4 Asia
9.4.1 Japan
9.4.2 China
9.4.3 India
9.4.4 Rest of Asia (RoA)
9.5 Rest of the World (RoW)
10 Competitive Landscape (Page No. - 131)
10.1 Overview
10.2 Market Share Analysis
10.3 Competitive Situation and Trends
10.3.1 Product Launches and Approvals
10.3.2 Partnerships, Agreements, and Collaborations
10.3.3 Acquisitions
10.3.4 Expansions
11 Company Profiles (Page No. - 139)
(Introduction, Products & Services, Strategy, & Analyst Insights, Developments, MnM View)*
11.1 Introduction
11.2 Medtronic PLC
11.3 Stryker Corporation
11.4 Brainlab AG
11.5 B. Braun Melsungen AG
11.6 Scopis GmbH
11.7 Fiagon GmbH (A Subsidiary of Fiagon AG)
11.8 Karl Storz GmbH & Co. Kg
11.9 Amplitude Surgical
11.10 Zimmer Biomet Holdings, Inc.
11.11 Siemens Healthineers (A Division of Siemens AG)
*Details on Marketsandmarkets View, Introduction, Product & Services, Strategy, & Analyst Insights, New Developments Might Not Be Captured in Case of Unlisted Companies.
12 Appendix (Page No. - 160)
12.1 Insights From Industry Experts
12.2 Discussion Guide
12.3 Other Developments
12.4 Knowledge Store: Marketsandmarkets’ Subscription Portal
12.5 Introducing RT: Real-Time Market Intelligence
12.6 Available Customizations
12.7 Related Reports
12.8 Author Details
List of Tables (167 Tables)
Table 1 Recent New Product Launches (2013–2016)
Table 2 Recent New Product Launches
Table 3 Recent Approvals for Surgical Navigation Systems (2015-2016)
Table 4 Rising Adoption of Minimally Invasive Surgeries to Drive the Growth of the Market
Table 5 Product Recalls
Table 6 High Cost of Surgical Navigation Systems Restraining the Growth of Market
Table 7 Surgical Navigation Systems Market: Strategic Developments in Asia
Table 8 Untapped Asian Economies Offer Significant Growth Opportunities
Table 9 Survival of Small Players A Significant Challenge for Market Growth
Table 10 Market Size, By Application, 2014-2021 (USD Million)
Table 11 Examples of Commercially Available Neuronavigation Systems
Table 12 Neuronavigation Systems Market Size, By Region, 2014-2021 (USD Million)
Table 13 North America: Neuronavigation Systems Market Size, By Country, 2014-2021 (USD Million)
Table 14 Europe: Neuronavigation Systems Market Size, By Country, 2014-2021 (USD Million)
Table 15 Asia: Neuronavigation Systems Market Size, By Country, 2014-2021 (USD Million)
Table 16 Examples of Commercially Available ENT Navigation Systems
Table 17 ENT Navigation Systems Market Size, By Region, 2014-2021 (USD Million)
Table 18 North America: ENT Navigation Systems Market Size, By Country, 2014-2021 (USD Million)
Table 19 Europe: ENT Navigation Systems Market Size, By Country, 2014-2021 (USD Million)
Table 20 Asia: ENT Navigation Systems Market Size, By Country, 2014-2021 (USD Million)
Table 21 Examples of Commercially Available Orthopedic Navigation Systems
Table 22 Orthopedic Navigation Systems Market Size, By Region, 2014-2021 (USD Million)
Table 23 North America: Orthopedic Navigation Systems Market Size, By Country, 2014-2021 (USD Million)
Table 24 Europe: Orthopedic Navigation Systems Market Size, By Country, 2014-2021 (USD Million)
Table 25 Asia: Orthopedic Navigation Systems Market Size, By Country, 2014-2021 (USD Million)
Table 26 Orthopedic Navigation Systems Market Size, By Referencing Type, 2014-2021 (USD Million)
Table 27 Imageless Orthopedic Navigation Systems Market Size, By Region, 2014-2021 (USD Million)
Table 28 North America: Imageless Orthopedic Navigation Systems Market Size, By Country, 2014-2021 (USD Million)
Table 29 Europe: Imageless Navigation Systems Market Size, By Country, 2014-2021 (USD Million)
Table 30 Asia: Imageless Navigation Systems Market Size, By Country, 2014-2021 (USD Million)
Table 31 Ct-Based Orthopedic Navigation Systems Market Size, By Region, 2014-2021 (USD Million)
Table 32 North America: Ct-Based Orthopedic Navigation Systems Market Size, By Country, 2014-2021 (USD Million)
Table 33 Europe: Ct-Based Orthopedic Navigation Systems Market Size, By Country, 2014-2021 (USD Million)
Table 34 Asia: Ct-Based Orthopedic Navigation Systems Market Size, By Country, 2014-2021 (USD Million)
Table 35 Flu0roscopy-Based Orthopedic Navigation Systems Market Size, By Region, 2014-2021 (USD Million)
Table 36 North America: Fluoroscopy-Based Orthopedic Navigation Systems Market Size, By Country, 2014-2021 (USD Million)
Table 37 Europe: Fluoroscopy-Based Navigation Systems Market Size, By Country, 2014-2021 (USD Million)
Table 38 Asia: Fluoroscopy-Based Orthopedic Navigation Systems Market Size, By Country, 2014-2021 (USD Million)
Table 39 Orthopedic Navigation Systems Market Size, By Procedure, 2014-2021 (USD Million)
Table 40 Orthopedic Navigation Systems Market Size for Knee Replacement Procedures, By Region, 2014-2021 (USD Million)
Table 41 North America: Orthopedic Navigation Systems Market Size for Knee Replacement Procedures, By Country, 2014-2021 (USD Million)
Table 42 Europe: Orthopedic Navigation Systems Market Size for Knee Replacement Procedures, By Country, 2014-2021 (USD Million)
Table 43 Asia: Orthopedic Navigation Systems Market Size for Knee Replacement Procedures, By Country, 2014-2021 (USD Million)
Table 44 Orthopedic Navigation Systems Market Size for Hip Replacement Procedures, By Region, 2014-2021 (USD Million)
Table 45 North America: Orthopedic Navigation Systems Market Size for Hip Replacement Procedures, By Country, 2014-2021 (USD Million)
Table 46 Europe: Orthopedic Navigation Systems Market Size for Hip Replacement Procedures, By Country, 2014-2021 (USD Million)
Table 47 Asia: Orthopedic Navigation Systems Market Size for Hip Replacement Procedures, By Country, 2014-2021 (USD Million)
Table 48 Examples of Commercially Available Spinal Navigation Systems
Table 49 Spinal Navigation Systems Market Size, By Region, 2014-2021 (USD Million)
Table 50 North America: Spinal Navigation Systems Market Size, By Country, 2014-2021 (USD Million)
Table 51 Europe: Spinal Navigation Systems Market Size, By Region, 2014-2021 (USD Million)
Table 52 Asia: Spinal Navigation Systems Market Size, By Region, 2014-2021 (USD Million)
Table 53 Dental Navigation Systems: Recent Fda Approvals
Table 54 Examples of Commercially Available Dental Navigation Systems
Table 55 Dental Navigation Systems Market Size, By Region, 2014-2021 (USD Million)
Table 56 North America: Dental Navigation Systems Market Size, By Country, 2014-2021 (USD Million)
Table 57 Europe: Dental Navigation Systems Market Size, By Country, 2014-2021 (USD Million)
Table 58 Asia: Dental Navigation Systems Market Size, By Country, 2014-2021 (USD Million)
Table 59 Surgical Navigation Systems Market Size, By Technology, 2014-2021 (USD Million)
Table 60 Examples of Commercially Available Optical Navigation Systems
Table 61 Optical Navigation Systems Market Size, By Region, 2014-2021 (USD Million)
Table 62 North America: Optical Navigation Systems Market Size, By Country, 2014-2021 (USD Million)
Table 63 Europe: Optical Navigation Systems Market Size, By Country, 2014-2021 (USD Million)
Table 64 Asia: Optical Navigation Systems Market Size, By Country, 2014-2021 (USD Million)
Table 65 Examples of Commercially Available EM Navigation Systems
Table 66 Electromagnetic Navigation Systems Market Size, By Region, 2014-2021 (USD Million)
Table 67 North America: Electromagnetic Navigation Systems Market Size, By Country, 2014-2021 (USD Million)
Table 68 Europe: Electromagnetic Navigation Systems Market Size, By Country, 2014-2021 (USD Million)
Table 69 Asia: Electromagnetic Navigation Systems Market Size, By Country, 2014-2021 (USD Million)
Table 70 Hybrid Navigation Systems Market Size, By Region, 2014-2021 (USD Million)
Table 71 North America: Hybrid Navigation Systems Market Size, By Country, 2014-2021 (USD Million)
Table 72 Europe: Hybrid Navigation Systems Market Size, By Country, 2014-2021 (USD Million)
Table 73 Asia: Hybrid Navigation Systems Market Size, By Country, 2014-2021 (USD Million)
Table 74 Market Size, By Patient Care Setting, 2014-2021 (USD Million)
Table 75 Market Size for Hospitals, By Region, 2014-2021 (USD Million)
Table 76 North America: Market Size for Hospitals, By Country, 2014-2021 (USD Million)
Table 77 Europe: Market Size for Hospitals, By Country, 2014-2021 (USD Million)
Table 78 Asia: Market Size for Hospitals, By Country, 2014-2021 (USD Million)
Table 79 Market Size for Physician Practices & Ambulatory Settings, By Region, 2014-2021 (USD Million)
Table 80 North America: Market Size for Physician Practices & Ambulatory Settings, By Country, 2014-2021 (USD Million)
Table 81 Europe: Market Size for Physician Practices & Ambulatory Settings, By Country, 2014-2021 (USD Million)
Table 82 Asia: Market Size for Physician Practices & Ambulatory Settings, By Country, 2014-2021 (USD Million)
Table 83 Market Size, By Region, 2014–2021 (USD Million)
Table 84 North America: Market Size, By Country, 2014–2021 (USD Million)
Table 85 North America: Market Size, By Application, 2014–2021 (USD Million)
Table 86 North America: Orthopedic Navigation Systems Market Size, By Referencing Type, 2014–2021 (USD Million)
Table 87 North America: Orthopedic Navigation Systems Market Size, By Procedure, 2014–2021 (USD Million)
Table 88 North America: Market Size, By Technology, 2014–2021 (USD Million)
Table 89 North America: Market Size, By Patient Care Setting, 2014–2021 (USD Million)
Table 90 Funding Initiatives for Surgical Navigation Systems
Table 91 U.S.: Market Size, By Application, 2014–2021 (USD Million)
Table 92 U.S.: Orthopedic Navigation Systems Market Size, By Referencing Type, 2014–2021 (USD Million)
Table 93 U.S.: Orthopedic Navigation Systems Market Size, By Procedure, 2014–2021 (USD Million)
Table 94 U.S.: Market Size, By Technology, 2014–2021 (USD Million)
Table 95 U.S.: Market Size, By Pateint Care Setting , 2014–2021 (USD Million)
Table 96 Canada: Market Size, By Application, 2014–2021 (USD Million)
Table 97 Canada: Orthopedic Navigation Systems Market Size, By Referencing Type, 2014–2021 (USD Million)
Table 98 Canada: Orthopedic Navigation Systems Market Size, By Procedure, 2014–2021 (USD Million)
Table 99 Canada: Market Size, By Technology, 2014–2021 (USD Million)
Table 100 Canada: Market Size, By Pateint Care Setting , 2014–2021 (USD Million)
Table 101 Europe: Market Size, By Country, 2014–2021 (USD Million)
Table 102 Europe: Market Size, By Application, 2014–2021 (USD Million)
Table 103 Europe: Orthopedic Navigation Systems Market Size, By Referencing Type, 2014–2021 (USD Million)
Table 104 Europe: Orthopedic Navigation Systems Market Size, By Procedure, 2014–2021 (USD Million)
Table 105 Europe: Market Size, By Technology, 2014–2021 (USD Million)
Table 106 Europe: Market Size, By Patient Care Setting , 2014–2021 (USD Million)
Table 107 Germany: Market Size, By Application, 2014–2021 (USD Million)
Table 108 Germany: Orthopedic Navigation Systems Market Size, By Referencing Type, 2014–2021 (USD Million)
Table 109 Germany: Orthopedic Navigation Systems Market Size, By Procedure, 2014–2021 (USD Million)
Table 110 Germany: Market Size, By Technology, 2014–2021 (USD Million)
Table 111 Germany: Market Size, By Pateint Care Settings , 2014–2021 (USD Million)
Table 112 France: Market Size, By Application, 2014–2021 (USD Million)
Table 113 France: Orthopedic Navigation Systems Market Size, By Referencing Type, 2014–2021 (USD Million)
Table 114 France: Orthopedic Navigation Systems Market Size, By Procedure, 2014–2021 (USD Million)
Table 115 France: Market Size, By Technology, 2014–2021 (USD Million)
Table 116 France: Market Size, By Patient Care Setting , 2014–2021 (USD Million)
Table 117 U.K.: Market Size, By Application, 2014–2021 (USD Million)
Table 118 U.K.: Orthopedic Navigation Systems Market Size, By Referencing Type, 2014–2021 (USD Million)
Table 119 U.K.: Orthopedic Navigation Systems Market Sze, By Procedure, 2014–2021 (USD Million)
Table 120 U.K.: Surgical Navigation Systems Market Size, By Technology, 2014–2021 (USD Million)
Table 121 U.K.: Surgical Navigation Systems Market Size, By Patient Care Setting , 2014–2021 (USD Million)
Table 122 RoE: Surgical Navigation Systems Market Size, By Application, 2014–2021 (USD Million)
Table 123 RoE: Orthopedic Navigation Systems Market Size, By Referencing Type, 2014–2021 (USD Million)
Table 124 RoE: Orthopedic Navigation Systems Market Size, By Procedure, 2014–2021 (USD Million)
Table 125 RoE: Surgical Navigation Systems Market Size, By Technology, 2014–2021 (USD Million)
Table 126 RoE: Surgical Navigation Systems Market Size, By Patient Care Setting, 2014–2021 (USD Million)
Table 127 Asia: Surgical Navigation Systems Market Size, By Country, 2014-2021 (USD Million)
Table 128 Asia: Surgical Navigation Systems Market Size, By Application, 2014–2021 (USD Million)
Table 129 Asia: Orthopedic Navigation Systems Market Size, By Referencing Type, 2014–2021 (USD Million)
Table 130 Asia: Orthopedic Navigation Systems Market Size, By Procedure, 2014–2021 (USD Million)
Table 131 Asia: Surgical Navigation Systems Market Size, By Technology, 2014–2021 (USD Million)
Table 132 Asia: Surgical Navigation Systems Market Size, By Patient Care Setting , 2014–2021 (USD Million)
Table 133 Japan: Surgical Navigation Systems Market Size, By Application, 2014–2021 (USD Million)
Table 134 Japan: Orthopedic Navigation Systems Market Size, By Referencing Type, 2014–2021 (USD Million)
Table 135 Japan: Orthopedic Navigation Systems Market Size, By Procedure, 2014–2021 (USD Million)
Table 136 Japan: Surgical Navigation Systems Market Size, By Technology, 2014–2021 (USD Million)
Table 137 Japan: Surgical Navigation Systems Market Size, By Patient Care Setting, 2014–2021 (USD Million)
Table 138 China: Surgical Navigation Systems Market Size, By Application, 2014–2021 (USD Million)
Table 139 China: Orthopedic Navigation Systems Market Size, By Referencing Type, 2014–2021 (USD Million)
Table 140 China: Orthopedic Navigation Systems Market Size, By Procedure, 2014–2021 (USD Million)
Table 141 China: Surgical Navigation Systems Market Size, By Technology, 2014-2021 (USD Million)
Table 142 China: Surgical Navigation Systems Market Size, By Patient Care, 2014-2021 (USD Million)
Table 143 Medical Treatment Cost Comparison: India vs U.S. (USD)
Table 144 India: Surgical Navigation Systems Market Size, By Application, 2014–2021 (USD Million)
Table 145 India: Orthopedic Navigation Systems Market Size, By Referencing Type, 2014–2021 (USD Million)
Table 146 India: Orthopedic Navigation Systems Market Size, By Procedure, 2014–2021 (USD Million)
Table 147 India: Surgical Navigation Systems Market Size, By Technology, 2014-2021 (USD Million)
Table 148 India: Surgical Navigation Systems Market Size, By Patient Care Setting , 2014–2021 (USD Million)
Table 149 Key Medical Tourism Destinations in Asian Countries
Table 150 Cost Comparison for Medical Treatments: U.S. vs Asian Countries (USD) (2012)
Table 151 RoA: Surgical Navigation Systems Market Size, By Application, 2014-2021 (USD Million)
Table 152 RoA: Orthopedic Navigation Systems Market Size, By Referencing Type, 2014–2021 (USD Million)
Table 153 RoA: Orthopedic Navigation Systems Market Size, By Procedure, 2014–2021 (USD Million)
Table 154 RoA: Surgical Navigation Systems Market Size, By Technology, 2014–2021 (USD Million)
Table 155 RoA: Surgical Navigation Systems Market Size, By Pateint Care Setting , 2014-2021 (USD Million)
Table 156 RoW: Surgical Navigation Systems Market Size, By Application, 2014-2021 (USD Million)
Table 157 RoW: Orthopedic Navigation Systems Market Size, By Referencing Type, 2014–2021 (USD Million)
Table 158 RoW: Orthopedic Navigation Systems Market Size, By Procedure, 2014–2021 (USD Million)
Table 159 RoW: Surgical Navigation Systems Market Size, By Technology, 2014–2021 (USD Million)
Table 160 RoW: Surgical Navigation Systems Market Size, By Patient Care Setting , 2014–2021 (USD Million)
Table 161 Recent Product Launches and Approvals
Table 162 Recent Partnerships, Agreements, and Collaborations
Table 163 Recent Acquisitions
Table 164 Recent Expansions
Table 165 Exchange Rates (Utilized for Conversion of Euro to USD)
Table 166 Exchange Rate Utilized to Convert Euro to USD
Table 167 Exchange Rate (Utilized for the Conversion of Eur to USD)
List of Figures (43 Figures)
Figure 1 Surgical Navigation Systems : Market Segmentation
Figure 2 Research Design
Figure 3 Market Size Estimation : Bottom-Up Approach
Figure 4 Market Size Estimation: Top Down Approach
Figure 5 Breakdown of Primary Interviews: By Company Type, Designation, and Region
Figure 6 Data Triangulation Methodology
Figure 7 Key Data From Secondary Sources
Figure 8 Key Data Points From Primary Sources
Figure 9 Key Industry Insights
Figure 10 Global Surgical Navigation Systems Market Snapshot
Figure 11 ENT Navigation Systems are the Fastest-Growing Application Segment During the Forecast Period
Figure 12 Surgical Navigation Systems Market, By Technology: Optical Navigation Systems to Offer Significant Growth Opportunities During the Forecast Period
Figure 13 Physician Practices & Ambulatory Settings to Be the Fastest-Growing Patient Care Setting Segment During the Forecast Period
Figure 14 Surgical Navigation Systems Market, By Region: Asia is Expected to Witness the Highest Growth in the Forecast Period
Figure 15 New Product Launches and Product Approvals are Propelling Market Growth
Figure 16 Neuronavigation Systems Segment is Expected to Account for the Largest Share in 2016
Figure 17 Optical Navigation Systems to Witness the Highest Growth During the Forecast Period
Figure 18 Physician Practices & Ambulatory Settings to Witness the Highest Growth During the Forecast Period
Figure 19 China and India to Witness the Highest Growth During the Forecast Period
Figure 20 Surgical Navigation Systems: Drivers, Restraints, Opportunities, and Challenges
Figure 21 ENT Navigation Systems to Witness Highest Growth Rate During the Forecast Period
Figure 22 Imageless Navigation Systems to Command Largest Share
Figure 23 Knee Replacement to Dominate Orthopedic Navigation Systems Market, By Procedure, During the Forecast Period
Figure 24 Knee Replacement Surgeries (2013)
Figure 25 Hip Replacement Surgeries (2013)
Figure 26 Optical Navigation Systems to Dominate the Market During the Forecast Period
Figure 27 Hospitals to Command the Largest Share of the Surgical Navigation Systems Market in 2016
Figure 28 North America to Dominate the Global Surgical Navigation Systems in 2016
Figure 29 North America: Surgical Navigation Systems Market Snapshot
Figure 30 Europe: Surgical Navigation Systems Market Snapshot
Figure 31 Asia: Surgical Navigation Systems Market Snapshot
Figure 32 RoW: Surgical Navigation Systems Market Snapshot
Figure 33 Market Evolution Framework: Product Launches & Approvals Fueled Market Growth
Figure 34 Key Players Primarily Adopted Organic Growth Strategies Between 2013 and 2016
Figure 35 Surgical Navigation Systems Market Share Analysis, By Key Player (2015)
Figure 36 Battle for Market Share: Product Launches and Approvals Was the Key Growth Strategy Adopted By Market Players
Figure 37 Application Benchmarking for Top 5 Players
Figure 38 Company Snapshot: Medtronic PLC
Figure 39 Company Snapshot: Stryker Corporation
Figure 40 Company Snapshot: B. Braun Melsungen AG
Figure 41 Company Snapshot: Amplitude Surgical
Figure 42 Company Snapshot: Zimmer Biomet Holdings, Inc.
Figure 43 Company Snapshot: Siemens AG

 Generating Response ...


Growth opportunities and latent adjacency in Surgical Navigation Systems Market