Stable Isotope Labeled Compounds Market by Type (Carbon 13, D, Oxygen 18, N15), Application (Research, Clinical Diagnostics, Industrial), End User (Pharmaceutical & Biopharmaceutical Companies, Academic institute), Region � Global Forecast to 2024


The global stable isotope labeled compounds market in terms of revenue was estimated to be worth $269 million in 2019 and is poised to reach $312 million by 2024, growing at a CAGR of 3.0% from 2019 to 2024. The new research study consists of an industry trend analysis of the market. The new research study consists of industry trends, pricing analysis, patent analysis, conference and webinar materials, key stakeholders, and buying behaviour in the market. The growth of this market is driven majorly by the increase in research activities in the pharmaceutical and biotechnology sector, rising proteomics research, and the rising prevalence of cancer. However, the high cost of stable isotope-labeled compounds is expected to restrain the growth of this market during the forecast period.
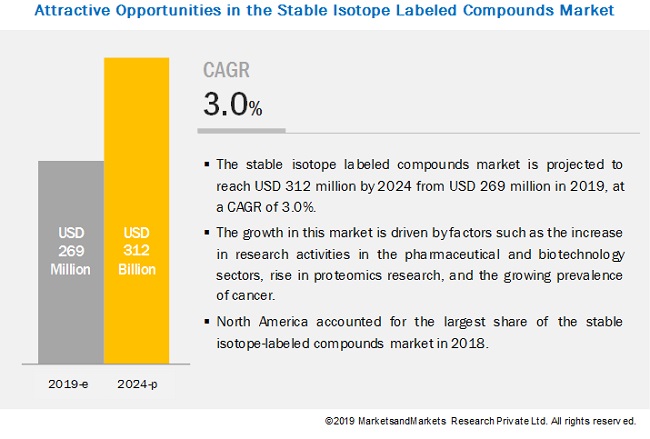
In 2018, the stable isotope labeled compounds industry demand was highest from pharmaceutical & biotechnology companies
Based on end-users, the stable isotope labeled compounds market is segmented into pharmaceutical & biotechnology companies, hospitals & diagnostic centers, academic & research institutes, and other end users. The pharmaceutical and biotechnology companies segment accounted for the larger share of the market in 2018. The growth of the pharmaceutical & biotechnology segment is attributed to the increase in R&D spending, which will drive drug research activities in the industry.
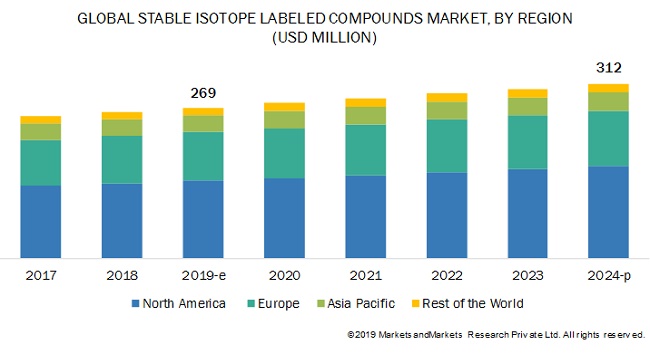
North America market of the stable isotope labeled compounds industry is expected to grow at the highest CAGR during the forecast period
North America is expected to dominate the stable isotope labeled compounds market. The major factors driving the growth of this market include the growth of the pharmaceutical and biopharmaceutical industry, the large nuclear industry in the US, the growth of the Canadian pharmaceutical industry, and the availability of funding in North American countries. North America is also expected to register the highest CAGR during the forecast period.
The prominent players in the stable isotope labeled compounds market include PerkinElmer Inc. (US), Merck KGaA (Germany), Cambridge Isotope Laboratories, Inc. (US), URENCO Limited (UK), IsoSciences, LLC (US), Medical Isotopes, Inc. (US), Omicron Biochemicals, Inc. (US), Trace Sciences International (US), Alsachim (France), Taiyo Nippon Sanso Corporation (Japan), and Rotem Industries Israel Ltd. (Israel). Major players have focused on acquisitions, product launches, agreements, and partnerships to increase their shares in the global market.
Cambridge Isotope Laboratories (CIL) is one of the leading positions in the stable isotope labeled compounds market. The company offers a comprehensive portfolio of stable isotope-labeled compounds for laboratories; medical, government, and academic research centers; and healthcare facilities. The company offers more than 15,000 products and has ISO 13485, ISO/IEC 17025, and ISO Guide 34 quality systems, along with cGMP production capabilities. Over the years, the company has extended its global footprint in four countries—the US, Canada, France, and Germany.
Scope of the Stable Isotope Labelled Compounds Industry:
|
Report Metric |
Details |
|
Market Revenue in 2019 |
$269 million |
|
Estimated Value by 2024 |
$312 million |
|
Revenue Rate |
Poised to grow at a CAGR of 3.0% |
|
Market Driver |
Increase in Research Activities in the Pharmaceutical & Biotechnology Sectors |
|
Market Opportunity |
Growing Investments in Pharmaceutical R&D in Emerging Markets |
The research report categorizes the stable isotope labeled compounds market to forecast revenue and analyze trends in each of the following submarkets:
By Type
- Deuterium
- Carbon-13
- Oxygen-18
- Nitrogen-15
- Other Stable Isotopes
By Application
- Research
- Clinical Diagnostics
- Industrial
- Other Applications
By End User
- Pharmaceutical and Biotechnology Companies
- Academic & Research Institutes
- Hospitals and Diagnostic Centers
- Other End Users
By Region
-
North America
- US
- Canada
-
Europe
- Germany
- UK
- France
- Italy
- Spain
- RoE
- Asia Pacific
- Rest of the World
Frequently Asked Questions (FAQ):
What is the projected market revenue value of the global stable isotope labeled compounds market?
The global stable isotope labeled compounds market boasts a total revenue value of $312 million by 2024.
What is the estimated growth rate (CAGR) of the global stable isotope labeled compounds market?
The global stable isotope labeled compounds market has an estimated compound annual growth rate (CAGR) of 3.0% and a revenue size in the region of $269 million in 2019.
To speak to our analyst for a discussion on the above findings, click Speak to Analyst
 Exclusive indicates content/data unique to MarketsandMarkets and not available with any competitors.
Table of Contents
1 Introduction (Page No. - 16)
1.1 Objectives of the Study
1.2 Market Definition
1.2.1 Market Scope
1.2.2 Markets Covered
1.2.3 Years Considered for the Study
1.3 Currency
1.4 Limitations
1.5 Stakeholders
2 Research Methodology (Page No. - 20)
2.1 Research Data
2.2 Secondary Data
2.2.1 Key Data From Secondary Sources
2.3 Primary Data
2.3.1 Key Data From Primary Sources
2.4 Market Size Estimation
2.4.1 Revenue Mapping-Based Market Estimation
2.5 Data Triangulation
2.5.1 Assumptions for the Study
2.5.2 Limitations
3 Executive Summary (Page No. - 29)
4 Premium Insights (Page No. - 32)
4.1 Stable Isotope-Labeled Compounds Market Overview
4.2 North America: Stable Isotope-Labeled Compounds Market, By Application (2018)
4.3 Geographical Snapshot of the Stable Isotope-Labeled Compounds Market
5 Market Overview (Page No. - 35)
5.1 Introduction
5.2 Market Dynamics
5.2.1 Drivers
5.2.1.1 Increase in Research Activities in the Pharmaceutical & Biotechnology Sectors
5.2.1.2 Growing Proteomics Research
5.2.1.3 Growing Prevalence of Cancer
5.2.2 Restraints
5.2.2.1 High Cost of Stable Isotope-Labeled Compounds
5.2.3 Opportunities
5.2.3.1 Growing Investments in Pharmaceutical R&D in Emerging Markets
5.2.4 Challenges
5.2.4.1 Dearth of Skilled Professionals
6 Stable Isotope Labeled Compounds Market, By Type (Page No. - 40)
6.1 Introduction
6.2 Hydrogen-2
6.2.1 Growing Applications of H-2 in Pharmaceutical Research Will Drive the Demand for Labeled Compounds
6.3 Carbon-13
6.3.1 Growing Number of Metabolomics Studies and Applications in Disease Diagnosis are Driving Market Growth
6.4 Oxygen-18
6.4.1 Increasing Research on Cancer is Expected to Drive the Demand for Oxygen-18-Labeled Isotopes
6.5 Nitrogen-15
6.5.1 Expanding Applications of N-15 in Agricultural Investigation and Rising Research are Likely to Drive Market Demand
6.6 Other Stable Isotopes
7 Stable Isotope Labeled Compounds Market, By Application (Page No. - 51)
7.1 Introduction
7.2 Research Applications
7.2.1 Biomedical Research
7.2.1.1 Increasing Number of Biomedical Research Activities Involving Stable Isotopes to Drive the Stable Isotope-Labeled Compounds Market for Biomedical Research
7.2.2 Pharmaceutical Research
7.2.2.1 Stable Isotopically Modified Pharmaceutical Agents Offer Reduced Side-Effects, Improved Oral Bioavailability, and Increased Half-Life—Key Factors Driving Market Growth
7.2.3 Environmental & Ecological Research
7.2.3.1 Increasing Use of Stable to Study the Feeding Ecology of Living Or Extinct Animal Species Through the Analysis of Their Ratios in Carcasses Or Remains to Drive Market Growth
7.2.4 Agricultural Research
7.2.4.1 Increasing Use of Stable Isotopes to Prevent Soil Pollution and Contamination and Facilitate Maximum Crop Production to Drive Growth in This Market
7.3 Clinical Diagnostics
7.3.1 Increasing Adoption of Pet Scans and Gamma Imaging for Disease Staging to Support Market Growth
7.4 Industrial Applications
7.4.1 Growing Application of Stable Isotopes in the Nuclear Industry and the Increasing Number of Nuclear Reactors to Support Market Growth
7.5 Other Applications
8 Stable Isotope Labeled Compounds Market, By End User (Page No. - 63)
8.1 Introduction
8.2 Pharmaceutical & Biotechnology Companies
8.2.1 Increase in R&D Activities to Drive the Demand for Stable Isotope-Labeled Compounds Among Pharma & Biotech Companies
8.3 Academic & Research Institutes
8.3.1 Growing Research on Various Treatment Therapies is Driving the Growth of This End-User Segment
8.4 Hospitals & Diagnostic Centers
8.4.1 Adoption of Stable Isotopes has Increased Owing to the Rising Prevalence of Target Diseases
8.5 Other End Users
9 Stable Isotope Labeled Compounds Market, By Region (Page No. - 73)
9.1 Introduction
9.2 North America
9.2.1 US
9.2.1.1 The US Dominates the North American Stable Isotope-Labeled Compounds Market
9.2.2 Canada
9.2.2.1 Availability of Funding Will Drive the Market in Canada
9.3 Europe
9.3.1 Germany
9.3.1.1 Germany is the Fastest-Growing Market in Europe
9.3.2 UK
9.3.2.1 Favorable Scenario for Environmental Research and Increasing Prevalence of Cancer are Key Growth Drivers in the UK
9.3.3 France
9.3.3.1 France has A Large and Well-Developed Biotech Industry
9.3.4 Italy
9.3.4.1 Strong Government Support for Research has Stimulated Market Growth in Italy
9.3.5 Spain
9.3.5.1 Increasing Research Activities and Expenditure Shows Significant Market Growth Potential in Spain
9.3.6 Rest of Europe
9.4 Asia Pacific
9.4.1 China
9.4.1.1 China Dominates the Stable Isotope-Labeled Compounds Market in the APAC
9.4.2 Japan
9.4.2.1 Growing Support and Funding have Raised Research Intensity in Japan
9.4.3 India
9.4.3.1 Government Initiatives have Strengthened the Life Science Industry in India
9.4.4 Australia
9.4.4.1 Growing Funding for Research and Collaborations have Supported Market Growth in Australia
9.4.5 Rest of Asia Pacific
9.5 Rest of the World
10 Competitive Landscape (Page No. - 110)
10.1 Overview
10.2 Market Share Analysis, 2018
10.3 Competitive Scenario
10.4 Competitive Leadership Mapping (2018)
10.4.1 Visionary Leaders
10.4.2 Innovators
10.4.3 Dynamic Differentiators
10.4.4 Emerging Companies
11 Company Profiles (Page No. - 114)
(Business Overview, Products Offered, Recent Developments, Competitive Analysis, MnM View)*
11.1 Cambridge Isotope Laboratories
11.2 Merck KGaA
11.3 URENCO Limited
11.4 Isosciences
11.5 Medical Isotopes
11.6 Omicron Biochemicals
11.7 Trace Sciences International
11.8 Alsachim
11.9 Taiyo Nippon Sanso Corporation
11.10 PerkinElmer
11.11 Rotem Industries Israel
11.12 BOC Sciences
11.13 CortecNet
11.14 ISOFLEX
11.15 Huayi Isotopes Co.
11.16 Mesbah Energy Co.
11.17 Shanghai Research Institute of Chemical Industry
11.18 13c Molecular
11.19 C/D/N Isotopes
11.20 Shoko Co.
*Business Overview, Products Offered, Recent Developments, Competitive Analysis, MnM View Might Not Be Captured in Case of Unlisted Companies.
12 Appendix (Page No. - 138)
12.1 Discussion Guide
12.2 Knowledge Store: Marketsandmarkets’ Subscription Portal
12.3 Available Customizations
12.4 Related Reports
12.5 Author Details
List of Tables (118 Tables)
Table 1 Company Drug Pipelines, 2019
Table 2 Top Investors in R&D, 2016 vs 2017
Table 3 Global Cancer Incidence, 2018 vs 2025
Table 4 Government Funding Programs for Pharmaceutical R&D in Emerging Nations
Table 5 Stable Isotope-Labeled Compounds Market, By Type, 2017–2024 (USD Million)
Table 6 Hydrogen-2-Labeled Compounds Market, By Region, 2017–2022 (USD Million)
Table 7 North America: Hydrogen-2-Labeled Compounds Market, By Country, 2017–2024 (USD Million)
Table 8 Europe: Hydrogen-2-Labeled Compounds Market, By Country, 2017–2024 (USD Million)
Table 9 APAC: Hydrogen-2-Labeled Compounds Market, By Country, 2017–2024 (USD Thousand)
Table 10 Carbon-13-Labeled Compounds Market, By Region, 2017–2024 (USD Million)
Table 11 North America: Carbon-13-Labeled Compounds Market, By Country, 2017–2024 (USD Million)
Table 12 Europe: Carbon-13-Labeled Compounds Market, By Country, 2017–2024 (USD Million)
Table 13 APAC: C Carbon-13-Labeled Compounds Market, By Country, 2017–2024 (USD Thousand)
Table 14 Oxygen-18-Labeled Compounds Market, By Region, 2017–2024 (USD Million)
Table 15 North America: Oxygen-18-Labeled Compounds Market, By Country, 2017–2024 (USD Million)
Table 16 Europe: Oxygen-18-Labeled Compounds Market, By Country, 2017–2024 (USD Million)
Table 17 APAC: Oxygen-18-Labeled Compounds Market, By Country, 2017–2024 (USD Thousand)
Table 18 Nitrogen-15-Labeled Compounds Market, By Region, 2017–2022 (USD Million)
Table 19 North America: Nitrogen-15-Labeled Compounds Market, By Country, 2017–2024 (USD Million)
Table 20 Europe: Nitrogen-15-Labeled Compounds Market, By Country, 2017–2024 (USD Million)
Table 21 APAC: Nitrogen-15-Labeled Compounds Market, By Country, 2017–2024 (USD Thousand)
Table 22 Other Stable Isotopes Market, By Region, 2017–2022 (USD Thousand)
Table 23 North America: Other Stable Isotopes Market, By Country, 2017–2024 (USD Thousand)
Table 24 Europe: Other Stable Isotopes Market, By Country, 2017–2024 (USD Thousand)
Table 25 APAC: Other Stable Isotopes Market, By Country, 2017–2024 (USD Thousand)
Table 26 Stable Isotope-Labeled Compounds Market, By Application, 2017–2024 (USD Million)
Table 27 Stable Isotope-Labeled Compounds Market for Research Applications, By Region, 2017–2024 (USD Million)
Table 28 North America: Stable Isotope-Labeled Compounds Market for Research Applications, By Country, 2017–2024 (USD Million)
Table 29 Europe: Stable Isotope-Labeled Compounds Market for Research Applications, By Country, 2017–2024 (USD Million)
Table 30 APAC: Stable Isotope-Labeled Compounds Market for Research Applications, By Country, 2017–2024 (USD Million)
Table 31 Stable Isotope-Labeled Compounds Market for Clinical Diagnostics, By Region, 2017–2024 (USD Million)
Table 32 North America: Stable Isotope-Labeled Compounds Market for Clinical Diagnostics, By Country, 2017–2024 (USD Million)
Table 33 Europe: Stable Isotope-Labeled Compounds Market for Clinical Diagnostics, By Country, 2017–2024 (USD Million)
Table 34 APAC: Stable Isotope-Labeled Compounds Market for Clinical Diagnostics, By Country, 2017–2024 (USD Thousand)
Table 35 Stable Isotope-Labeled Compounds Market for Industrial Applications, By Region, 2017–2024 (USD Million)
Table 36 North America: Stable Isotope-Labeled Compounds Market for Industrial Applications, By Country, 2017–2024 (USD Million)
Table 37 Europe: Stable Isotope-Labeled Compounds Market for Industrial Applications, By Country, 2017–2024 (USD Thousand)
Table 38 APAC: Stable Isotope-Labeled Compounds Market for Industrial Applications, By Country, 2017–2024 (USD Thousand)
Table 39 Stable Isotope-Labeled Compounds Market for Other Applications, By Region, 2017–2024 (USD Million)
Table 40 North America: Stable Isotope-Labeled Compounds Market for Other Applications, By Country, 2017–2024 (USD Thousand)
Table 41 Europe: Stable Isotope-Labeled Compounds Market for Other Applications, By Country, 2017–2024 (USD Thousand)
Table 42 APAC: Stable Isotope-Labeled Compounds Market for Other Applications, By Country, 2017–2024 (USD Thousand)
Table 43 Stable Isotope-Labeled Compounds Market, By End User, 2017–2024 (USD Million)
Table 44 Stable Isotope-Labeled Compounds Market for Pharmaceutical & Biotechnology Companies, By Region, 2017–2024 (USD Million)
Table 45 North America: Stable Isotope-Labeled Compounds Market for Pharmaceutical & Biotechnology Companies, By Country, 2017–2024 (USD Million)
Table 46 Europe: Stable Isotope-Labeled Compounds Market for Pharmaceutical & Biotechnology Companies, By Country, 2017–2024 (USD Million)
Table 47 APAC: Stable Isotope-Labeled Compounds Market for Pharmaceutical & Biotechnology Companies, By Country, 2017–2024 (USD Thousand)
Table 48 Stable Isotope-Labeled Compounds Market for Academic & Research Institutes, By Region, 2017–2024 (USD Million)
Table 49 North America: Stable Isotope-Labeled Compounds Market for Academic & Research Institutes, By Country, 2017–2024 (USD Million)
Table 50 Europe: Stable Isotope-Labeled Compounds Market for Academic & Research Institutes, By Country, 2017–2024 (USD Million)
Table 51 APAC: Stable Isotope-Labeled Compounds Market for Academic & Research Institutes, By Country, 2017–2024 (USD Thousand)
Table 52 Stable Isotope-Labeled Compounds Market for Hospitals & Diagnostic Centers, By Region, 2015–2022 (USD Million)
Table 53 North America: Stable Isotope-Labeled Compounds Market for Hospitals & Diagnostic Centers, By Country, 2017–2024 (USD Thousand)
Table 54 Europe: Stable Isotope-Labeled Compounds Market for Hospitals & Diagnostic Centers, By Country, 2017–2024 (USD Thousand)
Table 55 APAC: Stable Isotope-Labeled Compounds Market for Hospitals & Diagnostic Centers, By Country, 2017–2024 (USD Thousand)
Table 56 Stable Isotope-Labeled Compounds Market for Other End Users, By Region, 2015–2022 (USD Million)
Table 57 North America: Stable Isotope-Labeled Compounds Market for Other End Users, By Country, 2017–2024 (USD Thousand)
Table 58 Europe: Stable Isotope-Labeled Compounds Market for Other End Users, By Country, 2017–2024 (USD Thousand)
Table 59 APAC: Stable Isotope-Labeled Compounds Market for Other End Users, By Country, 2017–2024 (USD Thousand)
Table 60 Stable Isotope-Labeled Compounds Market, By Region, 2017–2024 (USD Million)
Table 61 North America: Stable Isotope-Labeled Compounds Market, By Country, 2017–2024 (USD Million)
Table 62 North America: Stable Isotope-Labeled Compounds Market, By Type, 2017–2024 (USD Million)
Table 63 North America: Stable Isotope-Labeled Compounds Market, By Application, 2017–2024 (USD Million)
Table 64 North America: Stable Isotope-Labeled Compounds Market, By End User, 2017–2024 (USD Million)
Table 65 US: Stable Isotope-Labeled Compounds Market, By Type, 2017–2024 (USD Million)
Table 66 US: Stable Isotope-Labeled Compounds Market, By Application, 2017–2024 (USD Million)
Table 67 US: Stable Isotope-Labeled Compounds Market, By End User, 2017–2024 (USD Million)
Table 68 Canada: Stable Isotope-Labeled Compounds Market, By Type, 2017–2024 (USD Thousand)
Table 69 Canada: Stable Isotope-Labeled Compounds Market, By Application, 2017–2024 (USD Thousand)
Table 70 Canada: Stable Isotope-Labeled Compounds Market, By End User, 2017–2024 (USD Thousand)
Table 71 Europe: Stable Isotope-Labeled Compounds Market, By Country, 2017–2024 (USD Million)
Table 72 Europe: Stable Isotope-Labeled Compounds Market, By Type, 2017–2024 (USD Million)
Table 73 Europe: Stable Isotope-Labeled Compounds Market, By Application, 2017–2024 (USD Million)
Table 74 Europe: Stable Isotope-Labeled Compounds Market, By End User, 2017–2024 (USD Million)
Table 75 Germany: Stable Isotope-Labeled Compounds Market, By Type, 2017–2024 (USD Million)
Table 76 Germany: Stable Isotope-Labeled Compounds Market, By Application, 2017–2024 (USD Million)
Table 77 Germany: Stable Isotope-Labeled Compounds Market, By End User, 2017–2024 (USD Million)
Table 78 UK: Stable Isotope-Labeled Compounds Market, By Type, 2017–2024 (USD Million)
Table 79 UK: Stable Isotope-Labeled Compounds Market, By Application, 2017–2024 (USD Million)
Table 80 UK: Stable Isotope-Labeled Compounds Market, By End User, 2017–2024 (USD Million)
Table 81 France: Stable Isotope-Labeled Compounds Market, By Type, 2017–2024 (USD Thousand)
Table 82 France: Stable Isotope-Labeled Compounds Market, By Application, 2017–2024 (USD Thousand)
Table 83 France: Stable Isotope-Labeled Compounds Market, By End User, 2015–2022 (USD Thousand)
Table 84 Italy: Stable Isotope-Labeled Compounds Market, By Type, 2017–2024 (USD Thousand)
Table 85 Italy: Stable Isotope-Labeled Compounds Market, By Application, 2017–2024 (USD Thousand)
Table 86 Italy: Stable Isotope-Labeled Compounds Market, By End User, 2017–2024 (USD Thousand)
Table 87 Spain: Stable Isotope-Labeled Compounds Market, By Type, 2017–2024 (USD Thousand)
Table 88 Spain: Stable Isotope-Labeled Compounds Market, By Application, 2017–2024 (USD Thousand)
Table 89 Spain: Stable Isotope-Labeled Compounds Market, By End User, 2017–2024 (USD Thousand)
Table 90 Pharmaceutical R&D Expenditure in RoE Countries (2016)
Table 91 RoE: Stable Isotope-Labeled Compounds Market, By Type, 2017–2024 (USD Thousand)
Table 92 RoE: Stable Isotope-Labeled Compounds Market, By Application, 2017–2024 (USD Thousand)
Table 93 RoE: Stable Isotope-Labeled Compounds Market, By End User, 2017–2024 (USD Thousand)
Table 94 Number of Nuclear Reactors in the Asia Pacific (August 2019)
Table 95 Asia Pacific: Stable Isotope-Labeled Compounds Market, By Country, 2017–2024 (USD Million)
Table 96 Asia Pacific: Stable Isotope-Labeled Compounds Market, By Type, 2017–2024 (USD Million)
Table 97 Asia Pacific: Stable Isotope-Labeled Compounds Market, By Application, 2017–2024 (USD Million)
Table 98 Asia Pacific: Stable Isotope-Labeled Compounds Market, By End User, 2015–2022 (USD Million)
Table 99 China: Stable Isotope-Labeled Compounds Market, By Type, 2017–2024 (USD Million)
Table 100 China: Stable Isotope-Labeled Compounds Market, By Application, 2017–2024 (USD Million)
Table 101 China: Stable Isotope-Labeled Compounds Market, By End User, 2017–2024 (USD Million)
Table 102 Japan: Stable Isotope-Labeled Compounds Market, By Type, 2017–2024 (USD Thousand)
Table 103 Japan: Stable Isotope-Labeled Compounds Market, By Application, 2015–2022 (USD Thousand)
Table 104 Japan: Stable Isotope-Labeled Compounds Market, By End User, 2017–2024 (USD Thousand)
Table 105 India: Stable Isotope-Labeled Compounds Market, By Type, 2017–2024 (USD Thousand)
Table 106 India: Stable Isotope-Labeled Compounds Market, By Application, 2017–2024 (USD Thousand)
Table 107 India: Stable Isotope-Labeled Compounds Market, By End User, 2017–2024 (USD Thousand)
Table 108 Australia: Stable Isotope-Labeled Compounds Market, By Type, 2017–2024 (USD Thousand)
Table 109 Australia: Stable Isotope-Labeled Compounds Market, By Application, 2017–2024 (USD Thousand)
Table 110 Australia: Stable Isotope-Labeled Compounds Market, By End User, 2017–2024 (USD Thousand)
Table 111 RoAPAC: Stable Isotope-Labeled Compounds Market, By Type, 2017–2024 (USD Thousand)
Table 112 RoAPAC: Stable Isotope-Labeled Compounds Market, By Application, 2017–2024 (USD Thousand)
Table 113 RoAPAC: Stable Isotope-Labeled Compounds Market, By End User, 2017–2024 (USD Thousand)
Table 114 RoW: Stable Isotope-Labeled Compounds Market, By Type, 2017–2024 (USD Thousand)
Table 115 RoW: Stable Isotope-Labeled Compounds Market, By Application, 2017–2024 (USD Thousand)
Table 116 RoW: Stable Isotope-Labeled Compounds Market, By End User, 2017–2024 (USD Thousand)
Table 117 Agreements (2016–2019)
Table 118 Product Launches (2016-2019)
List of Figures (21 Figures)
Figure 1 Research Design
Figure 2 Breakdown of Primary Interviews: By Company Type, Designation, and Region
Figure 3 Research Methodology: Hypothesis Building
Figure 4 Market Size Estimation: Stable Isotope Labeled Compounds Market
Figure 5 Market Data Triangulation Methodology
Figure 6 Stable Isotope-Labeled Compounds Market, By Type, 2019 vs 2024 (USD Million)
Figure 7 Stable Isotope-Labeled Compounds Market, By Application, 2019 vs 2024 (USD Million)
Figure 8 Stable Isotope-Labeled Compounds Market, By End User, 2019 vs 2024 (USD Million)
Figure 9 Geographic Snapshot of the Stable Isotope-Labeled Compounds Market
Figure 10 Increase in Research in the Pharmaceutical & Biotechnology Sectors Will Drive Market Growth
Figure 11 Research Applications Accounted for the Largest Share of the North American Market in 2018
Figure 12 North America to Register the Highest Growth During the Forecast Period
Figure 13 Stable Isotope Labeled Compounds Market: Drivers, Restraints, Opportunities, and Challenges
Figure 14 North America: Stable Isotope-Labeled Compounds Market Snapshot
Figure 15 Asia Pacific: Stable Isotope-Labeled Compounds Market Snapshot
Figure 16 Market Ranking of Key Players, 2018
Figure 17 Competitive Leadership Mapping: Stable Isotope-Labeled Compounds Market
Figure 18 Merck KGaA: Company Snapshot
Figure 19 URENCO Limited: Company Snapshot (2018)
Figure 20 Taiyo Nippon Sanso Corporation: Company Snapshot (2018)
Figure 21 PerkinElmer: Company Snapshot (2018)
The stable isotope labeled compounds market study involved the extensive use of both primary and secondary sources. The research process involved the study of various factors affecting the industry to identify the segmentation types, industry trends, key players, competitive landscape, key market dynamics, and key player strategies.
Secondary Research
The secondary research process involves the widespread use of secondary sources, directories, databases (such as Bloomberg Businessweek, Factiva, and D&B Hoovers), white papers, annual reports, companies house documents, investor presentations, and SEC filings of companies. Secondary research was used to identify and collect information useful for the extensive, technical, market-oriented, and commercial study of the stable isotope labeled compounds market. It was also used to obtain important information about the key players and market classification & segmentation according to industry trends to the bottom-most level, and key developments related to market and technology perspectives. A database of the key industry leaders was also prepared using secondary research.
Primary Research
In the primary research process, various sources from both the supply and demand sides were interviewed to obtain qualitative and quantitative information for this report. The primary sources from the supply side include industry experts such as CEOs, vice presidents, marketing and sales directors, technology & innovation directors, and related key executives from various key companies and organizations operating in the stable isotope labeled compounds market. The primary sources from the demand side included industry experts, such as researchers & scientists and industry experts from medical device companies. Primary research was conducted to validate the market segmentation, identify key players in the market, and gather insights on key industry trends & key market dynamics.
A breakdown of the primary respondents is provided below:
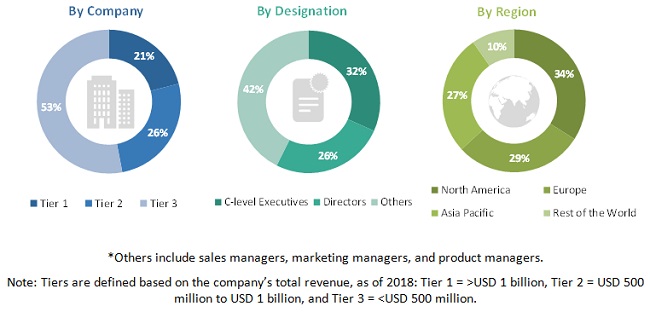
To know about the assumptions considered for the study, download the pdf brochure
Market Size Estimation
The stable isotope labeled compounds market size estimates and forecasts provided in this study are derived through a mix of the bottom-up approach (segmental analysis of major segments) and top-down approach (assessment of utilization/adoption/penetration trends, by technology, component, end user, and region).
Data Triangulation
After arriving at the market size, the stable isotope labeled compounds market was divided into several segments and subsegments. Data triangulation and market breakdown procedures were employed, wherever applicable, to complete the overall market engineering process and arrive at the exact statistics for all segments & subsegments.
Objectives of the Study
- To define, describe, segment, and forecast the global stable isotope labeled compounds market by type, application, end user, and region
- To provide detailed information about the factors influencing the market growth (such as drivers, restraints, opportunities, and challenges)
- To analyze micromarkets with respect to individual growth trends, prospects, and contributions to the overall market
- To analyze market opportunities for stakeholders and provide details of the competitive landscape for key players
- To forecast the size of the stable isotopes labeled compounds market in five main regions, namely, North America, Europe, the Asia Pacific, and Rest of the World
- To profile key players in the global stable isotope labeled compounds market and comprehensively analyze their core competencies and market shares
- To track and analyze competitive developments such as product/service launches, partnerships, and collaborations in the stable isotope labeled compounds market
Available Customizations
With the given market data, MarketsandMarkets offers customizations as per the company’s specific needs. The following customization options are available for the report:
Company Information
- Detailed analysis and profiling of additional market players (Up to 3)

 Generating Response ...


Growth opportunities and latent adjacency in Stable Isotope Labeled Compounds Market