Solar Simulator Market by Dimension (Class AAA, Class ABA, and Class ABB), Light Source (Xenon arc lamp, Metal halide arc lamp, UV lamp), Application (PV cell/module and materials testing, UV testing of materials & products) - Global Forecast to 2022


The global solar simulator market is expected to be valued at USD 8.44 billion by 2022, growing at a CAGR of 6.5% between 2017 and 2022. The years considered for the study are as follows:
- Base year: 2016
- Projected year: 2022
- Forecast period: 2017–2022
The following are the major objectives of the study.
- To define, describe, and forecast the solar simulator market on the basis of dimension, light source, application, and geography
- To provide detailed information regarding the major factors influencing the growth of the market (drivers, restraints, opportunities, and industry-specific challenges)
- To analyze the opportunities in the market for stakeholders by identifying the high-growth segments of the market
- To strategically analyze the micromarkets with regard to individual growth trends, prospects, and contribution to the total solar simulator market
- To forecast the market size, in terms of value, for various segments regarding 4 main regions: North America, Europe, Asia Pacific (APAC), and Rest of the World (RoW)
- To strategically profile key players and comprehensively analyze their market shares and core competencies, along with the detailing of the competitive landscape for market leaders
- To track and analyze the competitive developments such as joint ventures, mergers and acquisitions, new product developments, and research and development (R&D) carried out in the solar simulator market
A solar simulator is a device that provides illumination approximating natural sunlight. The simulator is widely used to provide a controllable indoor test facility under laboratory conditions for the testing of solar cells. The solar simulator market is expected to be valued at USD 8.44 billion by 2022, growing at a CAGR of 6.5% between 2017 and 2022. Some of the key factors driving this market growth are the growing demand for photovoltaics (PV) and the increasing demand from renewable energy industries.
Solar simulators are used in the development and manufacturing of PV, cosmetics, paints and coatings, UV protective fabrics and textiles, and others. While solar simulators have been deployed for many years in testing and measurement environments, OEMs are looking for next-generation solar simulators with advanced sources of light and control systems that would offer versatility, high performance, and cost reduction to optimize product yields and minimize operating costs. High-volume applications such as PV rely heavily on solar simulators for research and development (R&D), test, and manufacturing. PV cell/module and material testing application are expected to hold the major size of the market and is expected to grow at the highest rate between 2017 and 2022. The growing PV requirements from utility, residential, and nonresidential applications are directly expected to drive the solar simulator market growth.
Class AAA solar simulator is the most preferred solar simulator for PV cell/module testing among the manufacturers, as it provides higher accuracy and efficiency over other types of solar simulators. Companies such as Newport Corporation (US), Abet Technologies Inc. (US), Solar Light Company (US), and Sciencetech Inc. (Canada) are involved in the manufacture of class AAA solar simulator, because of its popularity in the testing of PV cells and modules in the solar industry.
The solar simulator market for xenon arc lamp is expected to grow at the highest rate between 2017 and 2022. The rapid growth of this segment is attributed to the proven technology, reliable output, and better spectrum, needed for illuminating the sample being tested. Mostly, xenon arc lamps are used in the solar industry for testing PV cells and modules. The growing PV market is expected to drive the market for xenon arc lamp during the forecast period.
SOLAR SIMULATOR MARKET, BY REGION, 2022 (USD BILLION)
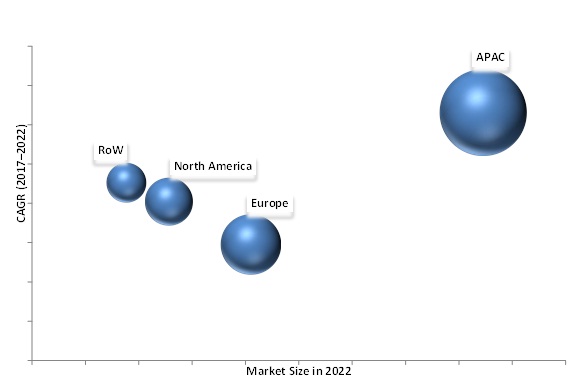
APAC is expected to hold the largest share of the solar simulator market in 2017 and is expected to grow at the highest rate between 2017 and 2022. The increasing demand for solar simulators in APAC region is driven by the growing solar energy market, the implementation of stringent green energy regulations across major Asian countries, and the continuous government support for the development and commercialization of advanced PV technologies and the growing market for SPF and UV resistance products.
However, the high cost of solar simulators acts as a major restraint for the market. Evolving solar industry and decreasing costs of solar systems and energy storage devices act as an opportunity for the market.
Newport Corporation (US), Meyer Burger technology AG (Switzerland), Gsolar Power Co., Ltd. (China), Spire Solar (Netherlands), and Solar Light Company (US) are the leading companies in the solar simulator market. Companies in the market are strengthening their product portfolios by investing mainly in R&D. The key players in this market are also undertaking partnerships and collaborations to develop new technologies.
 Exclusive indicates content/data unique to MarketsandMarkets and not available with any competitors.
Table of Contents
1 Introduction (Page No. - 15)
1.1 Study Objectives
1.2 Market Definition
1.3 Study Scope
1.3.1 Years Considered For the Study
1.4 Currency
1.5 Limitations
1.6 Stakeholders
2 Research Methodology (Page No. - 18)
2.1 Research Data
2.1.1 Secondary Data
2.1.1.1 Key Data from Secondary Sources
2.1.1.2 Secondary Sources Referred For Key Data Collection
2.1.2 Primary Data
2.1.2.1 Breakdown of Primaries
2.1.2.2 Key Data from Primary Sources
2.1.2.3 Key Industry Insights
2.2 Market Size Estimation
2.3 Market Breakdown and Data Triangulation
2.4 Assumptions
3 Executive Summary (Page No. - 29)
4 Premium Insights (Page No. - 37)
4.1 Solar Simulator Market, 2017–2022
4.2 Market, By Dimension (2017–2022)
4.3 Market, By Light Source (2017–2022)
4.4 Market, By Application and Geography (2017)
4.5 Market, By Geography (2017–2022)
5 Market Overview (Page No. - 41)
5.1 Introduction
5.2 Market Dynamics
5.2.1 Market Drivers
5.2.1.1 Increasing Adoption of Green Energy And Emergence Of Smart Cities
5.2.1.2 Supportive Government Policies, Initiatives, and Regulatory Compliance
5.2.1.3 Increasing Demand For Solar Systems In Residential Applications
5.2.2 Market Restraints
5.2.2.1 High Cost of Solar Simulators
5.2.2.2 Reducing Subsidies
5.2.3 Market Opportunities
5.2.3.1 Evolving Solar Industry
5.2.3.2 Decreasing Costs of Solar Systems and Energy Storage Devices
5.2.4 Market Challenges
5.2.4.1 Designing and Implementation of A Solar Simulator
6 Industry Insights (Page No. - 46)
6.1 Introduction
6.2 Value Chain Analysis
6.3 Key Industry Trends
6.4 Porter’s Five Forces Analysis
7 Solar Simulator Market, By Dimension (Page No. - 52)
7.1 Introduction
7.2 Class AAA
7.3 Class ABA
7.4 Class ABB
8 Solar Simulator Market, By Light Source (Page No. - 63)
8.1 Introduction
8.2 Xenon Arc Lamp
8.3 Metal Halide Arc Lamp
8.4 Light-Emitting Diode (Led) Lamp
8.5 Ultraviolet (UV) Lamp
8.6 Quartz Tungsten Halogen (QTH) Lamp
9 Solar Simulator Market, By Application (Page No. - 73)
9.1 Introduction
9.2 PV Cell/Module and Material Testing
9.3 UV Testing Of Materials and Products
9.3.1 UV Testing Of Material and Product Types
9.3.2 Plastics, Paints, and Coatings
9.3.3 Textile/Fabric
9.3.4 Dermatological Products
9.3.5 Others
9.4 Automotive Testing
9.5 Biomass Study
9.6 Others
10 Regional Analysis (Page No. - 89)
10.1 Introduction
10.2 North America
10.2.1 Us
10.2.2 Canada
10.2.3 Mexico
10.3 Europe
10.3.1 Germany
10.3.2 UK
10.3.3 France
10.3.4 Italy
10.3.5 Rest of Europe (Roe)
10.4 APAC
10.4.1 China
10.4.2 Japan
10.4.3 India
10.4.4 Rest of APAC (ROAPAC)
10.5 Rest of the World (Row)
10.5.1 Middle East and Africa
10.5.2 South America
11 Competitive Landscape (Page No. - 114)
11.1 Overview
11.2 Key Players in Solar Simulator Market
11.3 Dive Chart Analysis
11.3.1 Vanguards
11.3.2 Dynamic
11.3.3 Innovator
11.3.4 Emerging
11.4 Product Offerings
11.5 Business Strategy
12 Company Profiles (Page No. - 122)
(Business Overview, Products Offered & Services Strategies, Key Insights, Recent Developments, MNM View)*
12.1 Introduction
12.2 Newport Corporation
12.3 Spire Solar, LLC
12.4 Solar Light Company
12.5 Abet Technologies, Inc.
12.6 Sciencetech, Inc.
12.7 Spectrolab Inc.
12.8 OAI
12.9 Asahi Spectra Co., Ltd.
12.10 Iwasaki Electric Co., Ltd.
12.11 Wacom Electric Co., Ltd.
12.12 Market Innovators
12.12.1 Meyer Burger Technology AG
12.12.2 Gsolar Power Co., Ltd.
12.12.3 Nisshinbo Mechatronics, Inc.
12.12.4 Endeas OY
*Details On Business Overview, Products Offered & Services Strategies, Key Insights, Recent Developments, MNM View Might Not Be Captured In Case Of Unlisted Companies.
13 Appendix (Page No. - 154)
13.1 Insights of Industry Experts
13.2 Discussion Guide
13.3 Knowledge Store: Marketsandmarkets’ Subscription Portal
13.4 Introducing RT: Real-Time Market Intelligence
13.5 Available Customizations
13.6 Related Reports
13.7 Author Details
List Of Tables (62 Tables)
Table 1 Key Data from Primary Sources
Table 2 Solar Simulator Market Size, 2014–2022 (USD Million)
Table 3 Market Shipment, 2014–2022 (Thousand Units)
Table 4 Market Asp Analysis, 2014–2022 (USD)
Table 5 Solar Simulator Market, By Dimension, 2014–2022 (USD Million)
Table 6 Market, By Light Source, 2014–2022 (USD Million)
Table 7 Market In APAC, By Country, 2014–2022 (USD Million)
Table 8 Market, By Dimension, 2014–2022 (USD Million)
Table 9 Market For Class AAA Solar Simulators, By Light Source, 2014–2022 (USD Million)
Table 10 Market For Class AAA Solar Simulators, By Region, 2014–2022 (USD Million)
Table 11 Market For Class ABA Solar Simulators, By Light Source, 2014–2022 (USD Million)
Table 12 Market For Class ABA Solar Simulators, By Region, 2014–2022 (USD Million)
Table 13 Market For Class ABB Solar Simulators, By Light Source, 2014–2022 (USD Million)
Table 14 Market For Class ABB Solar Simulators, By Region, 2014–2022 (USD Million)
Table 15 Market, By Light Source, 2014–2022 (USD Million)
Table 16 Market For Xenon Arc Lamps, By Dimension,2014–2022 (USD Million)
Table 17 Market For Metal Halide Arc Lamps, By Dimension, 2014–2022 (USD Million)
Table 18 Market For Led Lamps, By Dimension,2014–2022 (USD Million)
Table 19 Market For UV Lamps, By Dimension,2014–2022 (USD Million)
Table 20 Market For QTH Lamps, By Dimension,2014–2022 (USD Million)
Table 21 Market, By Application, 2014–2022 (USD Million)
Table 22 Market For PV Cell/Module And Material Testing, By Dimension, 2014–2022 (USD Million)
Table 23 Market For PV Cell/Module And Material Testing, By Region, 2014–2022 (USD Million)
Table 24 Market For UV Testing Of Materials And Products, By Dimension, 2014–2022 (USD Million)
Table 25 Market For UV Testing Of Materials And Products, By Region, 2014–2022 (USD Million)
Table 26 Market For UV Testing Of Materials And Products, By Type, 2014–2022 (USD Million)
Table 27 Market For UV Testing Of Plastics, Paints, And Coatings, By Region, 2014–2022 (USD Million)
Table 28 Market For UV Testing Of Textile/Fabric, By Region, 2014–2022 (USD Million)
Table 29 Market For UV Testing Of Dermatological Products, By Region, 2014–2022 (USD Million)
Table 30 Market For UV Testing Of Other Types, By Region,2014–2022 (USD Million)
Table 31 Market For Automotive Testing, By Dimension,2014–2022 (USD Million)
Table 32 Market For Automotive Testing, By Region,2014–2022 (USD Million)
Table 33 Market For Biomass Studies, By Dimension,2014–2022 (USD Million)
Table 34 Market For Biomass Studies, By Region,2014–2022 (USD Million)
Table 35 Market For Other Applications, By Dimension,2014–2022 (USD Million)
Table 36 Market For Other Applications, By Region,2014–2022 (USD Million)
Table 37 Market, By Region, 2014–2022 (USD Million)
Table 38 North American Market For PV Cell/Module And Material Testing, By Dimension, 2014–2022 (USD Million)
Table 39 North American Market For UV Testing Of Materials And Products, By Dimension, 2014–2022 (USD Million)
Table 40 North American Market For Automotive Testing, By Dimension, 2014–2022 (USD Million)
Table 41 North American Market For Biomass Studies, By Dimension, 2014–2022 (USD Million)
Table 42 North American Market For Other Applications, By Dimension, 2014–2022 (USD Million)
Table 43 North American Market, By Country,2014–2022 (USD Million)
Table 44 European Market For PV Cell/Module And Material Testing, By Dimension, 2014–2022 (USD Million)
Table 45 European Market For UV Testing Of Materials And Products, By Dimension, 2014–2022 (USD Million)
Table 46 European Market For Automotive Testing, By Dimension, 2014–2022 (USD Million)
Table 47 European Market For Biomass Studies, By Dimension, 2014–2022 (USD Million)
Table 48 European Market For Other Applications, By Dimension, 2014–2022 (USD Million)
Table 49 European Market, By Country, 2014–2022 (USD Million)
Table 50 Market For PV Cell/Module And Material Testing In APAC, By Dimension, 2014–2022 (USD Million)
Table 51 Market For UV Testing Of Materials And Products In APAC, By Dimension, 2014–2022 (USD Million)
Table 52 Market For Automotive Testing In APAC, By Dimension, 2014–2022 (USD Million)
Table 53 Market For Biomass Studies In APAC, By Dimension, 2014–2022 (USD Million)
Table 54 Market For Other Applications In APAC, By Dimension, 2014–2022 (USD Million)
Table 55 Market In APAC, By Country, 2014–2022 (USD Million)
Table 56 Market For PV Cell/Module And Material Testing In Row, By Dimension, 2014–2022 (USD Million)
Table 57 Market For UV Testing Of Materials And Products In Row, By Dimension, 2014–2022 (USD Million)
Table 58 Market For Automotive Testing In Row, By Dimension, 2014–2022 (USD Million)
Table 59 Market For Biomass Studies In Row, By Dimension, 2014–2022 (USD Million)
Table 60 Market For Other Applications In Row, By Dimension, 2014–2022 (USD Million)
Table 61 Market In Row, By Region, 2014–2022 (USD Million)
Table 62 Ratings Of The Top 5 Players In The Market, 2016
List Of Figures (89 Figures)
Figure 1 Market Segmentation
Figure 2 Solar Simulator Market: Process Flow Of Market Size Estimation
Figure 3 Market: Research Design
Figure 4 Bottom-Up Approach For Market Size Estimation: Market
Figure 5 Top-Down Approach For Market Size Estimation: Market
Figure 6 Data Triangulation
Figure 7 PV Cell/Module and Material Testing Expected To Lead The Market During The Forecast Period
Figure 8 Class AAA Solar Simulators Expected To Hold The Largest Size Of The Market During The Forecast Period
Figure 9 Xenon Arc Lamps Expected To Hold the Largest Size Of The Market During The Forecast Period
Figure 10 APAC Expected To Hold The Largest Size Of The Market In 2017
Figure 11 APAC Expected To Hold The Largest Size Of The Market During The Forecast Period
Figure 12 China Expected To Dominate The Market In APAC During The Forecast Period
Figure 13 Attractive Growth Opportunities In The Market Between 2017 And 2022
Figure 14 Market For Class AAA Solar Simulators Expected To Grow At The Highest Rate Between 2017 And 2022
Figure 15 Xenon Arc Lamps Expected To Hold the Largest Share of The Market During The Forecast Period
Figure 16 PV Cell/Module and Material Testing and APAC Expected To Hold the Largest Share Of The Market In 2017
Figure 17 Market In APAC Expected To Grow At The Highest Rate During The Forecast Period
Figure 18 Increasing Adoption of Green Energy and Supportive Government Policies Expected To Drive the Demand For Solar Simulator Products During 2017–2022
Figure 19 Major Value Addition Takes Place during Product Manufacturing and System Integration Phases
Figure 20 Key Industry Trends in the Market
Figure 21 Porter’s Five Forces Analysis: Market (2016)
Figure 22 Porter’s Five Forces Analysis of the Market
Figure 23 Threat Of New Entrants: Low Impact Of Threat Of New Entrants
Figure 24 Threat Of Substitutes: Low Impact Of Threat Of Substitutes
Figure 25 Bargaining Power of Suppliers: Medium Impact of Bargaining Power of Suppliers
Figure 26 Bargaining Power of Buyers: Medium Impact of Bargaining Power of Buyers
Figure 27 Intensity of Competitive Rivalry: Medium Impact of Intensity of Competitive Rivalry
Figure 28 Market, By Dimension
Figure 29 Class AAA Solar Simulators Expected To Lead The Market During The Forecast Period
Figure 30 Xenon Arc Lamps Expected To Dominate the Market for Class AAA Solar Simulators During The Forecast Period
Figure 31 APAC Expected To Lead the Market for Class AAA Solar Simulators during the Forecast Period
Figure 32 Xenon Arc Lamps Expected To Dominate the Market for Class Aba Solar Simulators during the Forecast Period
Figure 33 Xenon Arc Lamps Expected To Dominate the Market for Class ABB Solar Simulators during the Forecast Period
Figure 34 Market, By Light Source
Figure 35 Xenon Arc Lamps Expected To Lead the Market during the Forecast Period
Figure 36 Class AAA Solar Simulators Expected To Dominate The Market For Xenon Arc Lamps During The Forecast Period
Figure 37 Class AAA Solar Simulators Expected To Dominate The Market For Metal Halide Arc Lamps During The Forecast Period
Figure 38 Class AAA Solar Simulators Expected To Dominate The Market For Led Lamps During The Forecast Period
Figure 39 Class AAA Solar Simulators Expected To Dominate The Market For UV Lamps During The Forecast Period
Figure 40 Class AAA Solar Simulators Expected To Dominate The Market For QTH Lamps During The Forecast Period
Figure 41 Market, By Application
Figure 42 PV Cell/Module and Material Testing Expected To Lead The Market During The Forecast Period
Figure 43 Class AAA Solar Simulators Expected To Dominate The Market For PV Cell/Module And Material Testing During The Forecast Period
Figure 44 APAC Expected To Dominate the Market For PV Cell/Module And Material Testing During The Forecast Period
Figure 45 APAC Expected To Dominate the Market for UV Testing Of Materials and Products During The Forecast Period
Figure 46 Types of Materials and Products for UV Testing
Figure 47 APAC Expected To Dominate the Market for Automotive Testing During the Forecast Period
Figure 48 APAC Expected To Dominate the Market for Biomass Studies during the Forecast Period 86
Figure 49 Class AAA Solar Simulators Expected To Dominate The Market For Other Applications During The Forecast Period
Figure 50 Market In APAC Expected To Grow At The Highest Rate During The Forecast Period
Figure 51 Market Snapshot: North America (2017–2022)
Figure 52 US Expected To Lead the North American Market during the Forecast Period
Figure 53 Market Snapshot: Europe (2017–2022)
Figure 54 Germany Expected To Dominate the European Market during the Forecast Period
Figure 55 Market Snapshot: APAC (2017–2022)
Figure 56 China Expected To Dominate the Market In APAC During The Forecast Period
Figure 57 Middle East And Africa Expected To Dominate the Market in APAC During The Forecast Period
Figure 58 Companies Adopted New Product Launches and Merger & Acquistions As The Key Growth Strategy Between 2013 And 2017
Figure 59 Market Overview: Dive Analysis
Figure 60 Newport Corporation: Product Offering Scorecard
Figure 61 Newport Corporation: Business Strategy Scorecard
Figure 62 Spire Solar: Product Offering Scorecard
Figure 63 Spire Solar: Business Strategy Scorecard
Figure 64 Solar Light Company: Product Offering Scorecard
Figure 65 Solar Light Company: Business Strategy Scorecard
Figure 66 Abet Technologies, Inc.: Product Offering Scorecard
Figure 67 Abet Technologies, Inc.: Business Strategy Scorecard
Figure 68 Sciencetech, Inc.: Product Offering Scorecard
Figure 69 Sciencetech, Inc.: Business Strategy Scorecard
Figure 70 Spectrolab Inc.: Product Offering Scorecard
Figure 71 Spectrolab Inc.: Business Strategy Scorecard
Figure 72 OAI: Product Offering Scorecard
Figure 73 OAI: Business Strategy Scorecard
Figure 74 Asahi Spectra Co., Ltd.: Product Offering Scorecard
Figure 75 Asahi Spectra Co., Ltd.: Business Strategy Scorecard
Figure 76 Iwasaki Electric Co., Ltd.: Company Snapshot
Figure 77 Iwasaki Electric Co., Ltd.: Product Offering Scorecard
Figure 78 Iwasaki Electric Co., Ltd.: Business Strategy Scorecard
Figure 79 Wacom Electric Co., Ltd.: Product Offering Scorecard
Figure 80 Wacom Electric Co., Ltd.: Business Strategy
Figure 81 Meyer Burger Technology Ag: Company Snapshot
Figure 82 Meyer Burger Technology Ag: Product Offering Scorecard
Figure 83 Meyer Burger Technology Ag: Business Strategy Scorecard
Figure 84 Gsolar Power Co., Ltd.: Product Offering Scorecard
Figure 85 Gsolar Power Co., Ltd.: Business Strategy
Figure 86 Nisshinbo Mechatronics, Inc.: Product Offering Scorecard
Figure 87 Nisshinbo Mechatronics, Inc.: Business Strategy
Figure 88 Endeas OY: Product Offering Scorecard
Figure 89 Endeas OY: Business Strategy Scorecard
During this research study, the major players operating in the solar simulator market in various regions have been identified, and their offerings, regional presence, and distribution channels have been analyzed through in-depth discussions. To find the overall market size, top-down and bottom-up approaches have been used. To estimate the sizes of other individual markets, percentage splits are used that are obtained using secondary sources such as Hoovers, Bloomberg BusinessWeek, Factiva, and OneSource, along with primary respondents. The entire procedure includes the study of the annual and financial reports of the top market players and extensive interviews with the industry experts such as CEOs, VPs, directors, and marketing executives for key insights (both qualitative and quantitative) pertaining to the market. The figure below shows the breakdown of the primaries on the basis of the company type, designation, and region, conducted during the research study.
BREAKDOWN OF PRIMARY PARTICIPANTS
![]()
Note: The three tiers of the companies are defined on the basis of their total revenue; as of 2016, Tier 1: > USD 2 billion, Tier 2: USD 500 million to USD 2 billion, and Tier 3: < USD EM million.< 500>
The solar simulator market comprises a network of research and product development, manufacturing/assembly, distributor and reseller, marketing and sales, and post-sale services. The key players operating in the market include Newport Corporation (US), Meyer Burger Technology AG (Switzerland), Gsolar Power Co., Ltd. (China), Spire Solar (Netherlands), Solar Light Company (US), Abet Technologies, Inc. (US), Sciencetech Inc. (Canada), Spectrolab Inc. (US), OAI (US), Asahi Spectra Co., Ltd. (Japan), Iwasaki Electric Co., Ltd. (Japan), Nisshinbo Mechatronics, Inc. (Japan), Endeas Oy (Finland), and Wacom Electric Co., Ltd. (Japan).
Scope of the Report:
|
Report Metric |
Details |
|
Base year |
2016 |
|
Forecast period |
2017–2022 |
|
Units |
Value (USD) |
|
Segments covered |
Type, End User, Offerings, and Region |
|
Geographic regions covered |
North America, APAC, Europe, and RoW |
|
Companies covered |
Newport Corporation (US), Meyer Burger Technology AG (Switzerland), Gsolar Power Co., Ltd. (China), Spire Solar (Netherlands), Solar Light Company (US), Abet Technologies, Inc. (US), Sciencetech Inc. (Canada), Spectrolab Inc. (US), OAI (US), Asahi Spectra Co., Ltd. (Japan), Iwasaki Electric Co., Ltd. (Japan), Nisshinbo Mechatronics, Inc. (Japan), Endeas Oy (Finland), and Wacom Electric Co., Ltd. (Japan) |
Target Audience:
- Solar ingot/wafer, cell, and module manufacturers
- Solar PV equipment suppliers
- Solar thermal system manufacturers and suppliers
- Solar power plant owners and operators
- Solar equipment suppliers
- Solar energy investors
- Government agencies and industry associations
- Research organizations and consulting companies
- Solar equipment distributors and traders
- Venture capitalists, private equity firms, and start-up companies
- End users, who are willing to know more about solar simulator technology and latest technological developments in the market
Report Scope:
Solar Simulator Market, by Dimension:
- Class AAA
- Class ABA
- Class ABB
Solar Simulator Market, by Light Source:
- Xenon arc lamp
- Metal halide arc lamp
- LED lamp
- UV lamp
- QTH lamp
Solar Simulator Market, by Application:
- PV cell/module and material testing
-
UV testing of materials and products
- Plastics, paints, and coatings
- Textile/fabric
- Dermatological products
- Others
- Automotive testing
- Biomass study
- Others (testing of terrestrial, aerospace, and satellite product coatings; and plant growth studies)
Solar Simulator Market, by Geography:
- North America
- Europe
- APAC
- RoW
Available Customizations:
With the given market data, MarketsandMarkets offers customizations according to the client’s specific needs. The following customization options are available for the report:
Geographic Analysis
- Further analysis of the solar simulator market for additional countries
Company Information
- Detailed analysis and profiling of additional market players (up to 5)


Growth opportunities and latent adjacency in Solar Simulator Market
We are in theory interested in the report, but the solar simulator market size estimate of USD 8.44 billion in 2022 makes the credibility of the report questionable. According to our understanding, this number must be several orders of magnitude off. Can you provide any reasoning for the number? According to PV Tech, the CAPEX of the whole PV value chain was around USD 6 billion in 2016. Can you help us with the methodology for such high numbers?
We seek to understand the market size and projections for solar simulators and the pain points associated with existing users and fabricators of solar simulators. Also, how would the decreasing cost of solar systems and energy storage impact the market?