
Smart Textiles Market Size, Share & Trends

Smart Textiles Market by Type (Passive, Active), Form (Wearable, Non-wearable), Fabric Type (Cotton, Nylon & Polyester, Wool & Silk), Fabric (Cotton, Nylon, Wool, Graphene, Conductive), Application (Sensing, Energy Harvesting) - Global Forecast to 2030


OVERVIEW
Source: Secondary Research, Interviews with Experts, MarketsandMarkets Analysis
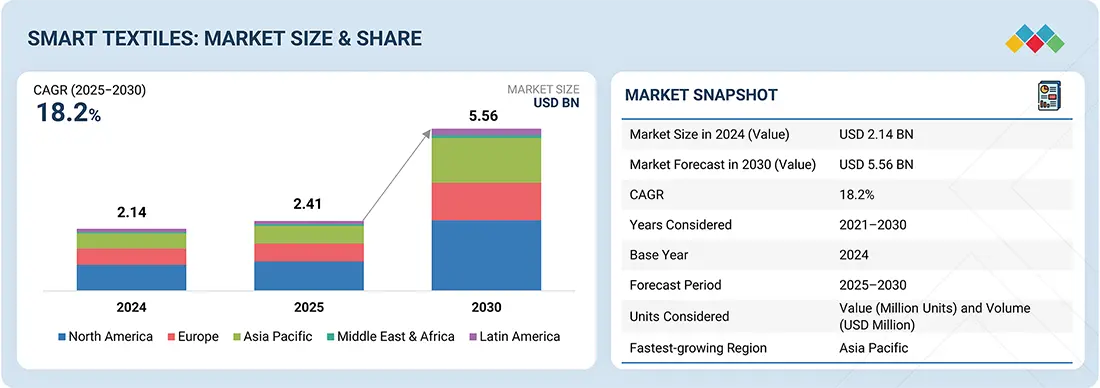
The smart textiles market is projected to grow from USD 2.41 billion in 2025 to USD 5.56 billion by 2030, at a CAGR of 18.2%. The growth of the smart textiles market is driven by the rising demand for wearable technologies, the increasing health awareness, and the need for responsive and adaptive clothing solutions. Industries such as healthcare, military, sports, and fashion actively invest in smart fabrics for real-time monitoring, performance enhancement, and safety.
KEY TAKEAWAYS
-
BY TYPEThe smart textiles market comprises active and passive textiles, with active textiles gaining traction for real-time sensing and energy harvesting. In contrast, passive textiles are valued for their aesthetic and functional enhancements in fashion and protection applications.
-
BY APPLICATIONGrowing demand for smart textiles in sensing for health monitoring, energy harvesting for sustainable power, thermoluminescence for temperature regulation, and aesthetics for innovative designs, driven by advancements in wearable technology and IoT integration.
-
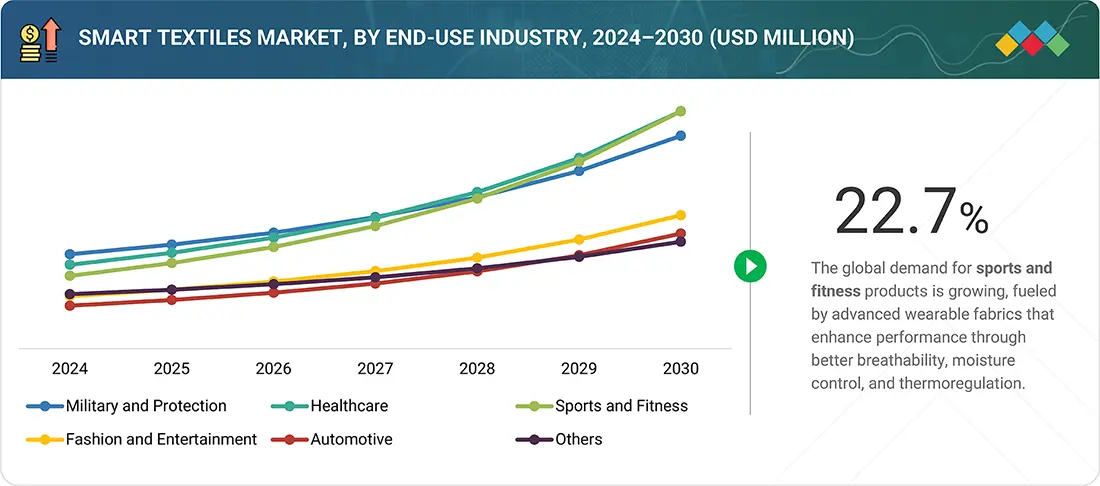
BY END-USE INDUSTRYThe military and protection sector is led by the demand for smart fabrics with enhanced durability and safety, followed by healthcare for medical monitoring, sports and fitness for performance tracking, fashion and entertainment for style innovation, automotive, and others for smart interiors.
-
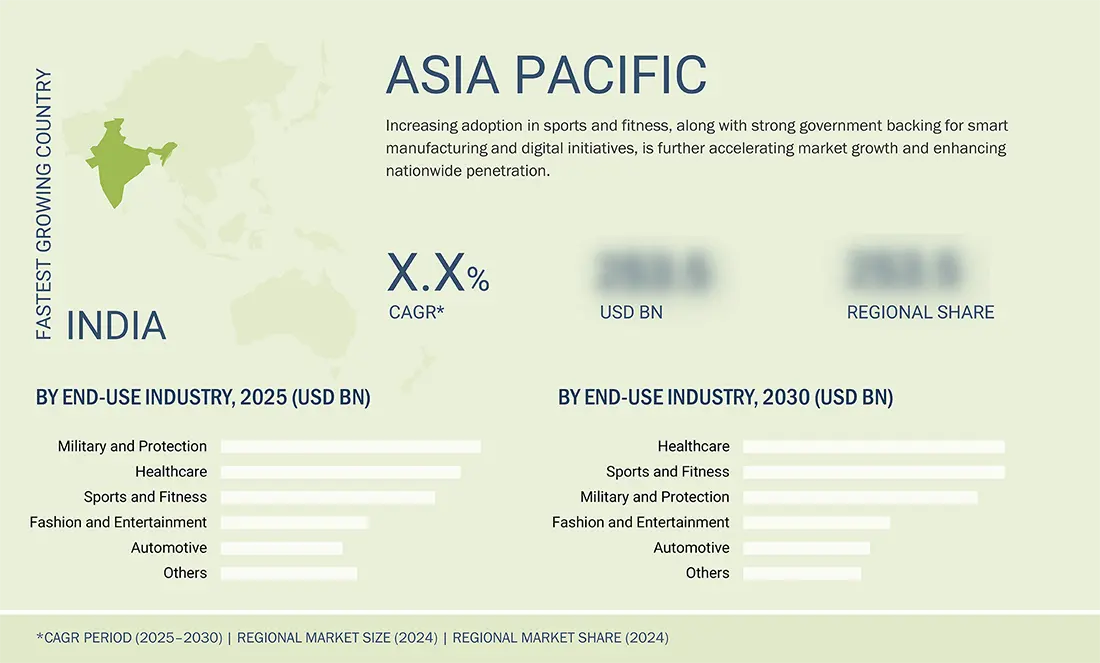
BY REGIONAsia Pacific is expected to record the highest CAGR of 20.4% during the forecast period, fueled by the rising adoption of wearable technology and increasing investments in healthcare and fitness monitoring.
-
COMPETITIVE LANDSCAPEMajor players such as DuPont have adopted organic and inorganic strategies, including partnerships and investments. For instance, DuPont has collaborated with tech firms to integrate smart fibers, catering to the rising demand for innovative applications in healthcare and sports.
The smart textiles market is experiencing significant growth driven by increasing demand for wearable and connected devices across healthcare, sports, military, and fashion industries. Smart textiles enable real-time monitoring of vital signs, chronic conditions, and patient recovery in healthcare, reducing the burden on traditional healthcare systems.
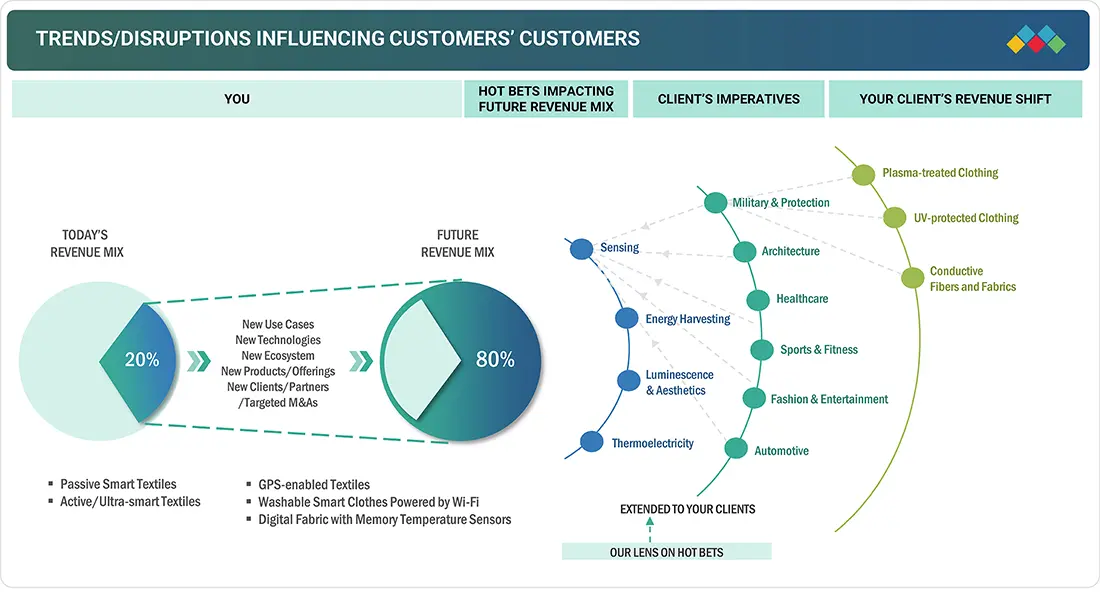
TRENDS & DISRUPTIONS IMPACTING CUSTOMERS' CUSTOMERS
The current revenue mix, largely driven by passive and active/ultra-smart textiles, is set to transform as advanced technologies such as GPS-enabled fabrics, Wi-Fi-powered clothing, and memory-integrated textiles gain prominence. These innovations will unlock new revenue streams in sensing, energy harvesting, luminescence, aesthetics, and thermo-electricity, reshaping military, healthcare, automotive, fashion, and sports applications. As demand shifts from conventional solutions toward intelligent textiles, companies must adapt by focusing on plasma-treated fabrics, conductive materials, and next-generation protective clothing, creating significant high-value growth opportunities.
Source: Secondary Research, Interviews with Experts, MarketsandMarkets Analysis
MARKET DYNAMICS
Level
-
Implementation of advanced technologies in smart textiles

-
Proliferation of low-cost smart wireless sensor networks

Level
-
Need to adhere to stringent standards, regulations, and certifications

-
Integration complexities when incorporating sensors into legacy systems across industries

Level
-
Development of flexible electronics

-
Development of multi-featured and hybrid smart textiles

Level
-
Technical difficulties related to the integration of electronics and textiles

-
Product protection and thermal consideration

Source: Secondary Research, Interviews with Experts, MarketsandMarkets Analysis
Driver: Implementation of advanced technologies in smart textiles
Implementing advanced technologies in smart textiles is a key driver, revolutionizing the industry by integrating sensors, nanotechnology, and IoT for enhanced functionality. This fosters innovation in wearable electronics, enabling real-time health monitoring and performance tracking. The adoption of cutting-edge materials such as conductive fibers and flexible circuits boosts market growth, catering to diverse sectors such as healthcare, sports, and fashion.
Restraint: Need to adhere to stringent standards, regulations, and certifications
Lack of standards and regulations hinders market growth, causing inconsistency in quality and safety across regions. This regulatory gap slows adoption, despite advanced technology implementation, posing risks to scalability and consumer trust in smart textile products.
Opportunity: Development of flexible electronics
The development of flexible electronics presents significant opportunities, allowing the creation of lightweight, bendable components ideal for wearable tech. This opens avenues for integrating electronics and textiles seamlessly, enhancing product versatility in medical devices and fashion. The rise of multi-featured and hybrid smart textiles offers potential for innovative applications, such as adaptive clothing with climate control or fitness tracking.
Challenge: Technical difficulties related to the integration of electronics and textiles
Technical difficulties related to the integration of electronics and textiles challenge production, leading to higher failure rates. These issues and high costs limit market accessibility and widespread use of smart textiles.
Smart Textiles Market: COMMERCIAL USE CASES ACROSS INDUSTRIES
| COMPANY | USE CASE DESCRIPTION | BENEFITS |
|---|---|---|
 |
Smart textiles integrated in performance apparel and protective gear for industrial workers | Enhanced worker safety | Real-time health monitoring | Reduced injury risks |
 |
Manufacturing of wearable smart textiles for consumer electronics and fitness tracking | Scalable production | Cost efficiency | Rapid customization for market needs |
 |
Thermal-regulating smart textiles in automotive seating and apparel for climate control | Improved passenger comfort | Energy savings in vehicles | Extended product durability |
 |
AI-powered smart clothing for professional athletes and sports training applications | Real-time performance analytics | Injury prevention | Optimized training regimens |
 |
Sensor-embedded smart socks and garments for health monitoring in medical rehabilitation | Precise gait analysis | Remote patient tracking | Accelerated recovery outcomes |
Logos and trademarks shown above are the property of their respective owners. Their use here is for informational and illustrative purposes only.
MARKET ECOSYSTEM
The smart textiles market ecosystem encompasses a diverse range of manufacturers and end-use industries, driving innovation and adoption. Key manufacturers such as DuPont, Jabil, AIQ, Hexoskin, Sensing Tex, Alphabet, Gentherm, Samsung, and Microsoft lead with advanced textile technologies, integrating sensors and smart materials. These innovations serve end-use industries, including military & protection, healthcare, sports & fitness, fashion & entertainment, and automotive, addressing needs such as safety, health monitoring, performance enhancement, and comfort. This collaborative ecosystem fosters growth, with each sector leveraging tailored smart textile solutions to meet evolving demands.
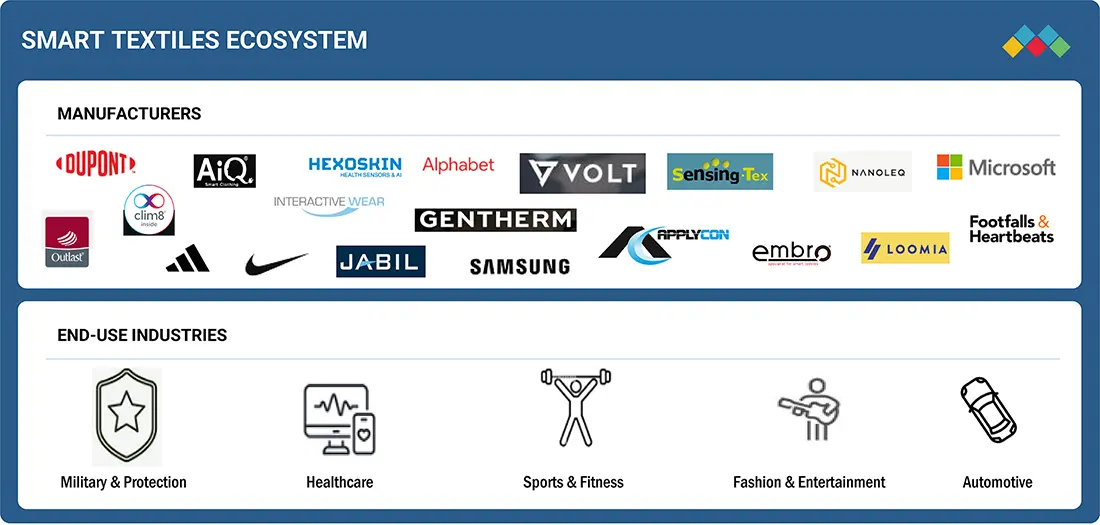
Logos and trademarks shown above are the property of their respective owners. Their use here is for informational and illustrative purposes only.
MARKET SEGMENTS
Source: Secondary Research, Interviews with Experts, MarketsandMarkets Analysis
Smart Textiles Market, by Type
The active ultra segment is projected to witness the highest CAGR in the smart textiles market during the forecast period, driven by advancements in wearable technology and demand for real-time health monitoring. Innovations in lightweight, flexible materials enhance performance, fuelling growth in fitness, medical, and military applications through 2030.
Smart Textiles Market, by Application
The sensing segment is projected to hold the largest share of the smart textiles market by 2025, owing to its critical role in health monitoring, safety, and performance tracking. Integration of sensors in garments for vital signs and environmental detection boosts adoption across healthcare, sports, and industrial sectors.
Smart Textiles, by End-use Industry
In 2024, the military & protection segment accounted for the largest share of the smart textiles market, driven by demand for advanced gear with embedded sensors for surveillance and safety. Growth is fuelled by investments in durable, lightweight fabrics, with applications expanding into healthcare and automotive by 2025.
REGION
Asia Pacific to be fastest-growing region in global smart textiles market during forecast period
The Asia Pacific region is projected to record the highest CAGR in the smart textiles market during the forecast period, driven by rapid urbanization, rising disposable incomes, and strong demand for wearable technologies. Government initiatives supporting smart manufacturing and expanding healthcare and sports industries further accelerate regional adoption and market expansion.
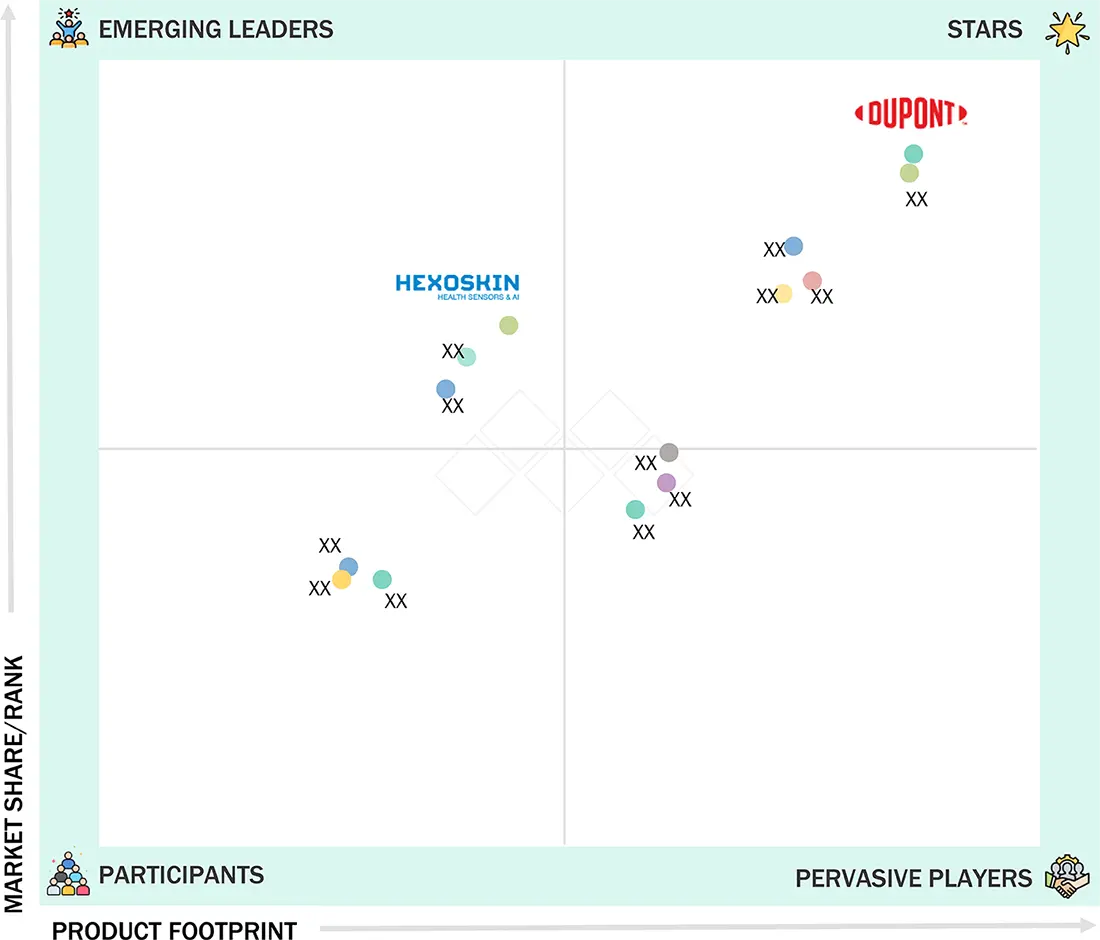
Smart Textiles Market: COMPANY EVALUATION MATRIX
In the smart textiles market matrix, DuPont (Star) leads with a strong market presence and extensive product portfolio, enabling widespread adoption across military, protection, healthcare, and sports and fitness sectors. Hexoskin (Emerging Leader) is steadily gaining traction with innovative smart textile solutions focused on smart applications. While DuPont dominates through scale and an established customer base, Hexoskin demonstrates solid growth potential to advance toward the leaders’ quadrant.
Source: Secondary Research, Interviews with Experts, MarketsandMarkets Analysis
KEY MARKET PLAYERS
- DuPont (US)
- Jabil Inc. (US)
- Gentherm (US)
- AiQ Smart Clothing (Taiwan)
- Sensoria (US)
- Alphabet (US)
- Interactive Wear (Germany)
- Outlast Technologies GmbH (Germany)
- Adidas (Germany)
- Hexoskin (Canada)
- Clim8 SAS (France)
- NIKE, Inc. (US)
- Sensing Tex (Spain)
- Applycon, s. r. o. (Czech Republic)
- Footfalls Smartex Limited. (UK)
MARKET SCOPE
| REPORT METRIC | DETAILS |
|---|---|
| Market Size in 2024 (Value) | USD 2.14 Billion |
| Market Forecast in 2030 (Value) | USD 5.56 Billion |
| Growth Rate | CAGR of 18.2% from 2025 to 2030 |
| Years Considered | 2021–2024 |
| Base Year | 2024 |
| Forecast Period | 2025–2030 |
| Units Considered | Value (USD Million) and Volume (Million Units) |
| Report Coverage | Revenue Forecast, Company Ranking, Competitive Landscape, Growth Factors, and Trends |
| Segments Covered | By Type: Passive smart textiles, Active/Ultra smart textiles, by Application: Sensing, Energy Harvesting & Thermo-electricity, Luminescence & Aesthetics, Other Applications (Conduction, Protection, Networking, Communication) By End-use Industry: Military |
| Regions Covered | North America, Europe, Asia Pacific, and RoW |
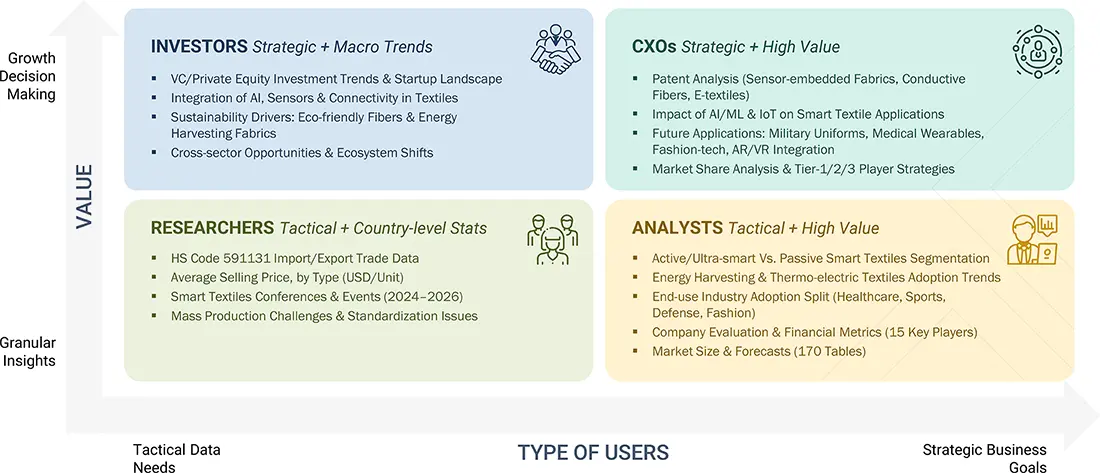
WHAT IS IN IT FOR YOU: Smart Textiles Market REPORT CONTENT GUIDE
DELIVERED CUSTOMIZATIONS
We have successfully delivered the following deep-dive customizations:
| CLIENT REQUEST | CUSTOMIZATION DELIVERED | VALUE ADDS |
|---|---|---|
| US-based Smart Textile Manufacturer |
|
|
| Conductive Fiber-based Smart Textile Manufacturer |
|
|
| Healthcare Smart Textile Manufacturer |
|
|
| US-based Smart Textile Raw Material Supplier |
|
|
| Automotive Smart Textile Customer |
|
|
RECENT DEVELOPMENTS
- April 2025 : DuPont (US) unveiled its silver nanowire-based solutions at Electronics Manufacturing Korea and Automotive World Korea. Showcasing Activegrid ink and film, DuPont introduced transparent conductive technologies for LiDAR heating, EMI shielding, smart surfaces, and OLED displays—offering advanced performance, low-temperature curing, and flexibility for automotive and electronics applications.
- October 2023 : DuPont (US) partnered with Greentex (India) to showcase Artistri P2700 water-based pigment inks printed on recycled polyester textiles at Printing United, advancing eco-friendly, OEKO-TEX certified smart fabrics.
- July 2021 : DuPont (US) completed the acquisition of Laird Performance Materials (US), integrating it into its Electronics & Industrial (E&I) segment under Interconnect Solutions. The acquisition strengthened DuPont's position in advanced electronics by expanding its capabilities in electromagnetic shielding and thermal management, supporting high-growth markets such as 5G, AI, autonomous vehicles, and the Internet of Things. The move enhances DuPont's innovation leadership and broadens its global customer base.
- February 2021 : DuPont (US) acquired Tex Tech's Core Matrix Technology (US), a monolithic fabric structure that significantly reduces backface trauma while increasing ballistic and fragmentation performance for military and law enforcement personnel. The company's acquisition has strengthened its impressive portfolio of life protection solutions, allowing for the development of flexible and lightweight ballistic products that meet the new National Institute of Justice (NIJ) standards for increased durability. Along with enhanced protection, this latest technology also improves the comfort of wearing bullet-resistant body armor.
Table of Contents
 Exclusive indicates content/data unique to MarketsandMarkets and not available with any competitors.
Methodology
The research process for this study included systematic gathering, recording, and analysis of data about customers and companies operating in the smart textiles market. This process involved the extensive use of secondary sources, directories, and databases (Factiva and Oanda) to identify and collect valuable information for the comprehensive, technical, market-oriented, and commercial study of the Smart textiles market.
In-depth interviews were conducted with primary respondents, including experts from core and related industries and preferred manufacturers, to obtain and verify critical qualitative and quantitative information and assess growth prospects. Key players in the smart textiles market were identified through secondary research, and their market rankings were determined through primary and secondary research. This research included studying annual reports of top players and interviewing key industry experts, such as CEOs, directors, and marketing executives.
Secondary Research
Various sources were used in the secondary research process to identify and collect information important for this study. These include company annual reports, press releases, investor presentations, white papers, technology journals, certified publications, articles by recognized authors, directories, and databases.
Secondary research was mainly used to obtain key information about the industry’s value chain, the total pool of market players, the market classification according to industry trends to the bottom-most level, regional markets, and key developments from market and technology-oriented perspectives.
Primary Research
Primary research was also conducted to identify the segmentation types, key players, competitive landscape, and key market dynamics, such as drivers, restraints, opportunities, challenges, and industry trends, along with key strategies adopted by players operating in the Smart textiles market. Extensive qualitative and quantitative analyses were performed on the complete market engineering process to list key information and insights throughout the report.
Extensive primary research has been conducted after acquiring knowledge about the smart textiles market scenarios through secondary research. Several primary interviews have been conducted with experts from the demand (application and region) and supply side (solution type) across four major geographic regions: North America, Europe, Asia Pacific, and RoW. Approximately 60% and 40% of the primary interviews were conducted from the supply and demand sides. These primary data have been collected through questionnaires, emails, and telephonic interviews.

Note: The three tiers of the companies have been defined based on their total/segmental revenue as of 2024: Tier 1 = >USD 1 billion, Tier 2 = USD 1 billion–USD 500 million, and Tier 3 = USD 500 million. ‘Others’ include sales, marketing, and product managers.
To know about the assumptions considered for the study, download the pdf brochure
Market Size Estimation
In the complete market engineering process, the top-down and bottom-up approaches and several data triangulation methods were implemented to estimate and validate the size of the smart textiles market and various other dependent submarkets. Key players in the market were identified through secondary research, and their market share in the respective regions was determined through primary and secondary research. This entire research methodology included the study of annual and financial reports of the top players and interviews with experts (CEOs, VPs, directors, and marketing executives) for key insights (quantitative and qualitative).
All percentage shares, splits, and breakdowns were determined using secondary sources and verified through primary sources. All the possible parameters that affect the markets covered in this research study were accounted for, viewed in detail, verified through primary research, and analyzed to obtain the final quantitative and qualitative data. This data was consolidated and supplemented with detailed inputs and analysis from MarketsandMarkets and presented in this report.
Smart Textiles Market : Top-Down and Bottom-Up Approach

Data Triangulation
After arriving at the overall market size from the market size estimation process, as explained above, the total market has been split into several segments and subsegments. To complete the overall market engineering process and arrive at the exact statistics for all segments and subsegments, market breakdown and data triangulation procedures have been employed, wherever applicable. The data have been triangulated by studying various factors and trends from the demand and supply sides. Along with this, the market has been validated using top-down and bottom-up approaches.
Market Definition
Smart textiles are fabrics designed and manufactured by integrating various technologies to offer the wearer increased functionality. They sense and react to environmental conditions or stimuli created by mechanical, thermal, chemical, electrical, or magnetic sources. The scope of this report includes both smart textiles that are made of special materials, such as conductive yarns and plasma-treated clothing, which are heat resistant, fire resistant, and react and adjust according to the environment, and smart textiles or fabrics woven with technical/electronic components, which enable them to monitor external stimuli, translate it into data, and respond according to the environmental conditions.
Key Stakeholders
- Smart textile manufacturers
- Smart textile suppliers
- Textile manufacturing organizations
- Research organizations and consulting companies
- Associations, organizations, forums, and alliances related to the smart textiles market
- Government bodies such as regulatory authorities and policymakers
- Venture capitalists, private equity firms, and start-ups
Report Objectives
- To define, describe, and forecast the smart textiles market, in terms of value, by type, application, vertical, and region
- To provide the market size estimation for North America, Europe, Asia Pacific, and Rest of the World (RoW), along with their respective country-level market sizes, in terms of value
- To assess the smart textiles market for reflective and thermal cameras in terms of volume
- To give detailed information regarding the drivers, restraints, opportunities, and challenges that influence market growth
- To provide a detailed overview of the smart textiles supply chain, ecosystem analysis, Porter’s five forces analysis, case studies, tariff analysis, regulations, pricing analysis, patent analysis, AI Impact, and US Tariff.
- To strategically analyze micromarkets1 with respect to individual growth trends, prospects, and contributions to the total market
- To analyze key trends related to components, connectivity technologies, and applications that shape and influence the global smart textiles market
- To profile key players and comprehensively analyze their ranking based on their revenues and core competencies2
- To understand opportunities in the market for stakeholders and provide a detailed competitive landscape of the market
- To analyze competitive developments in the smart textiles market, such as expansions, agreements, partnerships, contracts, product developments, and research and development (R&D) activities
Available customizations:
With the given market data, MarketsandMarkets offers customizations according to the company’s specific needs. The following customization options are available for the report:
Key Questions Addressed by the Report
What strategies have been adopted by key companies in the smart textiles market?
Product launches, partnerships, and contracts are major strategies key players adopt to grow in the smart textiles market.
Which region will dominate the smart textiles market in the near future?
North America is expected to dominate the smart textiles market during the forecast period.
Which application will dominate the smart textiles market between 2025 and 2030?
The sensing application segment is expected to dominate the smart textiles market during the forecast period.
Why is the healthcare segment expected to capture the largest share of the smart textiles market in 2030?
The healthcare segment is expected to capture the largest share of the smart textiles market in 2030 due to rising demand for continuous, non-invasive patient monitoring and personalized healthcare solutions.
What are the major companies in the smart textiles market?
Major players in the smart textiles market include DuPont (US), Alphabet (US), Jabil Inc. (US), AiQ Smart Clothing (Taiwan), Sensoria (US), Gentherm (US), Interactive Wear (Germany), Outlast Technologies GmbH (Germany), Adidas (Germany), and Hexoskin (Canada).
Need a Tailored Report?
Customize this report to your needs
Get 10% FREE Customization
Customize This ReportPersonalize This Research
- Triangulate with your Own Data
- Get Data as per your Format and Definition
- Gain a Deeper Dive on a Specific Application, Geography, Customer or Competitor
- Any level of Personalization
Let Us Help You
- What are the Known and Unknown Adjacencies Impacting the Smart Textiles Market
- What will your New Revenue Sources be?
- Who will be your Top Customer; what will make them switch?
- Defend your Market Share or Win Competitors
- Get a Scorecard for Target Partners

Custom Market Research Services
We Will Customise The Research For You, In Case The Report Listed Above Does Not Meet With Your Requirements
Get 10% Free Customisation


Growth opportunities and latent adjacency in Smart Textiles Market