Small Animal Imaging (In-Vivo) Market by Modality (Optical Imaging, PET, SPECT, CT, MRI, ultrasound, Photoacoustic Imaging, Magnetic Particle Imaging), Reagent (Optical Imaging Reagents, Contrast Agents, PET Tracers, SPECT Probes) - Global Forecast to 2021


The global small animal imaging market is estimated to reach USD 910.4 Million by 2021; growing at a CAGR of 6.2% during the forecast period. The technological advancements in the field of molecular imaging, increasing market demand for non-invasive small animal imaging techniques, and growing number of public-private initiatives to support preclinical researches are some key factors fueling the growth of the market. Furthermore, emerging markets such as China and India are offering new growth opportunities for prominent market players. However, factors such as strict regulatory framework that governs preclinical researches, and significant installation and operational costs associated with preclinical imaging modalities are hampering the market growth.
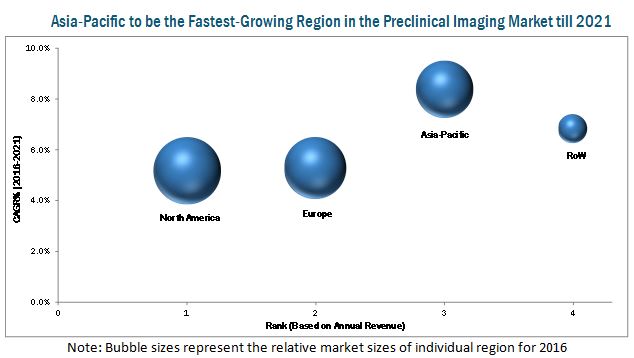
Emerging markets (such as China and India) are offering high growth opportunities for market players operating in the small animal imaging industry. Continuous government support for pharmaceutical and biotechnology R&D, increasing public-private investments to support radioisotope production, rising number of translational research activities, and evolving regulatory scenario across major Asian countries are the key factors propelling the demand for small animal imaging procedures across emerging nations. In order to leverage the high growth opportunities in these emerging nations, leading market players are expanding their presence through partnerships with local market players and suppliers.
As of 2015, PerkinElmer Inc. (U.S.) held the leadership position in the global small animal imaging market. Over the past three years, the company has adopted new product launches, product enhancements, and geographic expansion as its key business strategies to ensure its dominance in this market. Bruker Corporation (U.S.), FUJIFILM Holdings Corporation (Japan), Mediso Ltd. (Hungary), MILabs B.V. (Netherlands), MR Solutions Ltd. (U.K.), Aspect Imaging (Israel), LI-COR Biosciences (U.S.), Trifoil Imaging (U.S.) and Miltenyi Biotec GmbH (Germany) are some of the other key players in market.
Target Audience
- Preclinical Imaging System Manufacturers, Suppliers, and Imaging Software Providers
- Pharmaceutical and Biotechnology Companies
- Preclinical Imaging Reagent Manufacturers and Suppliers
- Contract Research Organizations (CROs)
- Research and Development (R&D) Companies
- Government Research Laboratories
- Independent Research Laboratories
- Government and Independent Regulatory Authorities
- Market Research and Consulting Service Providers
- Medical Research Laboratories
- Academic Medical Institutes and Universities
To know about the assumptions considered for the study, download the pdf brochure
Scope of the Report
This research report categorizes the market into the following segments:
Small Animal Imaging Market, by Modality
-
Optical Imaging Systems
- Bioluminescence/Fluorescence Imaging Systems
- Standalone Fluorescence Imaging Systems
- Optical + X-Ray/Optical + CT
-
Nuclear Imaging Systems
- Micro-PET Systems
- Micro-SPECT Systems
- Trimodality (SPECT/PET/CT) Systems
- MRI Systems
- Ultrasound Systems
- CT Systems
- Photoacoustic Imaging Systems
- Magnetic Particle Imaging (MPI) Systems
Small Animal Imaging Market, by Reagents
-
Optical Imaging Reagents
- Bioluminescent Imaging Reagents
- Fluorescent Imaging Reagents
-
Nuclear Imaging Reagents
- PET Tracers
- SPECT Probes
-
MRI Contrast Agents
- Gadolinium-based Preclinical MRI Contrast Agents
- Iron-based Preclinical MRI Contrast Agents
- Manganese-based Preclinical MRI Contrast Agents
- Ultrasound Contrast Agents
-
CT Contrast Agents
- Iodine-based Preclinical CT Contrast Agents
- Barium-based Preclinical CT Contrast Agents
- Gold Nanoparticles
- Gastrografin-based Preclinical CT Contrast Agents
Small Animal Imaging Market, by Region
- North America
- Europe
- Asia-Pacific
- Rest of the World
Available Customizations
With the given market data, MarketsandMarkets offers customizations as per the company’s specific needs. The following customization options are available for small animal imaging market report:
Product Analysis
- Product Matrix, which gives a detailed comparison of the product portfolios of the top five companies
Geographical Analysis
- Further breakdown of the North American market into the U.S. and Canada
- Further breakdown of the European market into Germany, France, and the U.K.
- Further breakdown of the APAC market into Japan, China, India, and Rest of APAC (RoAPAC)
Company Information
- Detailed analysis and profiling of additional market players (Up to 5)
The global small animal imaging market is expected to reach a value of USD 910.4 Million by 2021; growing at a CAGR of 6.2% during 2016-2021. A number of factors such as technological advancements in the field of molecular imaging, increasing market demand for non-invasive small animal imaging techniques, and growing number of public-private initiatives and funding to support preclinical researches are propelling the growth of the global market. However, factors such as strict regulatory framework that governs preclinical researches, and significant installation and operational costs associated with preclinical imaging modalities are some of the major factors restraining the growth of this market. In addition to this, technological & procedural limitations associated with standalone systems is a major challenge for companies in this market.
On the basis of products, the global small animal imaging market is segmented into two major categories, namely, modality (optical imaging systems, nuclear imaging systems, MRI systems, Ultrasound systems, CT systems, photoacoustic imaging systems, and magnetic particle imaging systems) and reagents (optical imaging reagents, nuclear imaging reagents, MRI contrast agents, ultrasound contrast agents, and CT contrast agents). The modalities segment is expected to grow at the higher CAGR in the next five years, owing to the extensive application of small animal imaging during preclinical research, high cost of preclinical imaging systems, and development & commercialization of technologically advanced preclinical imaging technologies.
On the basis of geography, small animal imaging market is classified into four regions, namely, North America, Europe, Asia-Pacific, and the Rest of the World. In 2016, market is expected to be dominated by North America owing to factors such as robust R&D infrastructure for life science researches, fast adoption of novel molecular imaging technologies, significant presence of pharmaceutical and biotechnology companies, and increasing preference of end users for multimodality systems.
New product launches and product enhancements are the key growth strategies adopted by major players to develop their positions in the global small animal imaging market. Moreover, strategies such as geographic expansions; and partnerships, agreements, and collaborations; acquisitions were also adopted by a significant number of market players to strengthen their product portfolios and expand their geographic presence in the global market.
As of 2015, PerkinElmer, Inc. (U.S.), Bruker Corporation (U.S.), FUJIFILM Holdings Corporation (Japan), Mediso Ltd. (Hungary), MILabs B.V. (Netherlands), MR Solutions Ltd. (U.K.), Aspect Imaging (Israel), LI-COR Biosciences (U.S.), Trifoil Imaging (U.S.) and Miltenyi Biotec GmbH (Germany) are some key players operating in the global small animal imaging market.
To speak to our analyst for a discussion on the above findings, click Speak to Analyst
 Exclusive indicates content/data unique to MarketsandMarkets and not available with any competitors.
Table of Contents
1 Small Animal Imaging Market: Introduction (Page No. - 16)
1.1 Objectives of the Study
1.2 Market Definition
1.3 Market Scope
1.3.1 Markets Covered
1.3.1.1 Small Animal Imaging Market Segmentation
1.3.1.2 Small Animal Imaging Systems Market Segmentation
1.3.1.3 Small Animal Imaging Reagents Market Segmentation
1.3.2 Geographic Scope
1.3.3 Years Considered for the Study
1.4 Currency
1.5 Limitations
1.6 Stakeholders
2 Small Animal Imaging Market: Research Methodology (Page No. - 21)
2.1 Research Data
2.1.1 Secondary Data
2.1.1.1 Key Data From Secondary Sources
2.1.2 Primary Data
2.1.2.1 Key Data From Primary Sources
2.1.2.2 Breakdown of Primaries
2.2 Market Size Estimation
2.2.1.1 Bottom-Up Approach
2.2.1.2 Top-Down Approach
2.3 Market Breakdown and Data Triangulation
2.4 Research Assumptions & Limitations
2.4.1 Assumptions
3 Small Animal Imaging Market: Executive Summary (Page No. - 30)
3.1 Introduction
3.2 Current Scenario
3.3 Future Outlook
3.4 Conclusion
4 Small Animal Imaging Market: Premium Insights (Page No. - 34)
4.1 Global Market Overview
4.2 Small Animal Imaging Products Market Share, By Region (2016)
4.3 Global Small Animal Imaging Systems Market, By Modality (2016–2021)
4.4 Global Small Animal Imaging Reagents Market, By Type (2016–2021)
4.5 Market, By Region (2016 vs 2021)
5 Small Animal Imaging Market: Overview (Page No. - 39)
5.1 Introduction
5.2 Market Dynamics
5.2.1 Key Market Drivers
5.2.1.1 Technological Advancements in the Field of Molecular Imaging
5.2.1.2 Increasing Market Demand for Noninvasive Small-Animal Imaging Techniques
5.2.1.3 Growing Number of Public-Private Initiatives and Funding to Support Small Animal Researches
5.2.2 Key Market Restraints
5.2.2.1 Strict Regulations Governing Small Animal Research
5.2.2.2 Significant Installation and Operational Costs Associated With Small Animal (In-Vivo) Imaging Modalities
5.2.3 Key Market Opportunity
5.2.3.1 Emerging Markets to Offer New Growth Opportunities
5.2.4 Key Market Challenge
5.2.4.1 Technological and Procedural Limitations Associated With Standalone Small Animal Imaging Systems
6 Industry Insights (Page No. - 46)
6.1 Introduction
6.2 Value Chain Analysis
6.3 Supply Chain Analysis
6.3.1 Key Stakeholders
6.3.2 Key Influencers
6.4 Industry Trends
6.4.1 Ongoing Development of Hybrid and Multi-Modality Small Animal (In-Vivo) Imaging Systems
6.5 Porter’s Five Forces Analysis
6.5.1 Threat of New Entrants
6.5.2 Threat of Substitutes
6.5.3 Bargaining Power of Suppliers
6.5.4 Bargaining Power of Buyers
6.5.5 Intensity of Competitive Rivalry
7 Global Small Animal Imaging Market, By Modality (Page No. - 54)
7.1 Introduction
7.2 Optical Imaging Systems
7.2.1 Bioluminescence/Fluorescence Imaging Systems
7.2.2 Standalone Fluorescence Imaging Systems
7.2.3 (Optical + X-Ray)/(Optical + CT) Systems
7.3 Nuclear Imaging Systems
7.3.1 Micro-Pet Systems
7.3.1.1 Standalone Pet Systems
7.3.1.2 Pet/CT Systems
7.3.1.3 Pet/MRI Systems
7.3.2 Micro-Spect Systems
7.3.2.1 Standalone Spect Systems
7.3.2.2 Spect/CT Systems
7.3.2.3 Spect/MRI Systems
7.3.3 Trimodality (Spect/Pet/CT) Systems
7.4 Micro-MRI
7.5 Micro-Ultrasound
7.6 Micro-CT
7.7 Photoacoustic Imaging Systems
7.8 Magnetic Particle Imaging (MPI) Systems
8 Global Small Animal Imaging Market, By Reagent (Page No. - 73)
8.1 Introduction
8.2 Optical Imaging Reagents
8.2.1 Bioluminescent Imaging Reagents
8.2.1.1 Luciferins
8.2.1.2 Proluciferins
8.2.1.3 Coelenterazine
8.2.1.4 Other Bioluminescent Imaging Reagents
8.2.2 Fluorescent Imaging Reagents
8.2.2.1 Green Fluorescent Proteins
8.2.2.2 Red Fluorescent Proteins
8.2.2.3 Infrared Dyes
8.2.2.4 Other Fluorescent Imaging Reagents
8.3 Nuclear Imaging Reagents
8.3.1 Pet Tracers
8.3.1.1 Fluorine-18-Based Small Animal Pet Tracers
8.3.1.2 Carbon-11-Based Small Animal Pet Tracers
8.3.1.3 Copper-64-Based Small Animal Pet Tracers
8.3.1.4 Other Pet Tracers
8.3.2 Spect Probes
8.3.2.1 Technetium-99m-Based Small Animal Spect Probes
8.3.2.2 Iodine-131-Based Small Animal Spect Probes
8.3.2.3 Gallium-67-Based Small Animal Spect Probes
8.3.2.4 Thallium-201-Based Small Animal Spect Probes
8.3.2.5 Other Spect Probes
8.4 MRI Contrast Agents
8.4.1 Gadolinium-Based Small Animal Contrast Agents
8.4.2 Iron-Based Small Animal Contrast Agents
8.4.3 Manganese-Based Small Animal Contrast Agents
8.5 Ultrasound Contrast Agents
8.6 CT Contrast Agents
8.6.1 Iodine-Based Small Animal CT Contrast Agents
8.6.2 Barium-Based Small Animal CT Contrast Agents
8.6.3 Gold Nanoparticles
8.6.4 Gastrografin-Based Small Animal CT Contrast Agents
9 Small Animal Imaging Market, By Region (Page No. - 105)
9.1 Introduction
9.2 North America
9.3 Europe
9.4 Asia-Pacific
9.5 Rest of the World (RoW)
10 Small Animal Imaging Market: Competitive Landscape (Page No. - 120)
10.1 Overview
10.2 Market Share Analysis, By Key Player, 2015
10.3 Competitive Scenario
10.3.1 New Product Launches
10.3.2 Agreements, Partnerships, and Collaborations
10.3.3 Geographical Expansions
10.3.4 Acquisitions
11 Company Profiles (Page No. - 127)
11.1 Introduction
11.1.1 Geographic Benchmarking
11.2 Perkinelmer, Inc.
11.2.1 Business Overview
11.2.2 Products Offered
11.2.3 Recent Developments (2013-2016)
11.2.4 MnM View
11.3 Bruker Corporation
11.3.1 Business Overview
11.3.2 Products Offered
11.3.3 Recent Developments (2013-2016)
11.3.4 MnM View
11.4 Fujifilm Holdings Corporation
11.4.1 Business Overview
11.4.2 Products Offered
11.4.3 Recent Developments (2013-2016)
11.4.4 MnM View
11.5 Mediso Ltd.
11.5.1 Business Overview
11.5.2 Products Offered
11.5.3 Recent Developments (2013-2016)
11.6 Milabs B.V.
11.6.1 Business Overview
11.6.2 Products Offered
11.6.3 Recent Developments (2013-2016)
11.7 MR Solutions Ltd.
11.7.1 Business Overview
11.7.2 Products Offered
11.7.3 Recent Developments (2013-2016)
11.8 Aspect Imaging Ltd.
11.8.1 Business Overview
11.8.2 Products Offered
11.8.3 Recent Developments (2013-2016)
11.9 Li-Cor Biosciences
11.9.1 Business Overview
11.9.2 Products Offered
11.9.3 Recent Developments (2013-2016)
11.10 Trifoil Imaging
11.10.1 Business Overview
11.10.2 Products Offered
11.10.3 Recent Developments (2013-2016)
11.11 Miltenyi Biotec GmbH
11.11.1 Business Overview
11.11.2 Products Offered
11.11.3 Recent Developments (2013-2016)
12 Appendix (Page No. - 152)
12.1 Insights of Industry Experts
12.2 Discussion Guide
12.3 Knowledge Store: Marketsandmarkets’ Subscription Portal
12.4 Introducing RT: Real-Time Market Intelligence
12.5 Available Customizations
12.6 Related Reports
List of Tables (83 Tables)
Table 1 Small Animal (In-Vivo) Imaging Systems Market Size, By Modality, 2014–2021 (USD Million)
Table 2 Global Optical Imaging Systems Market Size, By Type, 2014–2021 (USD Million)
Table 3 Optical Imaging Systems Market Size, By Region, 2014–2021 (USD Million)
Table 4 Bioluminescence/Fluorescence Imaging Systems Market Size, By Region, 2012–2014 (USD Million)
Table 5 Standalone Fluorescence Imaging Systems Market Size, By Region, 2012–2014 (USD Million)
Table 6 Optical + X-Ray/Optical + CT Imaging Systems Market Size, By Region, 2012–2014 (USD Million)
Table 7 Global Nuclear Imaging Systems Market Size, By Type, 2014–2021 (USD Million)
Table 8 Nuclear Imaging Systems Market Size, By Region, 2014–2021 (USD Million)
Table 9 Global Micro-Pet Systems Market Size, By Type, 2014–2021 (USD Million)
Table 10 Micro-Pet Systems Market Size, By Region, 2014–2021 (USD Million)
Table 11 Standalone Pet Systems Market Size, By Region, 2014–2021 (USD Million)
Table 12 Pet/CT Systems Market Size, By Region, 2014–2021 (USD Million)
Table 13 Pet/MRI Systems Market Size, By Region, 2014–2021 (USD Million)
Table 14 Global Micro-Spect Systems Market Size, By Type, 2014–2021 (USD Million)
Table 15 Micro-Spect Systems Market Size, By Region, 2014–2021 (USD Million)
Table 16 Standalone Spect Systems Market Size, By Region, 2014–2021 (USD Million)
Table 17 Spect/CT Systems Market Size, By Region, 2014–2021 (USD Million)
Table 18 Spect/MRI Systems Market Size, By Region, 2014–2021 (USD Million)
Table 19 Trimodality Systems Market Size, By Region, 2014–2021 (USD Million)
Table 20 Micro-MRI Systems Market Size, By Region, 2014–2021 (USD Million)
Table 21 Micro-Ultrasound Systems Market Size, By Region, 2014–2021 (USD Million)
Table 22 Micro-CT Systems Market Size, By Region, 2014–2021 (USD Million)
Table 23 Photoacoustic Imaging Systems Market Size, By Region, 2014–2021 (USD Million)
Table 24 Magnetic Particle Imaging Systems Market Size, By Region, 2014–2021 (USD Million)
Table 25 Global Small Animal (In-Vivo) Imaging Reagents Market Size, By Type, 2014–2021 (USD Million)
Table 26 Global Optical Imaging Reagents Market Size, By Type, 2014–2021 (USD Million)
Table 27 Optical Imaging Reagents Market Size, By Region, 2014–2021 (USD Million)
Table 28 Global Bioluminescent Imaging Reagents Market Size, By Type, 2014–2021 (USD Million)
Table 29 Bioluminescent Imaging Reagents Market Size, By Region, 2014–2021 (USD Million)
Table 30 Luciferins Market Size, By Region, 2014–2021 (USD Million)
Table 31 Proluciferins Market Size, By Region, 2014–2021 (USD Million)
Table 32 Coelenterazine Market Size, By Region, 2014–2021 (USD Million)
Table 33 Other Bioluminescent Imaging Reagents Market Size, By Region, 2014–2021 (USD Million)
Table 34 Global Fluorescent Imaging Reagents Market Size, By Type, 2014–2021 (USD Million)
Table 35 Fluorescent Imaging Reagents Market Size, By Region, 2014–2021 (USD Million)
Table 36 Green Fluorescent Proteins Market Size, By Region, 2014–2021 (USD Million)
Table 37 Red Fluorescent Proteins Market Size, By Region, 2014–2021 (USD Million)
Table 38 Infrared Dyes Market Size, By Region, 2014–2021 (USD Million)
Table 39 Other Fluorescent Imaging Reagents Market Size, By Region, 2014–2021 (USD Million)
Table 40 Global Nuclear Imaging Reagents Market Size, By Type, 2014–2021 (USD Million)
Table 41 Nuclear Imaging Reagents Market Size, By Region, 2014–2021 (USD Million)
Table 42 Global Pet Tracers Market Size, By Type, 2014–2021 (USD Million)
Table 43 Pet Tracers Market Size, By Region, 2014–2021 (USD Million)
Table 44 Fluorine-18-Based Pet Tracers Market Size, By Region, 2014–2021 (USD Million)
Table 45 Carbon-11-Based Pet Tracers Market Size, By Region, 2014–2021 (USD Million)
Table 46 Copper-64-Based Pet Tracers Market Size, By Region, 2014–2021 (USD Million)
Table 47 Other Pet Tracers Market Size, By Region, 2014–2021 (USD Million)
Table 48 Global Spect Probes Market Size, By Type, 2014–2021 (USD Million)
Table 49 Spect Probes Market Size, By Region, 2014–2021 (USD Million)
Table 50 Technetium-99m-Based Spect Probes Market Size, By Region, 2014–2021 (USD Million)
Table 51 Iodine-131-Based Spect Probes Market Size, By Region, 2014–2021 (USD Million)
Table 52 Gallium-67-Based Spect Probes Market Size, By Region, 2014–2021 (USD Million)
Table 53 Thallium-201-Based Spect Probes Market Size, By Region, 2014–2021 (USD Million)
Table 54 Other Spect Probes Market Size, By Region, 2014–2021 (USD Million)
Table 55 Global MRI Contrast Agents Market Size, By Type, 2014–2021 (USD Million)
Table 56 MRI Contrast Agents Market Size, By Region, 2014–2021 (USD Million)
Table 57 Gadolinium-Based Contrast Agents Market Size, By Region, 2014–2021 (USD Million)
Table 58 Iron-Based Contrast Agents Market Size, By Region, 2014–2021 (USD Million)
Table 59 Manganese-Based Contrast Agents Market Size, By Region, 2014–2021 (USD Million)
Table 60 Ultrasound Contrast Agents Market Size, By Region, 2014–2021 (USD Million)
Table 61 Global CT Contrast Agents Market Size, By Type, 2014–2021 (USD Million)
Table 62 CT Contrast Agents Market Size, By Region, 2014–2021 (USD Million)
Table 63 Iodine-Based CT Contrast Agents Market Size, By Region, 2014–2021 (USD Million)
Table 64 Barium-Based CT Contrast Agents Market Size, By Region, 2014–2021 (USD Million)
Table 65 Gold Nanoparticles Market Size, By Region, 2014–2021 (USD Million)
Table 66 Gastrografin-Based CT Contrast Agents Market Size, By Region, 2014–2021 (USD Million)
Table 67 Global Imaging Systems and Reagents Market Size, By Region, 2014–2021 (USD Million)
Table 68 North America: Small Animal Imaging Market Size, By Product, 2014–2021 (USD Million)
Table 69 North America: Small Animal (In-Vivo) Imaging Systems Market Size, By Modality, 2014–2021 (USD Million)
Table 70 North America: Small Animal (In-Vivo) Imaging Reagents Market Size, By Type, 2014-2021 (USD Million)
Table 71 Europe: Small Animal Imaging Market Size, By Product, 2014–2021 (USD Million)
Table 72 Europe: Small Animal (In-Vivo) Imaging Systems Market Size, By Modality, 2014–2021 (USD Million)
Table 73 Europe: Small Animal (In-Vivo) Imaging Reagents Market Size, By Type, 2014–2021 (USD Million)
Table 74 Asia-Pacific: Small Animal Imaging Market Size, By Product, 2014–2021 (USD Million)
Table 75 Asia-Pacific: Small Animal (In-Vivo) Imaging Systems Market Size, By Modality, 2014-2021 (USD Million)
Table 76 Asia-Pacific: Small Animal (In-Vivo) Imaging Reagents Market Size, By Type, 2014–2021 (USD Million)
Table 77 RoW: Small Animal Imaging Market Size, By Product, 2014–2021 (USD Million)
Table 78 RoW: Small Animal (In-Vivo) Imaging Systems Market Size, By Modality, 2014-2021 (USD Million)
Table 79 RoW: Small Animal (In-Vivo) Imaging Reagents Market Size, By Type, 2014–2021 (USD Million)
Table 80 Top New Product Launches, 2013–2016
Table 81 Top Agreements, Partnerships, and Collaborations, 2013–2016
Table 82 Top Geographical Expansions, 2013–2016
Table 83 Top Acquisitions, 2013–2016
List of Figures (39 Figures)
Figure 1 Research Design
Figure 2 Breakdown of Supply-Side Primary Interviews: By Company Type, Designation, and Region
Figure 3 Small Animal (In-Vivo) Imaging Systems Market: Bottom-Up Approach
Figure 4 Small Animal (In-Vivo) Imaging Systems Market: Top-Down Approach
Figure 5 Small Animal (In-Vivo) Imaging Reagents Market: Top-Down Approach
Figure 6 Small Animal Imaging Market: Data Triangulation
Figure 7 Global Small Animal Imaging Systems Market, By Modality, 2016 vs 2021 (USD Million)
Figure 8 Global Small Animal (In-Vivo) Imaging Reagents Market, By Type, 2016 vs 2021 (USD Million)
Figure 9 Global Market, By Region, 2016 (USD Million)
Figure 10 Technological Advancements in Molecular Imaging and Increasing Demand for Noninvasive Techniques—Key Market Drivers
Figure 11 North America is Expected to Dominate the Small Animal Imaging Market in 2016
Figure 12 Optical Imaging, Nuclear Imaging, and Micro-MRI Systems to Dominate the Small Animal (In-Vivo) Imaging Systems Market Till 2021
Figure 13 Optical Imaging and Nuclear Imaging Reagents to Dominate the Small Animal (In-Vivo) Imaging Reagents Market Till 2021
Figure 14 North America to Command the Largest Share of the Market in 2016
Figure 15 Technological Advancements & Emerging Application Segments to Drive the Growth of the Small Animal Imaging Market Till 2021
Figure 16 Healthcare Expenditure Across Major Countries, 2000–2013
Figure 17 Majority of Product Value of Small Animal (In-Vivo) Imaging Systems is Added During the Manufacturing and Assembly Phase
Figure 18 Market Players Prefer Both Direct & Indirect Distribution Strategies
Figure 19 Porter’s Five Forces Analysis: Small Animal Imaging Market (2015)
Figure 20 Optical Imaging Systems to Dominate Small Animal Imaging Systems Market Till 2021
Figure 21 Optical Imaging Systems Market, By Type
Figure 22 Nuclear Imaging Systems Market, By Type
Figure 23 Small Animal (In-Vivo) Imaging Reagents Market, By Type
Figure 24 Optical Imaging Reagents Market, By Type, 2016 vs 2021 (USD Million)
Figure 25 Nuclear Imaging Reagents Market, By Type, 2016 vs 2021 (USD Million)
Figure 26 MRI Contrast Agents Market, By Type, 2016 vs 2021 (USD Million)
Figure 27 CT Contrast Agents Market, By Type, 2016 vs 2021 (USD Million)
Figure 28 Asia-Pacific to Be the Fastest-Growing Region in Global Small Animal Imaging Market Till 2021
Figure 29 North America: Market Snapshot (2016-2021)
Figure 30 Europe: Market Snapshot (2016-2021)
Figure 31 Asia-Pacific: Market Snapshot (2016-2021)
Figure 32 RoW: Market Snapshot (2016-2021)
Figure 33 New Product Launches: Key Growth Strategy Adopted By Majority of Market Players (2013-2016)
Figure 34 Global Market Share, By Key Player (2015)
Figure 35 Increasing Number of New Products Launched is Stimulating the Market Growth
Figure 36 Geographic Revenue Mix of the Top 3 Market Players (2015)
Figure 37 Perkinelmer, Inc.: Company Snapshot
Figure 38 Bruker Corporation: Company Snapshot
Figure 39 Fujifilm Holdings Corporation: Company Snapshot

 Generating Response ...


Growth opportunities and latent adjacency in Small Animal Imaging (In-Vivo) Market