Signal Generator Market by Product, Technology, Applications, End Users (Telecommunication, Electronics Manufacturing, Industrial, Aerospace & Defense, Automotive, Education, and Medical), and by Geography - Global Forecast to 2015 - 2020


The signal generator market major end user verticals are telecommunication, electronics manufacturing, and aerospace & defense. The global signal generator market is expected to grow from USD 754.6 Million in 2014 to USD 1222.8 Million in 2020, at a CAGR of 8.23% during the forecast period (2015-2020).
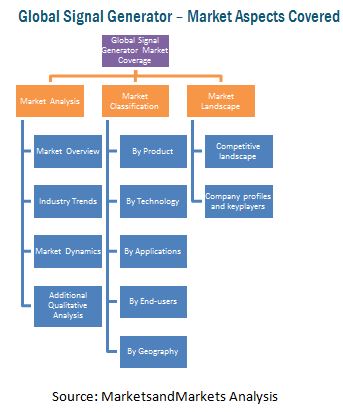
Three major aspects of the complete global signal generator market are covered in this report. Market overview and industry trends, along with market dynamics and additional qualitative analysis account for market analysis. Market Classification encompasses segmentation & sub-segmentation of the market by product, technology, application, end-user, and geography. Lastly, the current market is covered with a detailed competitive landscape and company profiles of all key players across the ecosystem.
This report will cater to the needs of leading manufacturers, suppliers, and service providers in the global signal generator market. Other parties that could benefit from the report include research organizations, educational institutes, consulting firms, business development executives, C-level employees and VPs. Our report will help you analyze new opportunities and potential revenue sources and enhance your decision making process for new business strategies. The quantitative and qualitative information in the report along with our comprehensive analysis will help you stay competitively ahead in the market.
A signal generator is a device that generates repeating or non-repeating electronic signals and waveforms. It provides stimulation to electronics testing and measurement systems as well as in processing circuits. It is used in test setups, various design and manufacturing stages as well as in troubleshooting.
The report segments the global signal generator market based on product (general-purpose, special-purpose, function generator), technology (2G, 3G, 3.5G to 4G), applications (designing, testing, manufacturing, certification, troubleshooting, repairing), end-users (telecommunication, electronics manufacturing, industrial, aerospace & defense, automotive, education and medical sector), geography (North America, Europe, APAC, RoW). Further, it contains market size estimation, and analyses trends in the market. The sections and sub-segments in the report contain drivers, restraints, opportunities, key challenges, and critical success factors to succeed in the global signal generator market. It covers the future of the global market & industry from both - technical and market-oriented perspectives with techno-market oriented roadmaps till 2020, a detailed competitive landscape with identification of key players with respect to each type of market, and market ratings.
The growth of global signal generator market is propelled by drivers such as the use of the signal generator in modern communication system environments. The signal generator equipment is used to generate real-time versions of complex signals existing in the real world. Furthermore, the increase in the manufacturing operations in Asia-Pacific region has resulted in increasing demand for test equipment including signal generators in the region thus acting as a driver for the market.
Some of the companies involved in the market are Keysight Technologies Inc. (U.S.), Rohde & Schwarz Gmbh & Co Kg (Germany), National Instruments Corporation (U.S.), Anritsu Corporation (Japan), Tektronix Inc. (U.S.), Teledyne Technologies Incorporated (U.S.), B&K Precision Corporation (U.S.), and Keithley Instruments Inc. (U.S.).
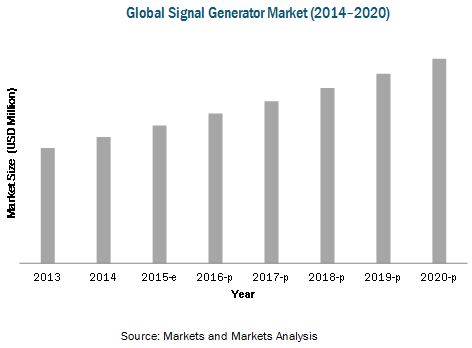
The global signal generator market is expected to grow at a CAGR of 8.23% from 2015 to 2020. Telecommunication is the major end user in the signal generator market, followed by electronics manufacturing. In telecommunication sector, signal generators are used for short as well as long-haul communications. As per the geographic analysis, North America is the market leader. The APAC region is expected to grow the fastest during the forecast period.
 Exclusive indicates content/data unique to MarketsandMarkets and not available with any competitors.
Table of Contents
1 Introduction (Page No. - 15)
1.1 Objectives of the Study
1.2 Market Definition
1.3 Study Scope
1.3.1 Markets Covered
1.3.2 Geographic Scope
1.3.3 Years Considered for the Study
1.4 Currency & Pricing
1.5 Limitations
1.6 Stakeholders
2 Research Methodology (Page No. - 19)
2.1 Research Data
2.1.1 Secondary Data
2.1.1.1 Key Data From Secondary Sources
2.1.2 Primary Data
2.1.2.1 Key Data From Primary Sources
2.1.2.2 Key Industry Insights
2.1.2.3 Breakdown of Primary Interviews
2.2 Market Size Estimation
2.2.1 Bottom-Up Approach
2.2.2 Top-Down Approach
2.3 Market Breakdown & Data Triangulation
2.4 Research Assumptions
3 Executive Summary (Page No. - 28)
4 Premium Insights (Page No. - 34)
4.1 Attractive Market Opportunity in the Signal Generator Market
4.2 Signal Generator Hardware Market – Top 3 Applications
4.3 Signal Generator Hardware Market in Different Regions
4.4 Global Growth Map
4.5 Signal Generator Hardware Market, By End–User Vertical
4.6 Signal Generator Hardware Market, By Geography
4.7 Signal Generator Regional Hardware Market, By Product
5 Market Overview (Page No. - 39)
5.1 Introduction
5.2 Evolution
5.3 Market Segmentation
5.3.1 Signal Generator Market, By Technology
5.3.2 Market, By Product
5.3.3 Market, By Application
5.3.4 Market, By End User
5.3.5 Market, By Geography
5.4 Market Dynamics
5.4.1 Drivers
5.4.1.1 Modern Communication Systems Driving the Signal Generator Market
5.4.1.2 Latent Signal Generator Market in the Asia-Pacific Region
5.4.1.3 Increased Demand for Signal Generators in Aerospace & Defense
5.4.1.4 Increasing Demand for Arbitrary Waveform Generators
5.4.2 Restraints
5.4.2.1 Intense Competition Causing Pricing Pressure
5.4.2.2 High Import Duty and Taxes on Imported Raw Materials
5.4.3 Opportunities
5.4.3.1 Interdisciplinary Use of Technology
5.4.3.2 Human Machine Interface
5.4.4 Challenges
5.4.4.1 Keeping Up With the Constantly Changing Technologies
5.4.5 Burning Issues
5.4.5.1 Improving Technological Awareness & Educating Users on Signal Generators
6 Industry Trends (Page No. - 50)
6.1 Introduction
6.2 Value Chain Analysis
6.3 Key Influencers
6.4 Porter’s Five Forces Analysis
6.4.1 Intensity of Rivalry
6.4.2 Threat of Substitutes
6.4.3 Bargaining Power of Buyers
6.4.4 Bargaining Power of Suppliers
6.4.5 Threat of New Entrants
6.5 Key Trends
6.5.1 Need for Complex Signal Generation
6.5.2 Shift Towards Smart Devices and Connectivity
7 Hardware Market, By Technology (Page No. - 59)
7.1 Introduction
7.2 2G
7.2.1 GSM
7.2.2 CDMA
7.3 3G
7.3.1 WDCMA
7.3.2 CDMA2000
7.4 3.5G–4G
7.4.1 3GPP Lte
7.4.2 Wimax
8 Hardware Market, By Product (Page No. - 67)
8.1 Introduction
8.2 General Purpose Signal Generator
8.2.1 Arbitrary Waveform Generator
8.2.2 Rf Generator
8.2.3 Microwave Generator
8.3 Special Purpose Signal Generator
8.3.1 Video Signal Generator
8.3.2 Audio Signal Generator
8.3.3 Pitch Generator
8.4 Function Generator
8.4.1 Analog Function Generator
8.4.2 Digital Function Generator
8.4.3 Sweep Function Generator
9 Hardware Market, By Application (Page No. - 81)
9.1 Introduction
9.2 Designing
9.3 Testing
9.4 Certification
9.5 Manufacturing
9.6 Trouble Shooting
9.7 Repairing
10 Hardware Market, By End User (Page No. - 93)
10.1 Introduction
10.2 Telecommunication
10.3 Electronics Manufacturing
10.4 Industrial
10.5 Aerospace & Defense
10.6 Automotive
10.7 Education
10.8 Medical
11 Hardware Market, By Geography (Page No. - 107)
11.1 Introduction
11.2 North America
11.3 Europe
11.4 APAC
11.5 RoW
12 Competitive Landscape (Page No. - 126)
12.1 Overview
12.2 Market Ratings, Signal Market
12.3 Competitive Situation and Trends
12.3.1 New Product Launches/ New Product Developments
12.3.2 Mergers and Acquisitions
12.3.3 Expansions
12.3.4 Agreements, Partnerships, and Collaborations
12.3.5 Other Developments
13 Company Profiles (Page No. - 135)
(Overview, Products and Services, Financials, Strategy & Development)*
13.1 Introduction
13.2 Keysight Technologies Inc.
13.3 Rohde & Schwarz GmbH & Co Kg
13.4 National Instruments Corporation
13.5 Anritsu Corporation
13.6 Tektronix Inc
13.7 Teledyne Technologies Incorporated
13.8 B&K Precision Corporation
13.9 Keithley Instruments Inc.
13.10 Leader Electronics Corp
13.11 Vaunix Technology Corporation
*Details on Overview, Products and Services, Financials, Strategy & Development Might Not Be Captured in Case of Unlisted Companies.
14 Appendix (Page No. - 162)
14.1 Insights of Industry Experts
14.2 Discussion Guide
14.3 Introducing RT: Real-Time Market Intelligence
14.4 Available Customizations
14.5 Related Reports
List of Tables (76 Tables)
Table 1 Global Signal Generator Market Size, By Revenue Source, 2013–2020 (USD Million)
Table 2 The Rise in Modern Communication Systems
Table 3 Intense Competition Causing Pricing Pressure
Table 4 Interdisciplinary Use of Technology
Table 5 Keeping Up With Constantly Changing Technologies
Table 6 Signal Generator Hardware Market Size, By Technology, 2013–2020 (USD Million)
Table 7 Signal Generator Hardware Market Size, By Technology Type, 2013–2020 (USD Million)
Table 8 2G Technology Market Size, By Technology Type, 2013–2020 (USD Million)
Table 9 3G Technology Market Size, By Technology Type, 2013–2020 (USD Million)
Table 10 3.5G–4G Technology Market Size, By Technology Type, 2013–2020 (USD Million)
Table 11 Signal Generator Hardware Market Size, By Product, 2013–2020 (USD Million)
Table 12 Signal Generator Hardware Market Size, By Product Type, 2013–2020 (USD Million)
Table 13 General Purpose Signal Generator Hardware Market Size, By Application, 2013–2020 (USD Million)
Table 14 General Purpose Signal Generator Hardware Market Size, By End User, 2013–2020 (USD Million)
Table 15 General Purpose Signal Generator Hardware Market Size, By Region, 2013–2020 (USD Million)
Table 16 General Purpose Signal Generator Hardware Market Size, By Type, 2013–2020 (USD Million)
Table 17 Special Purpose Signal Generator Hardware Market Size, By Application, 2013–2020 (USD Million)
Table 18 Special Purpose Signal Generator Hardware Market Size, By End User, 2013–2020 (USD Million)
Table 19 Special Purpose Signal Generator Hardware Market Size, By Region, 2013–2020 (USD Million)
Table 20 Special Purpose Signal Generator Hardware Market Size, By Type, 2013–2020 (USD Million)
Table 21 Function Generator Hardware Market Size, By Application, 2013–2020 (USD Million)
Table 22 Function Generator Hardware Market Size, By End User, 2013–2020 (USD Million)
Table 23 Function Generator Hardware Market Size, By Region, 2013–2020 (USD Million)
Table 24 Function Generator Hardware Market Size, By Type, 2013–2020 (USD Million)
Table 25 Signal Generator Hardware Market Size, By Application, 2013–2020 (USD Million)
Table 26 Designing: Market Size, By Product, 2013–2020 (USD Million)
Table 27 Designing: Market Size, By Geography, 2013–2020 (USD Million)
Table 28 Testing: Market Size, By Product, 2013–2020 (USD Million)
Table 29 Testing: Market Size, By Geography, 2013–2020 (USD Million)
Table 30 Certification: Market Size, By Product, 2013–2020 (USD Million)
Table 31 Certification: Market Size, By Geography, 2013–2020 (USD Million)
Table 32 Manufacturing: Market Size, By Product, 2013–2020 (USD Million)
Table 33 Manufacturing: Market Size, By Geography, 2013–2020 (USD Million)
Table 34 Trouble Shooting: Market Size, By Product, 2013–2020 (USD Million)
Table 35 Trouble Shooting: Market Size, By Geography, 2013–2020 (USD Million)
Table 36 Repairing: Market Size, By Product, 2013–2020 (USD Million)
Table 37 Repairing: Market Size, By Geography, 2013–2020 (USD Million)
Table 38 Signal Generator Hardware Market Size, By End User, 2013–2020 (USD Million)
Table 39 Telecommunication Market Size, By Product, 2013–2020 (USD Million)
Table 40 Telecommunication Market Size, By Region, 2013–2020 (USD Million)
Table 41 Electronics Manufacturing Market Size, By Product, 2013–2020 (USD Million)
Table 42 Electronics Manufacturing: Market Size, By Region, 2013–2020 (USD Million)
Table 43 Industrial Market Size, By Product, 2013–2020 (USD Million)
Table 44 Industrial Market Size, By Region, 2013–2020 (USD Million)
Table 45 Aerospace & Defense Market Size, By Product, 2013–2020 (USD Million)
Table 46 Aerospace & Defense Market Size, By Region, 2013–2020 (USD Million)
Table 47 Automotive Market Size, By Product, 2013–2020 (USD Million)
Table 48 Automotive Market Size, By Region, 2013–2020 (USD Million)
Table 49 Education Market Size, By Product, 2013–2020 (USD Million)
Table 50 Education Market Size, By Region, 2013–2020 (USD Million)
Table 51 Medical Market Size, By Product, 2013–2020 (USD Million)
Table 52 Medical Market Size, By Region, 2013–2020 (USD Million)
Table 53 Signal Generator Hardware Market Size, By Region, 2013–2020 (USD Million)
Table 54 North America: Signal Generator Hardware Market Size, By Product, 2013–2020 (USD Million)
Table 55 North America: Signal Generator Hardware Market Size, By Application, 2013–2020 (USD Million)
Table 56 North America: Signal Generator Hardware Market Size, By End User, 2013–2020 (USD Million)
Table 57 North America: Signal Generator Hardware Market Size, By Country, 2013–2020 (USD Million)
Table 58 Europe: Signal Generator Hardware Market Size, By Product, 2013–2020 (USD Million)
Table 59 Europe: Signal Generator Hardware Market Size, By Application, 2013–2020 (USD Million)
Table 60 Europe: Signal Generator Hardware Market Size, By End User, 2013–2020 (USD Million)
Table 61 Europe: Signal Generator Hardware Market Size, By Country, 2013–2020 (USD Million)
Table 62 APAC: Signal Generator Hardware Market Size, By Product, 2013–2020 (USD Million)
Table 63 APAC: Signal Generator Hardware Market Size, By Application, 2013–2020 (USD Million)
Table 64 APAC: Signal Generator Hardware Market Size, By End User, 2013–2020 (USD Million)
Table 65 APAC: Signal Generator Hardware Market Size, By Country, 2013–2020 (USD Million)
Table 66 RoW: Signal Generator Hardware Market Size, By Product, 2013–2020 (USD Million)
Table 67 RoW: Signal Generator Hardware Market Size, By Application, 2013–2020 (USD Million)
Table 68 RoW: Signal Generator Hardware Market Size, By End User, 2013–2020 (USD Million)
Table 69 RoW: Signal Generator Hardware Market Size, By Region, 2013–2020 (USD Million)
Table 70 Signal Generator Market : Key Player Rating Analysis, 2014
Table 71 Signal Generator : Market Rating, By Key Player, 2014
Table 72 New Product Launches/New Product Developments, 2011–2015
Table 73 Mergers and Acquisitions, 2011–2015
Table 74 Expansions, 2011–2015
Table 75 Agreements, Partnerships, and Collaborations, 2011–2015
Table 76 Other Developments, 2011–2014
List of Figures (82 Figures)
Figure 1 Signal Generator Market Segmentation
Figure 2 Global Signal Generator Market, By Geography
Figure 3 Research Design
Figure 4 Research Flow
Figure 5 Bottom-Up Approach
Figure 6 Top-Down Approach
Figure 7 Assumptions of the Research Study
Figure 8 Signal Generator Market Expected to Maintain Its Steady Growth During the Forecast Period
Figure 9 2G to Dominate the Signal Generator Hardware Market During the Forecast Period
Figure 10 Designing Application to Dominate the Signal Generator Hardware Market During the Forecast Period
Figure 11 Medical End User Segment has A High Potential for Signal Generator
Figure 12 Global Signal Generator Hardware Market Share, By Region, 2014
Figure 13 Growth of Communication Technology Expected to Offer Attractive Market Opportunity for the Signal Generator Market
Figure 14 Designing Application Held the Largest Share in the Signal Generator Hardware Market in 2014
Figure 15 North America Holds the Largest Share in the Signal Generator Hardware Market
Figure 16 APAC Would Witness the Highest Growth in the Signal Generator Hardware Market During the Forecast Period
Figure 17 Telecommunication to Dominate the Signal Generator Hardware Market During the Forecast Period
Figure 18 The APAC Region Expected to Witness Highest Growth During the Forecast Period
Figure 19 General Purpose Signal Generator Expected to Dominate the Market During the Forecast Period
Figure 20 Evolution of Signal Generator
Figure 21 Signal Generator Market Segmentation, By Technology
Figure 22 Signal Generator Market Segmentation, By Product
Figure 23 Signal Generator Market Segmentation, By Application Area
Figure 24 Signal Generator Market Segmentation, By End User
Figure 25 Signal Generator Market Segmentation, By Geography
Figure 26 Growth of Signal Generator Market in Asia-Pacific
Figure 27 Value Chain Analysis: Major Value Added in the Manufacturing and Assembly Phase of Signal Generator
Figure 28 Porter’s Five Forces Analysis
Figure 29 Intensity of Rivalry
Figure 30 Threat of Substitutes
Figure 31 Bargaining Power of Buyers
Figure 32 Bargaining Power of Suppliers
Figure 33 Threat of New Entrants
Figure 34 3.5G–4G Technology Expected to Grow at the Fastest Rate During the Forecast Period
Figure 35 GSM Expected to Dominate the 2G Technology Market During the Forecast Period
Figure 36 WCDMA Expected to Dominate the 3G Technology Market During the Forecast Period
Figure 37 3GPP LTE Expected to Dominate the 3.5G–4G Technology Market During the Forecast Period
Figure 38 General Purpose Signal Generator Expected to Dominate the Signal Generator Hardware Market During the Forecast Period
Figure 39 Designing Expected to Dominate the General Purpose Signal Generator Hardware Market During the Forecast Period
Figure 40 General Purpose Signal Generator Hardware Market in APAC is Expected to Grow at the Fastest Rate During the Forecast Period
Figure 41 Designing Expected to Dominate the Special Purpose Signal Generator Hardware Market During the Forecast Period
Figure 42 Pitch Generator Market Expected to Grow at the Fastest Rate During the Forecast Period
Figure 43 Certification Application in the Function Generator Hardware Market Expected to Grow at the Fastest Rate During the Forecast Period
Figure 44 Function Generator Hardware Market in APAC Expected to Grow at the Fastest Rate in During the Forecast Period
Figure 45 Designing Application to Dominate the Signal Generator Hardware Market During the Forecast Period
Figure 46 North America Dominated the Designing Application Market in 2014
Figure 47 APAC to Dominate the Testing Application During the Forecast Period
Figure 48 APAC to Grow Fastest in the Certification Market During the Forecast Period
Figure 49 North America Dominated the Manufacturing Application Market in 2014
Figure 50 APAC to Grow Fastest in the Troubleshooting Application During the Forecast Period
Figure 51 APAC to Grow Fastest in the Repairing Application During the Forecast Period
Figure 52 Telecommunication Vertical Expected to Dominate the Signal Generator Hardware Market During the Forecast Period
Figure 53 The APAC Hardware Market for the Telecommunication Sector Expected to Grow at the Fastest Rate During the Forecast Period
Figure 54 APAC Expected to Lead the Electronics Manufacturing Vertical of Signal Generator Hardware Market During the Forecast Period
Figure 55 APAC Signal Generator Hardware Market of the Industrial Vertical Expected to Grow at the Fastest Rate During the Forecast Period
Figure 56 North America Would Lead the Aerospace & Defense Vertical of the Signal Generator Hardware Market During the Forecast Period
Figure 57 APAC Expected to Lead the Automotive Vertical of the Signal Generator Hardware Market During the Forecast Period
Figure 58 North America Would Lead the Education Vertical of the Signal Generator Hardware Market During the Forecast Period
Figure 59 APAC Signal Generator Hardware Market in the Medical Vertical Expected to Grow at the Fastest Rate During the Forecast Period
Figure 60 Geographic Snapshot: APAC Expected to Grow at the Fastest Rate During the Forecast Period
Figure 61 Snapshot of the North American Market: Demand for Signal Generators Expected to Be Driven By the Telecommunication and Aerospace & Defense Sectors During the Forecast Period
Figure 62 North America: The Hardware Market in the Telecommunication Sector Expected to Lead During the Forecast Period
Figure 63 Snapshot of the European Market: Need for High-End and High-Precision Signal Generators Expected to Drive the European Signal Generator Market
Figure 64 Europe: the Market in the Telecommunication Sector Expected to Lead During the Forecast Period
Figure 65 Snapshot of the APAC Market: Increasing Manufacturing Activities Expected to Drive the APAC Signal Generator Market
Figure 66 APAC: the Application in the Electronics Manufacturing Sector to Lead the Signal Generator Hardware Market During the Forecast Period
Figure 67 Snapshot of the RoW Market: Deployment of New Communication Standards Driving the Demand for Signal Generators
Figure 68 RoW: the Application in the Electronics Manufacturing Sector to Lead the Signal Generator Hardware Market During the Forecast Period
Figure 69 Companies Adopted Acquisitions and Alliances/ Collaborations/ Joint Ventures as Key Growth Strategies During 2011-2015
Figure 70 National Instruments Corporation Grew at the Fastest Rate Between 2011 and 2014
Figure 71 Battle for Market Share: New Product Launches/New Product Developments Were the Key Strategies During 2011-2015
Figure 72 Geographic Revenue Mix of Key Market Players
Figure 73 Keysight Technologies Inc.: Company Snapshot
Figure 74 Keysight Technologies Inc.: SWOT Analysis
Figure 75 Rohde & Schwarz GmbH & Co Kg: Company Snapshot
Figure 76 Rohde & Schwarz GmbH & Co Kg : SWOT Analysis
Figure 77 National Instruments Corporation: Company Snapshot
Figure 78 National Instruments Corporation : SWOT Analysis
Figure 79 Anritsu Corporation: Company Snapshot
Figure 80 Anritsu Corporation: SWOT Analysis
Figure 81 Teledyne Technologies Incorporated : Company Snapshot
Figure 82 Teledyne Technologies Incorporated: SWOT Analysis
Market Segments and Aspects Covered:
Market by Product:
The global signal generator market based on the product type, is segmented into general purpose, special purpose and function generator
Market by Technology:
The global signal generator is segmented based on use in technologies as, 2G, 3G, 3.5G and 4G.
Market by Applications
The global signal generator market is segmented based on applications such as designing, testing, manufacturing, certification, troubleshooting, and repairing.
Market by End-users
The global signal generator market is segmented based on end-users, viz., telecommunication, electronics manufacturing, industrial, aerospace & defense, automotive, education and medical sector
Market by geography
The global signal generator market is segmented based on geography into four different regions, namely, North America (the U.S., Canada, and Mexico), Europe (Germany, the U.K., France, and Others), APAC (China, India, Japan, and Others), and the Rest of the World (the Middle East, South and Central America, and Africa).
Some of the companies involved in the market include Keysight Technologies Inc. (U.S.), Rohde & Schwarz Gmbh & Co Kg (Germany), National Instruments Corporation (U.S.), Anritsu Corporation (Japan), Tektronix Inc. (U.S.), Teledyne Technologies Incorporated (U.S.), B&K Precision Corporation (U.S.), and Keithley Instruments Inc. (U.S.).
The following customization options are available for the global signal generator market report.
Product Analysis
- Product Matrix which gives a detailed comparison of product portfolio of top companies
Company Information
- Detailed analysis and profiling of additional market players (Up to 5).


Growth opportunities and latent adjacency in Signal Generator Market