Shunt Reactor Market by Type (Oil-Immersed and Air-Core), Application (Variable Reactors and Fixed Reactors), End-User (Electrical Utilities and Industrial Verticals), and Region (North America, Europe, Asia Pacific, and South America) - Global Forecast to 2022


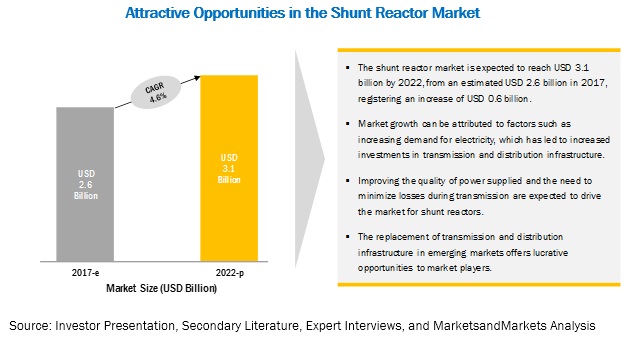
[141 Pages Report] The shunt reactor market is estimated to reach USD 2.6 billion in 2017 and is projected to reach USD 3.1 billion by 2022, at a CAGR of 4.6% from 2017 to 2022. The increasing demand for electricity, upgrading of the aging technology in developing countries, and the addition of high voltage transmission lines are the driving factors for the shunt reactor market. Developing nations are currently increasing their power generation capacity to satisfy the growing energy demands. Industrialization and urbanization are being majorly seen in the Asia Pacific region, which houses two of the fastest growing economies in the world, India and China. The growing focus toward grid reliability and energy loss minimization during transmission led to the introduction and development of alternative technologies such as FACTS (Flexible AC Transmission System) and HVDC systems act as restraints for the shunt reactor market.
The oil-immersed type segment is expected to grow at the highest CAGR from 2017 to 2022
Oil-immersed reactors are expected to be the largest market during the forecast period. The increase in the demand for electricity and rising investments in the T&D infrastructure leads to the addition of high voltage transmission lines to meet the demand for electricity. Thus, with an increase in the T&D infrastructure, the demand for oil-immersed reactors is expected to increase.
The electric utilities end-user segment is expected to be the largest market during the forecast period
The electric utilities end-users segment is projected to have the largest market during the forecast period. The demand for electricity is increasing as various developing nations are engaged in expanding their power generation capacity to provide electricity. The process of industrialization demands the ever-growing need for electricity. The countries are going to renewable energy sources such building power plants to cater the demand for electricity. This would also lead to rising investments toward strengthening the grid along with supporting infrastructures such as transformers and reactors. As the demand for electricity rises, the electric utilities would require more reactors.
Asia Pacific is expected to grow at the highest CAGR from 2017 to 2022
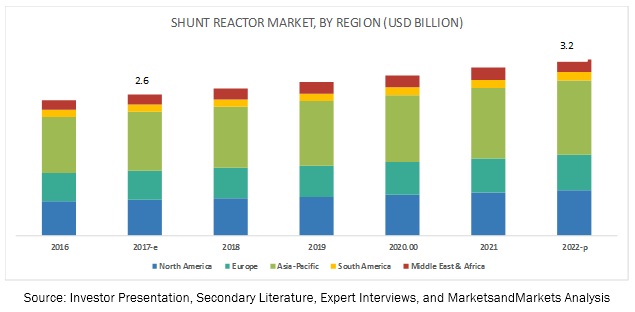
The Asia Pacific region is currently the largest market for shunt reactors, followed by North America and Europe. China accounted for a majority share in Asia Pacific in 2014 and is projected to grow at the highest CAGR from 2017 to 2022. The increasing demand for shunt reactors in Asia Pacific is due to the growing investments in utilities, which would result in improved grid reliability. The addition of high voltage transmission network and rising investments in renewable sources are likely to attribute the growth of the shunt reactor market in the Asia Pacific region.
Market Dynamics
Driver: Upgradation of aging technology in developed nations
The existing transmission and distribution networks utilized in most of the developed nations rely on aging infrastructure and outdated technologies that struggle to meet the current and future growing demand. In the US and European countries such as the UK and Germany, approximately 70% of the transformers and transmission networks are over 25 years old and are reaching the end of their life. The dual trends of long-term under-investments in the T&D infrastructure and increasing demand for the reliable delivery of power have increased pressure on the grid, making it highly vulnerable. Thus, to avoid power outages or grid breakdown, a significant investment is required for upgrading the aging T&D grid including shunt reactors. As the energy requirements increase, the need for the supporting infrastructure also increases. In the last five years, Europe and North America have been engaged in modernizing their transmission grids for efficient supply of electricity. A considerable investment has also been made by Japan to strengthen and upgrade its power transmission infrastructure networks. Electric utilities would invest USD 3.2 trillion globally in the new and replacement transmission and distribution infrastructure, according to the T&D world magazine. This investment in infrastructure would be necessary due to growing electricity demand, aging assets, and new power generation projects, including intermittent renewable resources that are straining the grid. Thus, investments in the transmission and distribution infrastructure would see a significant growth in the shunt reactor market.
Restraint: Development of alternate technologies
Growing focus toward grid reliability and energy loss minimization during transmission, led to the introduction and development of alternate technologies such as FACTS (Flexible AC Transmission System), HVDC systems, and so on. Conventional methods of grid stabilization (using devices such as capacitors) have their own imbibed limitations in terms of effective performance and speed and are gradually paving the way for more efficient technologies such as FACTS and HVDC systems.
Opportunity: Adopting smart grid technology
Smart grid is an advanced technology that has smart devices in the circuits that enable remote monitoring of the normal operation. Power systems involve the transportation of billions of GW of power over thousands of kilometers, so the need for smart equipment is necessary for proper monitoring and timely fault correction. Variable shunt reactors provide regulation capability and, thereby, system benefits in terms of power quality, optimized grid operation, and the possibility of interacting with other regulating devices. Investments in smart grid technologies are increasing mostly in the developed countries which are entering the new era of power supply and load management. The smart grid technology provides an opportunity to variable shunt reactors. The variable shunt reactors in the smart grid would not only ensure proper flow of active power but would balance the reactive power too. Thus, smart grid technology adoption will provide opportunity to shunt reactor to increase market size
Scope of the Report
|
Report Metric |
Details |
|
Market size available for years |
2016�2022 |
|
Base year considered |
2016 |
|
Forecast period |
2017�2022 |
|
Forecast units |
Billion (USD) |
|
Segments covered |
By Type (Oil-Immersed and Air-Core), Application (Variable Reactors and Fixed Reactors), End-User (Electrical Utilities and Industrial Verticals), and Region |
|
Geographies covered |
North America, Europe, Asia-Pacific, South America, Africa, Middle East |
|
Companies covered |
ABB (Switzerland), Siemens (Germany), Crompton Greaves (India), General Electric (US), Zaporozhtransformator (Ukraine), Fuji Electric (Japan), Toshiba (Japan), Mitsubishi (Japan), and Nissin Electric (Japan). |
The research report categorizes the offshore support vessel to forecast the revenues and analyze the trends in each of the following sub-segments:
Shunt Reactor Market By Type
- Oil-Immersed
- Air-Core
Shunt Reactor Market By End Users
- Electric Utilities
- Industrial Verticals
Shunt Reactor Market By Application
- Variable Reactors
- Fixed Reactors
Shunt Reactor Market By Region
- Asia-Pacific
- North America
- South America
- Europe
- Middle East & Africa
Key Market Players
ABB (Switzerland), Siemens (Germany), Crompton Greaves (India), General Electric (US), Zaporozhtransformator (Ukraine), Fuji Electric (Japan), Toshiba (Japan), Mitsubishi (Japan), and Nissin Electric (Japan
ABB, one of the leading players, which engages in the development and provision of power and automation technologies. It is considered one of the leading players providing shunt reactor. The company has a balanced regional footprint in production and R&D and is present in over 100 countries, with holding subsidiaries worldwide. It has used contracts & agreements as a key strategy to enhance its product portfolio. For instance, in September 2016, ABB received an order to supply Gas-Insulated Switchgear (GIS) and shunt reactors to Red El�ctrica de Espa�a, (REE). The project includes design, supply, and commission of three shunt reactors of 6 MVAr (megavolt amperes reactive), 72 kV, and one 9 MVAr 132 kV to be installed in the same indoor substations located on Lanzarote and Fuerteventura.
Recent Developments
- In October 2017, Siemens manufactured largest variable shunt reactors and would supply three units of this type for the Hornsea Project One in the UK
- In October 2017, Larsen and Turbo (L&T) signed a contract with Siemens to supply four shunt reactors to the Oman Electricity Transmission Company. The reactors would range 400 kV substations in Izki and Ibri to improve the grid stability across the transmission lines between these cities.
- In August, 2017, GE partnered with the National Grid Corporation of the Philippines (NGCP) for the new 500 kV transmission line project and substation located in Hermosa, Bataan. The solutions business of GE Power Grid would provide two banks of 1000 MVA composed of 7 x 333.33 MVA, 1-phase, 60 Hz, 500/230-13.8 kV Auto-Transformers; 2 banks of 60 MVAr (Bay reactor) composed of 6 x 20 MVAr, 6 x 20 MVAr 1-phase, 60 Hz, 500 kV Power Shunt Reactors; 1 bank of 90MVAr (Line reactor) composed of 3 x 30 MVAR, 1-phase, 60 Hz, 500 kV Power Shunt Reactors.
- In June 2017, Zaporozhtransformator completed the supply of five shunt reactors to Tenaga Nasional Berhad, the largest Malaysian energy company. The contract includes three reactors RTM-125000/500, two reactors ROM-1000/245, and chef and supervision of equipment and installation commissioning.
- In June 2017, TRIL signed an agreement with Japan-based Fuji Electric Co. The company has been granted the license by Fuji to use its technology and the know-how to design, manufacture, assemble, and inspect generator step-up transformers and shunt reactors. The license agreement includes single-phase and three-phase generator step-up transformers of 420 kV and up to 1000 MVA bank capacity as well as single-phase shunt reactors of 765 kV and up to 133 MVAr capacity, and three-phase shunt reactors of 420 kV and up to 125 MVAr capacity.
Critical questions the report answers:
- Where will all these developments take the industry in the long term?
- What are the upcoming trends for the offshore support vessel market?
- Which segment provides the most opportunity for growth?
- Who are the leading vendors operating in this market?
- What are the opportunities for new market entrants?
To speak to our analyst for a discussion on the above findings, click Speak to Analyst
 Exclusive indicates content/data unique to MarketsandMarkets and not available with any competitors.
Table of Contents
1 Introduction (Page No. - 15)
1.1 Objectives of the Study
1.2 Market Definition
1.3 Market Scope
1.3.1 Markets Covered
1.3.2 Years Considered for the Study
1.4 Currency
1.5 Stakeholders
2 Research Methodology (Page No. - 17)
2.1 Introduction
2.1.1 Secondary Data
2.1.1.1 Key Data From Secondary Sources
2.1.2 Primary Data
2.1.2.1 Key Data From Primary Sources
2.1.2.2 Key Industry Insights
2.1.2.3 Breakdown of Primary Interviews
2.2 Market Size Estimation
2.2.1 Bottom-Up Approach
2.2.2 Top-Down Approach
2.3 Market Breakdown & Data Triangulation
2.4 Research Assumptions
3 Executive Summary (Page No. - 25)
4 Premium Insights (Page No. - 29)
4.1 Attractive Opportunities in the Shunt Reactor Market
4.2 Shunt Reactor Market, Bycountry, 2017-2022
4.3 Shunt Reactor Market, By Type, 2017 & 2022
4.4 Asia Pacific Shunt Reactor Market, By Country & End-User, 2016
4.5 Shunt Reactor Market, By Application, 2017
5 Market Overview (Page No. - 32)
5.1 Introduction
5.1.1 Drivers
5.1.1.1 Augmentation & Modernization of Transmission & Distribution Networks
5.1.1.2 Rising Demand for Electricity
5.1.1.3 Upgradation of Aging Technology in Developed Nations
5.1.1.4 High Voltage Transmission Lines Addition
5.1.2 Restraints
5.1.2.1 Development of Alternate Technologies
5.1.2.2 Low Quality Products
5.1.3 Opportunities
5.1.3.1 Increase in Power Generation Capacity
5.1.3.2 Adopting Smart Grid Technology
6 Shunt Reactor Market, By Phase (Page No. - 36)
6.1 Introduction
6.1.1 Shunt Reactor Market Size, By Phase, 2015�2022 (USD Million)
6.2 Single Phase Shunt Reactors
6.2.1 Single Phase: Market Size, By Region, 2015�2022 (USD Million)
6.2.2 North America: Single Phase Market Size, By Country, 2015�2022 (USD Million)
6.2.3 Europe: Single Phase Market Size, By Country, 2015�2022 (USD Million)
6.2.4 Asia Pacific: Single Phase Market Size, By Country, 2015�2022 (USD Million)
6.2.5 South America: Single Phase Market Size, By Country, 2015�2022 (USD Million)
6.2.6 Middle East & Africa: Single Phase Market Size, By Country, 2015�2022 USD Million
6.3 Three Phase Shunt Reactors
6.3.1 Three Phase: Market Size, By Region, 2015�2022 (USD Million)
6.3.2 North America: Three Phase Market Size, By Country, 2015�2022 (USD Million)
6.3.3 Europe: Single Three Market Size, By Country, 2015�2022 (USD Million)
6.3.4 Asia Pacific: Three Phase Market Size, By Country, 2015�2022 (USD Million)
6.3.5 South America: Three Phase Market Size, By Country, 2015�2022 (USD Million)
6.3.6 Middle East & Africa: Three Phase Market Size, By Country, 2015�2022 USD Million
7 Shunt Reactor Market, By Type (Page No. - 37)
7.1 Introduction
7.1.1 Shunt Reactor Market Size, By Type, 2015�2022 (USD Million)
7.2 Oil-Immersed Shunt Reactors
7.2.1 Oil-Immersed: Market Size, By Region, 2015�2022 (USD Million)
7.2.2 North America: Oil-Immersed Market Size, By Country, 2015�2022 (USD Million)
7.2.3 Europe: Oil-Immersed Market Size, By Country, 2015�2022 (USD Million)
7.2.4 Asia Pacific: Oil-Immersed Market Size, By Country, 2015�2022 (USD Million)
7.2.5 South America: Oil-Immersed Market Size, By Country, 2015�2022 (USD Million)
7.2.6 Middle East & Africa: Oil-Immersed Market Size, By Country, 2015�2022 USD Million
7.3 Air-Core Shunt Reactors
7.3.1 Air-Core: Market Size, By Region, 2015�2022 (USD Million)
7.3.2 North America: Air-Core Market Size, By Country, 2015�2022 (USD Million)
7.3.3 Europe: Air-Core Market Size, By Country, 2015�2022 (USD Million)
7.3.4 Asia Pacific: Air-Core Market Size, By Country, 2015�2022 (USD Million)
7.3.5 South America: Air-Core Market Size, By Country, 2015�2022 (USD Million)
7.3.6 Middle East & Africa: Air-Core Market Size, By Country, 2015�2022 (USD Million)
8 Shunt Reactor Market, By Voltage (Page No. - 46)
8.1 Introduction
8.1.1 Shunt Reactor Market Size, By Voltage, 2015�2022 (USD Million)
8.2 Upto 200 Kv
8.2.1 Upto 200 Kv: Market Size, By Region, 2015�2022 (USD Million)
8.3 200-400 Kv
8.3.1 200-400 Kv Market Size, By Region, 2015�2022 (USD Million)
8.4 Above 400 Kv
8.4.1 Above 400 Kv Market Size, By Region, 2015�2022 (USD Million)
9 Shunt Reactor Market, By End-User (Page No. - 51)
9.1 Introduction
9.1.1 Shunt Reactor Market Size, By End-User, 2015�2022 (USD Million)
9.2 Electric Utilities
9.2.1 Electric Utilities: Market Size, By Region, 2015�2022 (USD Million)
9.3 Industrial Verticals
9.3.1 Industrial Verticals Market Size, By Region, 2015�2022 (USD Million)
10 Shunt Reactor Market, By Application (Page No. - 56)
10.1 Introduction
10.1.1 Market Size, By Application, 2015�2022 (USD Million)
10.2 Variable Shunt Reactor
10.2.1 Variable: Market Size, By Region, 2015�2022 (USD Million)
10.3 Fixed Shunt Reactor
10.3.1 Fixed: Market Size, By Region, 2015�2022 (USD Million)
11 Shunt Reactor Market, By Region (Page No. - 60)
11.1 Introduction
11.1.1 Shunt Reactor Market Size, By Region, USD Million, 2015�2022 (USD Million)
11.2 Asia Pacific
11.2.1 Asia Pacific: Shunt Reactor Market Size, By Type, 2015�2022 (USD Million)
11.2.2 Asia Pacific: Market Size, By End-User, 2015�2022 (USD Million)
11.2.3 Asia Pacific: Market Size, By Application, 2015�2022 (USD Million)
11.2.4 Asia Pacific: Market Size, By Country, 2015�2022 (USD Million)
11.2.5 China
11.2.5.1 China: Shunt Reactor Market Size, By Type, 2015�2022 (USD Million)
11.2.6 India
11.2.6.1 India: Market Size, By Type, 2015�2022 (USD Million)
11.2.7 Australia
11.2.7.1 Australia: Market Size, By Type, 2015�2022 (USD Million)
11.2.8 Japan
11.2.8.1 Japan: Shunt Reactor Market Size, By Type, 2015�2022 (USD Million)
11.2.9 Rest of Asia Pacific
11.2.9.1 Rest of Asia Pacific: Shunt Reactor Market Size, By Type, 2015�2022 (USD Million)
11.3 North America
11.3.1 North America: Shunt Reactor Market Size, By Type, 2015�2022 (USD Million)
11.3.2 North America: Market Size, By End-User, 2015�2022 (USD Million)
11.3.3 North America: Market Size, By Application, 2015�2022 (USD Million)
11.3.4 North America: Market Size, By Country, 2015�2022 (USD Million)
11.3.5 US
11.3.5.1 US: Shunt Reactor Market Size, By Type, 2015�2022 (USD Million)
11.3.6 Canada
11.3.6.1 Canada: Shunt Reactor Market Size, By Type, 2015�2022 (USD Million)
11.3.7 Mexico
11.3.7.1 Mexico: Shunt Reactor Market Size, By Type, 2015�2022 (USD Million)
11.4 Europe
11.4.1 Europe: Shunt Reactor Market Size, By Type, 2015�2022 (USD Million)
11.4.2 Europe: Market Size, By End-User, 2015�2022 (USD Million)
11.4.3 Europe: Market Size, By Application, 2015�2022 (USD Million)
11.4.4 Europe: Market Size, By Country, 2015�2022 (USD Million)
11.4.5 Germany
11.4.5.1 Germany: Shunt Reactor Market Size, By Type, 2015�2022 (USD Million)
11.4.6 Russia
11.4.6.1 Russia: Shunt Reactor Market Size, By Type, 2015�2022 (USD Million)
11.4.7 UK
11.4.7.1 UK: Shunt Reactor Market Size, By Type, 2015�2022 (USD Million)
11.4.8 France
11.4.8.1 France: Shunt Reactor Market Size, By Type, 2015�2022 (USD Million)
11.4.9 Italy
11.4.9.1 Italy: Shunt Reactor Market Size, By Type, 2015�2022 (USD Million)
11.4.10 Sweden
11.4.10.1 Sweden: Shunt Reactor Market Size, By Type, 2015�2022 (USD Million)
11.4.11 Spain
11.4.11.1 Spain: Shunt Reactor Market Size, By Type, 2015�2022 (USD Million)
11.4.12 Rest of Europe
11.4.12.1 Rest of Europe: Shunt Reactor Market Size, By Type, 2015�2022 (USD Million)
11.5 Middle East & Africa
11.5.1 Middle East & Africa: Shunt Reactor Market Size, By Type, 2015�2022 (USD Million)
11.5.2 Middle East & Africa: Market Size, By End-User, 2015�2022 (USD Million)
11.5.3 Middle East & Africa: Market Size, By Application, 2015�2022 (USD Million)
11.5.4 Middle East & Africa: Market Size, By Country, 2015�2022 (USD Million)
11.5.5 Saudi Arabia
11.5.5.1 Saudi Arabia: Market Size, By Type, 2015�2022 (USD Million)
11.5.6 South Africa
11.5.6.1 South Africa: Market Size, By Type, 2015�2022 (USD Million)
11.5.7 UAE
11.5.7.1 UAE: Market Size, By Type, 2015�2022 (USD Million)
11.5.8 Kuwait
11.5.8.1 Kuwait: Market Size, By Type, 2015�2022 (USD Million)
11.5.9 Qatar
11.5.9.1 Qatar: Shunt Reactor Market Size, By Type, 2015�2022 (USD Thousand)
11.5.10 Algeria
11.5.10.1 Algeria: Market Size, By Type, 2015�2022 (USD Thousand)
11.5.11 Nigeria
11.5.11.1 Nigeria: Market Size, By Type, 2015�2022 (USD Thousand)
11.5.12 Rest of the Middle East & Africa
11.5.12.1 Rest of the Middle East & Africa: Shunt Reactor Market Size, By Type, 2015�2022 (USD Thousand)
11.6 South America
11.6.1 South America: Market Size, By Type, 2015�2022 (USD Million)
11.6.2 South America: Market Size, By End-User, 2015�2022 (USD Million)
11.6.3 South America: Market Size, By Application, 2015�2022 (USD Million)
11.6.4 South America: Market Size, By Country, 2015�2022 (USD Million)
11.6.5 Brazil
11.6.5.1 Brazil: Market Size, By Type, 2015�2022 (USD Million)
11.6.6 Argentina
11.6.6.1 Argentina: Market Size, By Type, 2015�2022 (USD Million)
11.6.7 Rest of South America
11.6.7.1 Rest of South America: Market Size, By Type, 2015�2022 (USD Million)
12 Competitive Landscape (Page No. - 97)
12.1 Overview
12.2 Competitive Scenario
12.2.1 Contracts & Agreements
12.2.2 Expansions
13 Company Profiles (Page No. - 104)
13.1 ABB
13.1.1 Business Overview
13.1.2 Products Offered
13.1.3 Recent Developments
13.1.4 SWOT Analysis
13.1.5 MnM View
13.2 Siemens
13.2.1 Business Overview
13.2.2 Products Offered
13.2.3 Recent Developments
13.2.4 SWOT Analysis
13.2.5 MnM View
13.3 Crompton Greaves
13.3.1 Business Overview
13.3.2 Products Offered
13.3.3 Recent Developments
13.3.4 SWOT Analysis
13.3.5 MnM View
13.4 General Electric
13.4.1 Business Overview
13.4.2 Products Offered
13.4.3 Recent Developments
13.4.4 SWOT Analysis
13.4.5 MnM View
13.5 Zaporozhtransformator
13.5.1 Business Overview
13.5.2 Products Offered
13.5.3 Recent Developments
13.5.4 SWOT Analysis
13.5.5 MnM View
13.6 Fuji Electric
13.6.1 Business Overview
13.6.2 Products Offered
13.6.3 Recent Developments
13.6.4 MnM View
13.7 Toshiba
13.7.1 Business Overview
13.7.2 Products Offered
13.7.3 Recent Developments
13.7.4 MnM View
13.8 Mitsubishi Electric
13.8.1 Business Overview
13.8.2 Products Offered
13.8.3 MnM View
13.9 Nissin Electric
13.9.1 Business Overview
13.9.2 Products Offered
13.9.3 MnM View
13.10 TBEA
13.10.1 Business Overview
13.10.2 Products Offered
13.10.3 Recent Developments
13.10.4 MnM View
13.11 Trench Group
13.11.1 Business Overview
13.11.2 Products Offered
13.11.3 MnM View
13.12 Hilkar
13.12.1 Business Overview
13.12.2 Products Offered
13.12.3 MnM View
14 Appendix (Page No. - 133)
14.1 Insights of Industry Experts
14.2 Discussion Guide
14.3 Knowledge Store: Marketsandmarkets� Subscription Portal
14.4 Knowledge Store: Marketsandmarkets Subscription Portal
14.5 Introducing Rt: Real Time Market Intelligence
14.6 Available Customizations
14.7 Related Reports
14.8 Author Details
List of Tables (70 Tables)
Table 1 Shunt Reactor Market Snapshot
Table 2 Shunt Reactor Market Size, By Type, 2015�2022 (USD Million)
Table 3 Oil-Immersed: Shunt Reactor Market Size, By Region, 2015�2022 (USD Million)
Table 4 North America: Oil-Immersed Market Size, By Country, 2015�2022 (USD Million)
Table 5 Europe: Oil-Immersed Market Size, By Country, 2015�2022 (USD Million)
Table 6 Asia Pacific: Oil-Immersed Market Size, By Country, 2015�2022 (USD Million)
Table 7 South America: Oil-Immersed Market Size, By Country, 2015�2022 (USD Million)
Table 8 Middle East & Africa: Oil-Immersed Market Size, By Country, 2015�2022 USD Million)
Table 9 Air-Core: Market Size, By Region, 2015�2022 (USD Million)
Table 10 North America: Air-Core Market Size, By Country, 2015�2022 (USD Million)
Table 11 Europe: Air-Core Market Size, By Country, 2015�2022 (USD Million)
Table 12 Asia Pacific: Air-Core Shunt Reactor Market Size, By Country, 2015�2022 (USD Million)
Table 13 South America: Air-Core Shunt Reactor Market Size, By Country, 2015�2022 (USD Million)
Table 14 Middle East & Africa: Air-Core Shunt Reactor Market Size, By Country, 2015�2022 (USD Million)
Table 15 Shunt Reactor Market Size, By End-User, 2015�2022 (USD Million)
Table 16 Electric Utilities: Market Size, By Region, 2015�2022 (USD Million)
Table 17 Industrial Verticals Market Size, By Region, 2015�2022 (USD Million)
Table 18 Shunt Reactor Market Size, By Application, 2015�2022 (USD Million)
Table 19 Variable: Market Size, By Region, 2015�2022 (USD Million)
Table 20 Fixed: Market Size, By Region, 2015�2022 (USD Million)
Table 21 Shunt Reactor Market Size, By Region, USD Million, 2015�2022 (USD Million)
Table 22 Asia Pacific: Shunt Reactor Market Size, By Type, 2015�2022 (USD Million)
Table 23 Asia Pacific: Market Size, By End-User, 2015�2022 (USD Million)
Table 24 Asia Pacific: Market Size, By Application, 2015�2022 (USD Million)
Table 25 Asia Pacific: Market Size, By Country, 2015�2022 (USD Million)
Table 26 China: Market Size, By Type, 2015�2022 (USD Million)
Table 27 India: Market Size, By Type, 2015�2022 (USD Million)
Table 28 Australia: Market Size, By Type, 2015�2022 (USD Million)
Table 29 Japan: Shunt Reactor Market Size, By Type, 2015�2022 (USD Million)
Table 30 Rest of Asia Pacific: Market Size, By Type, 2015�2022 (USD Million)
Table 31 North America: Market Size, By Type, 2015�2022 (USD Million)
Table 32 North America: Market Size, By End-User, 2015�2022 (USD Million)
Table 33 North America: Market Size, By Application, 2015�2022 (USD Million)
Table 34 North America: Market Size, By Country, 2015�2022 (USD Million)
Table 35 US: Shunt Reactor Market Size, By Type, 2015�2022 (USD Million)
Table 36 Canada: Market Size, By Type, 2015�2022 (USD Million)
Table 37 Mexico: Market Size, By Type, 2015�2022 (USD Million)
Table 38 Europe: Market Size, By Type, 2015�2022 (USD Million)
Table 39 Europe: Market Size, By End-User, 2015�2022 (USD Million)
Table 40 Europe: Market Size, By Application, 2015�2022 (USD Million)
Table 41 Europe: Market Size, By Country, 2015�2022 (USD Million)
Table 42 Germany: Market Size, By Type, 2015�2022 (USD Million)
Table 43 Russia: Market Size, By Type, 2015�2022 (USD Million)
Table 44 UK: Market Size, By Type, 2015�2022 (USD Million)
Table 45 France: Market Size, By Type, 2015�2022 (USD Million)
Table 46 Italy: Market Size, By Type, 2015�2022 (USD Million)
Table 47 Sweden: Market Size, By Type, 2015�2022 (USD Million)
Table 48 Spain: Market Size, By Type, 2015�2022 (USD Million)
Table 49 Rest of Europe: Shunt Reactor Market Size, By Type, 2015�2022 (USD Million)
Table 50 Middle East & Africa: Market Size, By Type, 2015�2022 (USD Million)
Table 51 Middle East & Africa: Market Size, By End-User, 2015�2022 (USD Million)
Table 52 Middle East & Africa: Market Size, By Application, 2015�2022 (USD Million)
Table 53 Middle East & Africa: Market Size, By Country, 2015�2022 (USD Million)
Table 54 Saudi Arabia: Shunt Reactor Market Size, By Type, 2015�2022 (USD Million)
Table 55 South Africa: Market Size, By Type, 2015�2022 (USD Million)
Table 56 UAE: Market Size, By Type, 2015�2022 (USD Million)
Table 57 Kuwait: Market Size, By Type, 2015�2022 (USD Million)
Table 58 Qatar: Market Size, By Type, 2015�2022 (USD Thousand)
Table 59 Algeria: Market Size, By Type, 2015�2022 (USD Thousand)
Table 60 Nigeria: Market Size, By Type, 2015�2022 (USD Thousand)
Table 61 Rest of the Middle East & Africa: Shunt Reactor Market Size, By Type, 2015�2022 (USD Thousand)
Table 62 South America: Shunt Reactor Market Size, By Type, 2015�2022 (USD Million)
Table 63 South America: Market Size, By End-User, 2015�2022 (USD Million)
Table 64 South America: Market Size, By Application, 2015�2022 (USD Million)
Table 65 South America: Market Size, By Country, 2015�2022 (USD Million)
Table 66 Brazil: Shunt Reactor Market Size, By Type, 2015�2022 (USD Million)
Table 67 Argentina: Market Size, By Type, 2015�2022 (USD Million)
Table 68 Rest of South America: Market Size, By Type,2015�2022 (USD Million)
Table 69 Contracts & Agreements, 2014�2017
Table 70 Expansions, 2014�2017
List of Figures (32 Figures)
Figure 1 Markets Covered: Shunt Reactor Market Segmentation
Figure 2 Shunt Reactor Market: Research Design
Figure 3 Breakdown of Primary Interviews: By Company Type, Designation, & Region
Figure 4 Market Size Estimation Methodology: Bottom-Up Approach
Figure 5 Market Size Estimation Methodology: Top-Down Approach
Figure 6 Shunt Reactor Market: Market Estimation Approach & Data Triangulation Methodology
Figure 7 The Market in Asia Pacific Dominated the Shunt Reactor Market in 2016
Figure 8 The Oil-Immersed Segment is Expected to Lead the Shunt Reactor Market, By Type, During the Forecast Period
Figure 9 Shunt Reactor Market: Application Snapshot
Figure 10 Shunt Reactor Market: End-User Snapshot
Figure 11 Increased Demand for Electricity is Expected to Drive the Shunt Reactor Market During the Forecast Period
Figure 12 The Markets in Canada & India are Expected to Hold the Growth Rate During the Forecast Period
Figure 13 The Oil-Immersed Segment is Expected to Grow at the Fastest Pace During the Forecast Period
Figure 14 The Electric Utilities Segment is Expected to Lead the Market During the Forecast Period
Figure 15 The Variable Reactor Segment is Expected to Lead the Market in 2017
Figure 16 Market Dynamics for the Market
Figure 17 Shunt Reactor Market Share (Value), By Type, 2016
Figure 18 Shunt Reactor Market Share (Value), By End-User, 2016
Figure 19 Shunt Reactor Market Share (Value), By Application, 2016
Figure 20 Regional Snapshot: Rapid Growth in Developing Markets
Figure 21 Asia Pacific Shunt Reactor Market Snapshot
Figure 22 North American Shunt Reactor Market Snapshot
Figure 23 Companies Adopted Contracts & Agreements & New Expansions to Capture the Market 2014�2017
Figure 24 ABB: Company Snapshot
Figure 25 Siemens: Company Snapshot
Figure 26 Crompton Greaves: Company Snapshot
Figure 27 General Electric: Company Snapshot
Figure 28 Fuji Electric: Company Snapshot
Figure 29 Toshiba: Company Snapshot
Figure 30 Mitsubishi Electric: Company Snapshot
Figure 31 Nissin Electric: Company Snapshot
Figure 32 TBEA : Company Snapshot


Growth opportunities and latent adjacency in Shunt Reactor Market