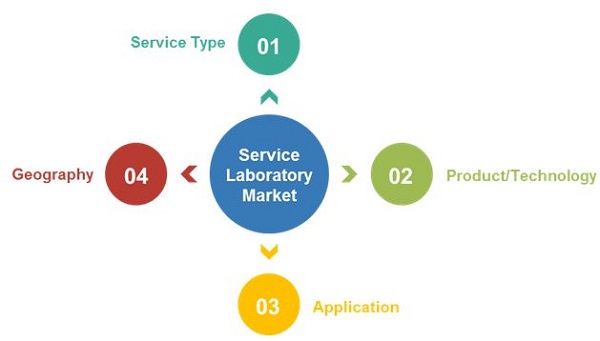
Service Laboratory Market by Service Type (OEM, Laboratory Services), Product/Technology (FE-TEM, STEM, FIB-SEM, FEG-SEM, SIMS), Application (Biotechnology, Pharmaceutical, Semiconductor) and Geography (North America, Europe, APAC) - Global forecast to 2020
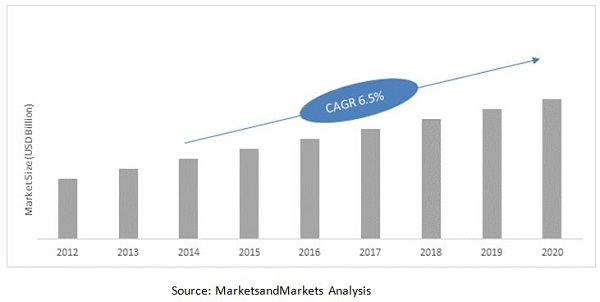
Service laboratory is a process of identifying faults and defects in the products. It is the most widely used process across several industries under high quality reliability platform. Service laboratory equipment helps in analyzing the root cause of failure of an end product, device, or system in order to develop corrective action plan. It helps in improving next generation versions of the product or other products. Once the root cause for quality and productivity related problems has been identified for the manufacturing process to overcome failure mode, the service laboratory equipment is used. These instruments include scanning electron microscope (SEM), transmission electron microscope (TEM), and secondary ion mass spectroscopy (SIMS). The overall service laboratory market was valued at USD 3.75 Billion in 2014 and is expected to grow at a CAGR of 6.45% from 2014 to 2020.
Each section will cover the market data, and information with regards to the market drivers, trends and opportunities, key players, and competitive outlook. This report also makes way for market tables to cover the subsegments and micromarkets. In addition, it profiles more than 10 companies covering all the subsegments, such as business overview, products & services, key strategies, and developments.
The service laboratory market is currently going through a growth phase. Conventional microscopy and mass spectrometry are witnessing rapid evolution in terms of adoption of the high-resolution mass spectrometry technologies and electron microscopy for improved analysis. The semiconductor, biotechnology, and pharmaceutical industries are propelling the demand of service laboratory equipment. The overall service laboratory market is expected to grow from USD 3.75 Billion in 2014 to USD 5.45 Billion by 2020, at a CAGR of 6.5% from 2014 to 2020. The market in APAC is expected to witness the highest growth due to major growth spurts expected in the material science sector in the developing countries of this region.
North America, Europe, and even APAC countries such as China and Japan are some of the early adopters of the service laboratory market. China is a potential market for microscopy as skilled workforce and early stage capital can be easily available. India and Brazil are prospective markets due to their growing R&D initiatives. Moreover, the easy availability of funding in these countries is a key driving factor. Material science is the biggest application segment for SEM and is followed by the industrial segment.
The major companies involved in laboratory services are Exponent, Inc. (United States), Integrated Service Technology, Inc. (Taiwan), Nanolab Technologies, Inc. (United States), and Chipworks, Inc. (Canada) among others. The major OEMs include Hitachi High-Technologies Corporation (Japan), FEI Company (United States), JEOL Ltd. (Japan), and Carl Zeiss AG (Germany).
This report provides an insight on the overall service laboratory equipment market, with detailed segmentations based on equipment, technology, application, and geography, combined with the qualitative analysis of each and every aspect of the market. The global service laboratory market has been forecast from 2014 to 2020, to provide a glimpse of the potential revenue base for this market.
The figure below shows the estimated continuous growth of the service laboratory market by industry in the period from 2013 to 2020.

The transmission electron microscope and dual-beam microscope systems segments are expected to drive the growth of the service laboratory market during the forecast period. Semiconductor companies are adding new laboratory equipment in various stages of their R&D as well product life cycle which is driving the OEM and service market. However, for small players (semiconductor, biotechnology, and pharmaceutical companies in particular), the high service laboratory costs have resulted in outsourcing of these services as a cost control activity. This outsourcing of service laboratory tasks to contract research organizations (CROs) and small laboratories has contributed to the growth of the overall service laboratory market.

Table of Contents
1. Introduction
1.1. Objectives of the study
1.2. Market Definition
1.3. Markets Scope
2. Research Design
2.1. Factor Analysis
2.2. Service Laboratory Market Size Estimation
2.3. Service Laboratory Market Crackdown And Data Triangulation
2.4. Service Laboratory Market Share Estimation
2.4.1 Key Data Points
2.4.1.1. Key Data Points Taken from Secondary Sources
2.4.1.2. Key Data Points Taken from Primary Sources
2.4.2. Assumptions
3. Industry Trends
4. Service Laboratory Market, By Product
4.1. Transmission Electron Microscope (TEM)
4.1.1. FE-TEM Market Size & Forecast
4.1.2. STEM Market Size & Forecast
4.2. Scanning Electron Microscope (SEM)
4.2.1. Dual Beam FIB-SEM Market Size & Forecast
4.2.2. FEG-SEM Market Size & Forecast
5. Service Laboratory Market, By Laboratory
5.1. OEM Market Size & Forecast
5.2. Services Market Size & Forecast
6. Service Laboratory Market, By Application
6.1. Industrial Market Size & Forecast, By Sub-Application
6.1.1. Oil & Gas
6.1.2. Metal & Mining
6.1.3. Renewable Energy
6.1.4. Automotive
6.1.5. Steel
6.1.6. Construction
6.1.7. Aerospace
6.1.8. Chemical
6.1.9. Machinery & Tools
6.1.10. Power Generation & Energy
6.2. Material science Market Size & Forecast, By Sub-Application
6.2.1. Paper & Fiber material
6.2.2. Ceramic & Glass
6.2.3. Polymer
6.2.4. Nano Fabrication
6.3. Bio- Science Market Size & Forecast, By Sub-Application
6.3.1. Cellular Biology
6.3.2. Structural Biology
6.3.3. Bio Medical Engineering
6.3.4. Neuroscience
6.4. Electronics Market Size & Forecast, By Sub-Application
6.4.1. Semiconductor Manufacturing
6.4.2. Thin Film Production
6.4.3. Microelectronics & MEMS
7. Service Laboratory Market, By Geography
7.1. North America Market Size & Forecast, By Countries
7.1.1. U.S.
7.1.2. Canada
7.1.3. Mexico
7.2. Europe Market Size & Forecast, By Countries
7.2.1. Germany
7.2.2. U.K.
7.2.3. France
7.2.4. Others
7.3. Asia Pacific Market Size & Forecast, By Countries
7.3.1. Japan
7.3.2. China
7.3.3. South Korea
7.3.4. India
7.3.5. Others
7.4. ROW Market Size & Forecast, By Countries
7.4.1. South America
7.4.2. Middle East & Africa
8. Secondary Ion Mass Spectroscopy (SIMS) Market, By Application
8.1. Industrial Market Size & Forecast, By Sub-Application
8.1.1. Oil & Gas
8.1.2. Metal & Mining
8.1.3. Renewable Energy
8.1.4. Automotive
8.1.5. Steel
8.1.6. Construction
8.1.7. Aerospace
8.1.8. Chemical
8.1.9. Machinery & Tools
8.1.10. Power Generation & Energy
8.2. Material science Market Size & Forecast, By Sub-Application
8.2.1. Paper & Fiber material
8.2.2. Ceramic & Glass
8.2.3. Polymer
8.2.4. Nano Fabrication
8.3. Bio- Science Market Size & Forecast, By Sub-Application
8.3.1. Cellular Biology
8.3.2. Structural Biology
8.3.3. Bio Medical Engineering
8.3.4. Neuroscience
8.4. Electronics Market Size & Forecast, By Sub-Application
8.4.1. Semiconductor Manufacturing
8.4.2. Thin Film Production
8.4.3. Microelectronics & MEMS
9. Secondary Ion Mass Spectroscopy (SIMS), By Geography
9.1. North America Market Size & Forecast, By Country
9.1.1. U.S.
9.1.2. Canada
9.1.3. Mexico
9.2. Europe Market Size & Forecast, By Country
9.2.1. Germany
9.2.2. U.K.
9.2.3. France
9.2.4. Others
9.3. Asia Pacific Market Size & Forecast, By Country
9.3.1. Japan
9.3.2. China
9.3.3. South Korea
9.3.4. India
9.3.5. Others
9.4. ROW Market Size & Forecast, By Country
9.4.1. South America
9.4.2. Middle East & Africa
10. Competitive Landscape
10.1. Introduction
10.2. Service Laboratory Market Share Analysis
10.3. Competitive Situation and Trends
11. Company Profiles
11.1. Nanolab Technologies
11.1.1. Company Snapshot
11.1.2. Product Portfolio
11.1.3. MnM View
11.2. Cerium Labs
11.2.1. Company Snapshot
11.2.2. Product Portfolio
11.2.3. MnM View
11.3. Exponent
11.3.1. Company Snapshot
11.3.2. Product Portfolio
11.3.3. MnM View
11.4. Insight Analytical Labs
11.4.1. Company Snapshot
11.4.2. Product Portfolio
11.4.3. MnM View
11.5. ICE Labs
11.5.1. Company Snapshot
11.5.2. Product Portfolio
11.5.3. MnM View
11.6. ISE Labs
11.6.1. Company Snapshot
11.6.2. Product Portfolio
11.6.3. MnM View
11.7. Sage Labs
11.7.1. Company Snapshot
11.7.2. Product Portfolio
11.7.3. MnM View
11.8. MA-TEK
11.8.1. Company Snapshot
11.8.2. Product Portfolio
11.8.3. MnM View
11.9. IST
11.9.1. Company Snapshot
11.9.2. Product Portfolio
11.9.3. MnM View
11.10. MU analysis
11.10.1. Company Snapshot
11.10.2. Product Portfolio
11.10.3. MnM View
The report describes OEMs, service, products, application, and geographical regions with respect to service laboratory market size from 2014 to 2020. In addition, this report also details various technologies used for the service laboratory. On basis of equipment, the service laboratory market has been segmented into scanning electron microscope (SEM) and transmission electron microscope (TEM), which are further divided into segments of TEM and SEM types. Whereas SIMS market is a parallel market which is not included within the service laboratory market; but the SIMS market is further segmented in terms of application and geographical regions, along with their subsegments.
The key influencers in the service laboratory market includes investors and venture capitalists, researchers/organizations, and major players, such as Moody Labs (U.S.), Direct Electron (U.S.), Intertek Group PLC (U.K.), EAG Inc. (U.S.), Hitachi Hitech (Japan), FEI Company (U.S.), Carl Zeiss SMT GmbH (Germany), and Nanolab Technologies (U.S.). The prominent companies are the well-established, financially stable players who have been operating in the industry for several years. They have diversified product portfolios, proprietary technologies, and a strong distribution networks across the globe, as well as offices at strategic locations. The report provides exhaustive information regarding existing players as well as new entrants to get a deep insight about this market.
Finally, the company profiles section includes profiles of prominent players in this industry with their segmented revenues, product portfolios, and recent developments. Furthermore, the competitive landscape helps provide a better understanding of the mergers & acquisitions, collaborations, and joint ventures undertaken by the key players in the said market.
Target Audience
- Raw Material Suppliers
- Integrated Device Manufacturers (IDMs)
- Original Device Manufacturers (ODMs) (Discrete and Chip Manufacturers)
- Original Equipment Manufacturers (OEM)
- Process OEMs
- System Integrators
- Electronic Hardware Equipment Manufacturers
- Assembly and Packaging Vendors
- Technical Universities
- Academic Institutes
- Pharmaceutical and Biotechnology Industries
- Semiconductor Industries
- Government Space Research Agencies and Private Research Organizations
Scope of the Report
The report classifies the service laboratory equipment technology market into different segments, namely, by product, service type, application, and geography. It entails the analyses and forecasts related to the service laboratory equipment market.

On the basis of Application
Some of the major applications in the service laboratory market are industrial science, material science, bioscience, and electronics.
On the basis of Industry
Major industries in the service laboratory market includes oil & gas, mining, chemicals & pharmaceuticals, power generation, metal, paper & fibers, polymer, semiconductor manufacturing, MEMS, biomedical engineering, neuroscience, structural biology, and cellular biology.
On the basis of Geography
-
North America
- U.S.
- Canada
- Mexico
-
Europe
- France
- U.K.
- Germany
- Others
-
Asia-Pacific
- China
- Japan
- India
- Others
- RoW


Growth opportunities and latent adjacency in Service Laboratory Market