Sensor Market in Consumer Healthcare by Application (Patient Monitoring, Therapeutic, Handheld and Homecare, & Fitness and wellness), Sensor Type (Blood Pressure Sensor, Temperature Sensor, Image sensor, Heart rate sensor, Touch Sensor & Motion Sensor) & by Geography - Analysis & Forecast to to 2013 - 2020


Sensing devices are in heavy demand due to their functional capabilities such as processing, data fusion, communication, integration, and control in various applications. The concepts such as home diagnostics and home and remote monitoring are being commercialized with the development in the healthcare equipment such as portability, reduced size, and low-cost architecture facilitating disposable equipment.
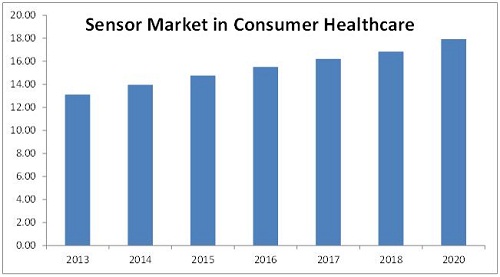
The report profiles all major companies active in the sensor market for consumer healthcare. This report also provides the competitive landscape of key players that indicates the growth strategy of the overall sensor market in consumer healthcare. The report also covers the entire value chain for the market from the raw material supplier to the end user. Along with a value chain, this report also provides an in-depth view on the types, applications, roadmap, and the drivers and restraints for the industry. The market for sensor in consumer healthcare applications is estimated to reach $47.40 billion by 2020 with a CAGR of 5.56% from 2014 to 2020.
Some of the key players in the sensor market for consumer healthcare are Analog Devices, Inc. (U.S.), Aptina Imaging Corp. (U.S.), EPCOS AG (Germany), Freescale Semiconductor Inc. (U.S.), GE Measurement & Control Solutions(U.S.), Measurement Specialties, Inc. (U.S.), Koninklijke Philips N.V. (Netherlands), and Infineon Technologies AG (Germany).
Consumer Healthcare Sensor Type:
Based on the types of sensors, the consumer healthcare market is segmented into temperature sensor, blood pressure sensor, blood glucose sensor, blood oxygen sensor, ECG sensor, image sensor, posture sensors, altitude sensors, motion sensor, pedometers, heart rate sensor, radiation sensor, and touch sensor.
Application:
The major applications of the consumer healthcare market include patient monitoring, therapeutic, imaging, handheld and homecare devices, and fitness and wellness equipment.
Geography:
The geographic market is further segmented into North America, Europe, Asia-Pacific (APAC), and the Rest of the World (RoW).
There has been an increasing momentum for consumer healthcare monitoring and sensing driven by sensors with advanced features and sophistication. The consumer healthcare will lessen the healthcare cost of the patient by reducing the time associated with doctor consultation, visiting doctor and so on. Consumer healthcare sensing plays an important role in delivering reliable psychological and biometric monitoring of patients.
The report provides the contributionof the sensor market in consumer healthcare with inclusive forecasts for revenue across sensor types,applications, and geography related to this market. The sensor type section in sensor market in consumer healthcare report is further segmented into as temperature sensor, blood pressure sensor, blood glucose sensor, blood oxygen sensor, ECG sensor, image sensor, posture sensors, altitude sensors, motion sensor, pedometers, heart rate sensor, posture sensor, radiation sensor, and touch sensor.Applications of sensor market inconsumer healthcare sectorincludepatient monitoring, therapeutic, imaging, handheld and homecare devices, and fitness andwellness devices.This sensor market in consumer healthcare report covers geographic regions, which are North America, Europe, Asia-Pacific, and the rest of the world.
Some of the key players in the sensor market for consumer healthcare are Analog Devices, Inc. (U.S.), Aptina Imaging Corp. (U.S.), EPCOS AG (Germany), Freescale Semiconductor, Inc. (U.S.), GE Measurement & Control Solutions(U.S.), Measurement Specialities, Inc. (U.S.), Koninklijke Philips N.V. (Netherlands), and Infineon Technologies AG (Germany).
Source: MarketsandMarkets Analysis
The sensor market in consumer healthcare is expected to reach $47.40billion by the end of 2020 at a CAGR of 5.56%.The sensor market in consumer healthcare application is driven by the rising healthcare costs, aging population, and wide-spread diseases. The growth in the portable and disposable diagnostic equipment, increasing need for greater precision, and reliability are some of the major market drivers for the sensors market in consumer healthcare applications.
 Exclusive indicates content/data unique to MarketsandMarkets and not available with any competitors.
Table of Contents
1 Introduction (Page No. - 22)
1.1 Objectives
1.2 Report Description
1.3 Markets Covered
1.4 Stakeholders
1.5 Research Methodology
1.5.1 Market Size
1.5.2 Key Data From Secondary Sources
1.5.3 Key Data From Primary Sources
1.5.4 Assumptions Made for the Report
1.5.5 List of Companies Covered During Study
2 Executive Summary (Page No. - 37)
3 Coverstory (Page No. - 39)
3.1 Interview With Director-Corporate Business Development, Alphasip
3.2 Interview With Director of Marketing, Epcos AG.
4 Market Overview (Page No. - 45)
4.1 History and Evolution of Sensors
4.2 Sensors in Consumer Healthcare
4.3 Market Dynamics
4.3.1 Market Drivers
4.3.1.1 Increasing Geriatric Population to Propel the Need of Monitoring Devices
4.3.1.2 Ease-of-Use and Portability of Devices to Push Point-of- Sensors Used in Healthcare Monitoring Devices
4.3.1.3 Enhanced User Experience Due to Digital Radiology
4.3.1.4 Demand of Various Diagnostic Imaging Modalities
4.3.1.5 Increasing Demand of Image Sensors Due to Advancements in Imaging Technology
4.3.1.6 Consumer Preference of Wearable Devices
4.3.1.7 Advancing Technology
4.3.1.8 Increasing Use of Radiation therapy in Treatment and Diagnosis of Diseases
4.3.1.9 Continuous Growth of the Capacitive touch Sensors Enabled Devices in the Consumer Healthcare Sector
4.3.2 Market Restraints
4.3.2.1 Lack of Trained Personnel
4.3.2.2 High Maintenance and Refurbishment Cost
4.3.2.3 Availability of Low Cost Alternatives
4.3.2.4 Lack of Product Differentiation
4.3.2.5 Decreasing Value of Blood Glucose Kits
4.3.2.6 Lack of Proper Standardization and Calibration of Devices and Equipment
4.3.3 Market Opportunities
4.3.3.1 Combination With Augmented Reality Image Sensors
4.3.3.2 Automated Medical Capsules
4.3.3.3 Motion Sensors for Wearable Devices
4.3.3.4 Emerging Applications of the Capacitive Sensors in the Field of Nanotechnology
4.3.3.5 Adoption Rates of therapeutic Radiology in Developing Countries
4.3.4 Present Scenario
4.3.4.1 Mems-Based Sensors
4.3.4.2 Multivariable Sensing Capabilities
4.3.5 Future Scenario
4.3.5.1 Wireless Mems
4.3.5.2 Nano-Electromechanical Systems
4.3.6 Winning Imperatives
4.3.6.1 Mems Sensors in Consumer Healthcare
4.3.6.2 Demand for Multi-touch Sensors
4.3.7 New Product Launches
4.3.8 Emerging Trends in the Consumer Healthcare Market
4.3.8.1 Image Sensor Systems for Diagnosis of Cancer
4.3.8.2 Stick-on Skin Sensors
4.4 Pricing Analysis
4.5 Value Chain Analysis
4.6 Patent Analysis
4.7 Porter�s Analysis
4.7.1 Threat of New Entrants
4.7.2 Threat of Substitutes
4.7.3 Bargaining Power of Suppliers
4.7.4 Bargaining Power of Buyers
4.7.5 Degree of Competition
5 Market By Sensor Type (Page No. - 87)
5.1 Introduction
5.2 Blood Pressure Sensor
5.3 Temperature Sensor
5.4 Image Sensor
5.5 Motion Sensor
5.6 touch Sensor
5.7 Heart Rate Sensor
5.8 Blood Glucose Sensor
5.9 Radiation Sensor
5.10 ECG Sensor
5.11 Blood Oxygen Sensor/Pulse Oximeter
5.12 Lactate Sensor
5.13 Pedometer
5.14 Environment Sensor
5.15 Calorie Sensor
6 Market By Application (Page No. - 142)
6.1 Patient Monitoring
6.1.1 ECG Monitor
6.1.2 Heart Rate Monitor
6.1.3 Hemodynamic Monitor
6.1.4 Pulse Oximeters
6.1.5 Implantable Loop Recorder
6.1.6 Holter Monitor
6.1.7 Smart Pills
6.2 Therapeutic
6.2.1 Syringe Pump
6.2.2 Infusion Pump
6.3 Imaging
6.3.1 Ultrasound Scan
6.3.2 Digital Radiology
6.3.3 Magnetic Resonance Imaging (MRI)
6.3.4 Endoscopy/Capsule Endoscopy
6.4 Handheld and Homecare
6.4.1 Single Point Blood Glucose Monitor
6.4.2 Digital Thermometer
6.4.3 Sleep Apnea Monitor
6.4.4 Continuous Glucose Monitor
6.5 Fitness and Wellness
6.5.1 Fitness Armband
6.5.2 Rehabilitation Equipment
6.5.3 Physiotherapy Devices
6.5.4 Wearable Devices
6.5.5 Altitude Sensors
6.5.6 Posture Sensors
6.5.7 Temperature Sensors
6.5.8 Blood Pressure Sensors
6.5.9 Blood Glucose Sensors
6.5.10 ECG Sensors
6.5.11 Motion Sensors
6.5.12 Heart Rate Sensors
6.6 touch Sensor
7 Market By Geography (Page No. - 182)
7.1 Introduction
7.2 North America
7.3 Europe
7.4 APAC
7.5 ROW
8 Competitive Landscape (Page No. - 192)
8.1 Introduction
8.2 Market Share Analysis
8.3 Key Growth Strategies
8.4 New Product Developments
8.5 Mergers and Acquisitions
8.6 Joint Ventures/Partnerships/Collaborations/ Alliances
8.7 Others
9 Company Profiles (Page No. - 219)
(Overview, Products and Services, Financials, Strategy & Development)*
9.1 3M
9.2 Ametek, Inc.
9.3 Analog Devices, Inc.
9.4 Aptina Imaging Corporation
9.5 Atmel Corporation
9.6 Avago Technologies
9.7 Banner Engineering Corporation
9.8 Cambridge Temperature Concepts
9.9 Danaher Corporation
9.10 Ecardio Diagnostics
9.11 Elmos Semiconductor AG
9.12 Epcos AG
9.13 Freescale Semiconductor, Inc.
9.14 Fujitsu Corporation
9.15 GE Measurement & Control Solutions
9.16 Honeywell International, Inc.
9.17 Infineon Technologies AG
9.18 Invensense. Inc.
9.19 Koninklijke Philips N.V.
9.20 Maxim Integrated
9.21 Measurement Specialties Inc.
9.22 Melexis Corporation
9.23 Murata Manufacturing Co., Ltd.
9.24 Proteus Digital Health, Inc.
9.25 Qualcomm Atheros Inc. (QCA)
9.26 RF Technologies
9.27 Senseonics, Inc.
9.28 Stmicroelectronics N.V.
9.29 Texas Instruments, Inc.
9.30 Toshiba Corporation
9.31 Vancive Medical Technologies
*Details on Overview, Products and Services, Financials, Strategy & Development Might Not Be Captured in Case of Unlisted Companies.
List of Tables (73 Tables)
Table 1 General Assumptions, Terminologies, and Application Keynotes
Table 2 Asp for Sensors in Consumer Health, By Device Type
Table 3 Sensor in Consumer Healthcare Market, Patent Analysis (2007-2014)
Table 4 Sensors in Consumer Healthcare:Market Value, By Type, 2013-2020 ($Million)
Table 5 Sensors in Consumer Healthcare: Market Volume, By Type, 2013-2020 (Million Units)
Table 6 Blood Pressure Sensor Market Value, By Application, 2013-2020 ($Million)
Table 7 Blood Pressure Sensor Market Volume, By Application, 2013-2020 (Million Units)
Table 8 Blood Pressure Sensors Market Value, By Geography, 2013-2020 ($Million)
Table 9 Temperature Sensor Market Value, By Application, 2013-2020 ($Million)
Table 10 Temperature Sensor Market Volume, By Application, 2013-2020 (Million Units)
Table 11 Temperature Sensors Market Value, By Geography, 2013-2020 ($Million)
Table 12 Image Sensor Market Value, By Application, 2013-2020 ($Million)
Table 13 Image Sensor Market Volume, By Application, 2013-2020 (Million Units)
Table 14 Image Sensors Market Value, By Geography, 2013-2020 ($Million)
Table 15 Motion Sensor Market Value, By Application, 2013-2020 ($Million)
Table 16 Motion Sensor Market Volume, By Application, 2013-2020 (Million Units)
Table 17 Motion Sensors Market Value, By Geography, 2013-2020 ($Million)
Table 18 Touch Sensor Market Value, By Application, 2013-2020 ($Million)
Table 19 Touch Sensor Market Volume, By Application, 2013-2020 (Million Units)
Table 20 Touch Sensors Market Value, By Geography, 2013-2020 ($Million)
Table 21 Heart Rate Sensor Market Value, By Application, 2013-2020 ($Million)
Table 22 Heart Rate Sensor Market Volume, By Application, 2013-2020 (Million Units)
Table 23 Heart Rate Sensors Market Value, By Geography, 2013-2020 ($Million)
Table 24 Blood Glucose Sensor Market Value, By Application, 2013-2020 ($Million)
Table 25 Blood Glucose Sensor Market Volume, By Application, 2013-2020 (Million Units)
Table 26 Blood Glucose Sensors Market Value,By Geography, 2013-2020 ($Million)
Table 27 Radiation Sensor Market Value, By Application, 2013-2020 ($Million)
Table 28 Radiation Sensor Market Volume, By Application, 2013-2020 (Million Units)
Table 29 Radiation Sensors Market Value, By Geography, 2013-2020 ($Million)
Table 30 ECG Sensor Market Value, By Application, 2013-2020 ($Million)
Table 31 ECG Sensor Market Volume, By Application, 2013-2020 (Million Units)
Table 32 ECG Sensors Market Value, By Geography, 2013-2020 ($Million)
Table 33 Blood Oxygen Sensor Market Value, By Application, 2013-2020 ($Million)
Table 34 Blood Oxygen Sensor Market Volume, By Application, 2013-2020 (Million Units)
Table 35 Blood Oxygen Sensors Market Value, By Geography, 2013-2020 ($Million)
Table 36 Lactate Sensor Market Value, By Application, 2013-2020 ($Million)
Table 37 Lactate Sensor Market Volume, By Application, 2013-2020 (Million Units)
Table 38 Pedometer Market Value, By Application 2013-2020 ($Million)
Table 39 Pedometer Market Volume, By Application, 2013-2020 (Million Units)
Table 40 Pedometer Market Value, By Geography, 2013-2020 ($Million)
Table 41 Environment Sensor Market Application 2013-2020 ($Million)
Table 42 Environment Sensor Market Volume, By Application, 2013-2020 (Million Units)
Table 43 Environment Sensor Market Value, By Geography, 2013-2020 ($Million)
Table 44 Calorie Sensor Market Value, 2013-2020 ($Million)
Table 45 Calorie Sensor Market Volume, 2013-2020 (Million Units)
Table 46 Calorie Sensor Market Value, By Geography, 2013-2020 ($Million)
Table 47 Altitude Sensor Market Value, By Application, 2013-2020 ($Million)
Table 48 Altitude Sensor Market Volume, By Application, 2013-2020 (Million Units)
Table 49 Altitude Sensor Market Value, By Geography, 2013-2020 ($Million)
Table 50 Posture Sensor Market Value, 2013-2020 ($Million)
Table 51 Posture Sensor Market Volume, 2013-2020 (Million Units)
Table 52 Posture Sensor Market Value, By Geography, 2013-2020 ($Million)
Table 53 Temperature Sensors Market Value for Portable/Wearable Devices, By Application, 2013-2020 ($Million)
Table 54 Temperature Sensors Market Volume for Portable/Wearable Devices, By Application, 2013-2020 (Million Units)
Table 55 Blood Pressure Sensor Market Value for Portable/Wearable Devices, By Application, 2013-2020 ($Million)
Table 56 Blood Pressure Sensor Market Volume for Portable/Wearable Devices, By Application, 2013-2020 (Million Units)
Table 57 Blood Glucose Sensor Market Value for Portable/Wearable Devices, By Application, 2013-2020 ($Million)
Table 58 Blood Glucose Sensor Market Volume for Portable/Wearable Devices, By Application, 2013-2020 (Million Units)
Table 59 ECG Sensor Market Value for Portable/Wearable Devices, By Application, 2013-2020 ($Million)
Table 60 ECG Sensor Market Volume for Portable/Wearable Devices, By Application, 2013-2020 (Million Units)
Table 61 Motion Sensor Market Value for Portable/Wearable Devices, By Application, 2013-2020 ($Million)
Table 62 Motion Sensor Market Volume for Portable/Wearable Devices, By Application, 2013-2020 (Million Units)
Table 63 Heart Rate Sensor Market Value for Portable/Wearable Devices, By Application, 2013-2020 ($Million)
Table 64 Heart Rate Sensor Market Volume for Portable/Wearable Devices, By Application, 2013-2020 (Million Units)
Table 65 Touch Sensor Market Value for Portable/Wearable Devices, By Application, 2013-2020 ($Million)
Table 66 Touch Sensor Market Volume for Portable/Wearable Devices, By Application, 2013-2020 (Million Units)
Table 67 Sensors in Consumer Health: Market Value, By Geography, 2013-2020 ($Million)
Table 68 Banner Engineering Corporation: Company Snapshot
Table 69 Cambridge Temperature Concepts: Company Snapshot
Table 70 Ecardio Diagnostics: Company Snapshot
Table 71 Company Snapshot: Proteus Digital, Inc.
Table 72 Company Snapshot: Qualcomm Atheros Inc.
Table 73 Senseonics, Inc.: Company Snapshot
List of Figures (88 Figures)
Figure 1 Consumer Healthcare Market Segmentation, 2013
Figure 2 Market Research Methodology
Figure 3 Market Size Estimation
Figure 4 Market Crackdown and Data Triangulation
Figure 5 Evolution of Sensors
Figure 6 Sensors in the Consumer Healthcare Market: Impact Analysis of Market Drivers, 2013-2020
Figure 7 Sensors in Consumer Healthcare Market: Impact Analysis of Market Restraints, 2013-2020
Figure 8 Sensors in Consumer Healthcare Market: Impact Analysis of Market Opportunities, 2013-2020
Figure 9 Sensors Market in Consumer Healthcare Applications Value Chain
Figure 10 Sensor in Consumer Healthcare Market, Patent Analysis, 2007-2014
Figure 11 Company Wise Patent Analysis (2012-2014)
Figure 12 Porter�s Five force Analysis, 2013
Figure 13 Threat of New Entrants in Sensors in Consumer Healthcare Market, 2013
Figure 14 Threat of Substitutes in Sensors in Consumer Healthcare Market, 2013
Figure 15 Bargaining Power of the Suppliers, 2013
Figure 16 Bargaining Power of the Buyers, 2013
Figure 17 Degree of Competition, 2013
Figure 18 Electronic Sensor System
Figure 19 Typical Consumer Healthcare Application Schematic
Figure 20 Intelligent Pressure Sensing System
Figure 21 Types of Temperature Sensors
Figure 22 Image Sensor Applications
Figure 23 Types of Motion Sensors
Figure 24 Types of Pedometer
Figure 25 ECG Monitoring System
Figure 26 Types of Hemodymanic Monitoring
Figure 27 Sensors in Consumer Healthcare: Market Share Analysis, 2013
Figure 28 Sensor Market Share in Consumer Healthcare, By Growth Strategies, 2008�2014
Figure 29 3M: Company Snapshot
Figure 30 3M: Categorization of Products and Services
Figure 31 Ametek, inc.: Company Snapshot
Figure 32 Ametek, Inc.: Product Portfolio
Figure 33 Ametek, Inc.: SWOT Analysis
Figure 34 Analog Devices, Inc.: Company Snapshot
Figure 35 Analog Devices, Inc.: Product Portfolio
Figure 36 Analog Devices, Inc.: SWOT Analysis
Figure 37 Aptina Imaging Corporation: Product offerings
Figure 38 Atmel Corporation: Company Snapshot
Figure 39 Atmel Corporation: Product Portfolio
Figure 40 Avago Technologies: Company Snapshot
Figure 41 Avago Technologies: Products and Services
Figure 42 Banner Engineering Corporation: Product Portfolio
Figure 43 Danaher Corporation: Company Snapshot
Figure 44 Danaher Corporation: Products and Services
Figure 45 Ecardio Diagnostics: Categorization of Products and Services
Figure 46 Elmos Semiconductor AG: Company Snapshot
Figure 47 Elmos Semiconductor AG: Product Portfolio
Figure 48 Epcos AG: Product Portfolio
Figure 49 Freescale Semiconductor, Inc.: Company Snapshot
Figure 50 Freescale Semiconductor, Inc.: Products and Services
Figure 51 Freescale Semiconductor, Inc.: SWOT Analysis
Figure 52 Fujitsu Ltd.: Company Snapshot
Figure 53 Fujitsu Ltd.: Product Portfolio
Figure 54 Fujitsu Ltd.: SWOT Analysis
Figure 55 Ge Measurement & Control Solutions: Company Snapshot
Figure 56 Ge Measurement & Control Solution: Product Portfolio
Figure 57 Honeywell International, Inc.: Company Snapshot
Figure 58 Honeywell International, Inc.: Categorization of Products and Services
Figure 59 Honeywell International, Inc.: SWOT Analysis
Figure 60 Infineon Technologies AG: Company Snapshot
Figure 61 Infineon Technologies AG: Products and Services
Figure 62 Infineon Technologies AG: SWOT Analysis
Figure 63 Invensense, Inc.: Company Snapshot
Figure 64 Invensense, Inc.: Products and Services
Figure 65 Koninklijke Philips N.V.: Company Snapshot
Figure 66 Koninklijke Philips N.V.: Products and Services
Figure 67 Koninklijke Philips N.V.: SWOT Analysis
Figure 68 Maxim Integrated Products, Inc.: Company Snapshot
Figure 69 Maxim Integrated Products, Inc.: Products and Services
Figure 70 Measurement Specialties, Inc.: Company Snapshot
Figure 71 Measurement Specialties Inc.: Products and Services
Figure 72 Measurement Specialties, Inc.: SWOT Analysis
Figure 73 Melexis Corporation: Company Snapshot
Figure 74 Murata Manufacturing Co., Ltd.: Company Snapshot
Figure 75 Murata: Product Portfolio
Figure 76 Murata: SWOT Analysys
Figure 77 Proteus Digital Health, Inc.: Products and Services
Figure 78 Qualcomm Atheros Inc.: Product Portfolio
Figure 79 RF Technologies: Product offerings
Figure 80 Stmicroelectronics N.V.: Company Snapshot
Figure 81 Stmicroelectronics N.V.: Products and Services
Figure 82 Stmicroelectronics N.V.: SWOT Analysis
Figure 83 Texas Instruments, Inc.: Company Snapshot
Figure 84 Texas Instruments, Inc.: Products and Services
Figure 85 Texas Instruments, Inc.: SWOT Analysis
Figure 86 Toshiba Corporation: Company Snapshot
Figure 87 Toshiba Corporation: Product & Services
Figure 88 Vancive Medical Technologies: Product offerings


Growth opportunities and latent adjacency in Sensor Market
Looking for market share data in healthcare, sports, and wearables markets with respect to pressure, stretch, and shear sensors.