Vehicle Diagnostics Market by Vehicle Type, Application (Automatic Crash Notification, Vehicle Tracking, Vehicle Health Alert, and Roadside Assistance) Connectivity (3G, 4G LTE, Wi-Fi, and Bluetooth) Region, and Aftermarket (Vehicle Type and Region) - Forecast to 2021


[144 Pages Report] The vehicle diagnostics market was estimated to be USD 13.91 Billion in 2016, and is projected to grow to USD 30.22 Billion by 2021, registering a CAGR of 16.79% from 2016 to 2021. The increasing demand for luxury passenger cars, growing need for emergency support, and increasing premium vehicle sales are key drivers of the market. In this study, 2015 has been considered as the base year, 2016 as the estimated year, and 2021 as the forecast year.
The primary objective of the study is to define, describe, and forecast the vehicle diagnostics market on the basis of region, vehicle type, application, connectivity, and aftermarket. It also provides detailed information regarding major factors influencing the growth of the market (drivers, restraints, opportunities, and challenges).
The research methodology used in the report involves several primary and secondary sources. Secondary sources include industry association publications, technical handbooks, directories, World Economic Outlook, technical articles, trade websites, and paid databases such as Factiva and Bloomberg. Experts from OEMs, Tier I, II, and III companies, related industries, and suppliers of vehicle diagnostics solutions have been interviewed to understand the future trends in the vehicle diagnostics market. The bottom-up approach has been used to estimate the market size, in terms of volume. Vehicle models with vehicle diagnostics solutions have been identified at a country level to derive the market. The value derived has then been summed up to acquire the total value of the market at a country level. The summation of the country-wise market size, in terms of value, has provided the regional market size, and further summation of the regional level market size has resulted in the global market size. The figure below illustrates the break-up of the profile of industry experts who participated in primary discussions.
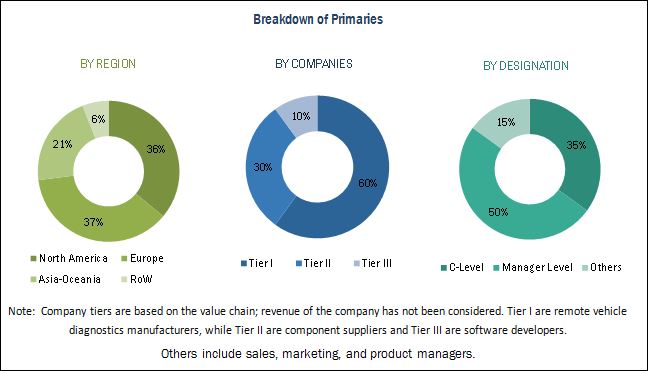
To know about the assumptions considered for the study, download the pdf brochure
The vehicle diagnostics market ecosystem consists of manufacturers such as Robert Bosch GmbH (Germany), Continental AG (Germany), OnStar LLC (U.S.), Mercedes-Benz (U.S.), Subaru of America, Inc. (U.S.), BMW (Germany), Magneti Marelli S.p.A (Italy), Delphi Automotive PLC (U.K.), Softing AG (Germany), Voxx International Corporation (U.S.), Snap-On Inc. (U.S.), and Vector Informatik GmbH (Germany).
Target Audience
- vehicle diagnostics solution providers
- vehicle diagnostics solution software developers
- Distributors and suppliers of vehicle diagnostics solutions
- Independent and authorized dealers of vehicle diagnostics solutions
- Industry associations and experts
Scope of the Report
-
By Region
- Asia-Oceania
- Europe
- North America
- Rest of the World (RoW)
-
By Vehicle Type
- Light-Duty Vehicle
- Commercial Vehicle
-
By Connectivity
- 4G LTE
- 3G
- Bluetooth
- Wi-Fi
-
By Application
- Automatic Crash Notification
- Vehicle Tracking
- Vehicle Health Alert
- Roadside Assistance
- Aftermarket
Available Customizations
MarketsandMarkets offers the following customizations for this market:
-
Vehicle Diagnostics for OE Market, by Heavy Commercial Vehicle Type
-
Heavy Commercial Vehicle
- Truck
- Bus
-
Heavy Commercial Vehicle
-
Vehicle Diagnostics Aftermarket, by Commercial Vehicle Type
-
Commercial Vehicle
- Light commercial vehicle
- Truck
- Bus
-
Commercial Vehicle
-
Vehicle Diagnostics (OE) Market, by Region,
-
(Further breakdown of the rest of Europe into country-level markets)
- Spain
- Portugal
- The Netherlands
- Sweden
-
(Further breakdown of the rest of Europe into country-level markets)
The global vehicle diagnostics market is projected to grow at a CAGR of 16.79% from 2016 to 2021, to reach a market size of USD 30.22 Billion by 2021. Stringent emission norms, the rising demand for safety and security in vehicles, and the growing inclination towards premium vehicles are expected to propel the growth of the market.
The market, by application, is dominated by the roadside assistance segment, which is estimated to be the largest market, in terms of volume, during the forecast period. The high demand for roadside assistance as a standard feature in vehicles is attributed to the advantages it offers, including assistance at the time of a vehicle breakdown, emergency support, and sending a mechanic in case of critical failure. The market for such applications is witnessing substantial growth, with regulatory bodies planning to mandate some of the applications.
Bluetooth technology is estimated to hold the largest share in the vehicle diagnostics market, by connectivity. This trend is expected to continue during the forecast period. Bluetooth technology is primarily used to enable in-car connectivity between a vehicle?s dashboard and electronic gadgets such as smartphones, laptops, and tablets. Given the increasing demand from end-users to incorporate smartphone features such as navigation, diagnostics, and infotainment inside the vehicle, Bluetooth technology has become an essential feature in vehicles.
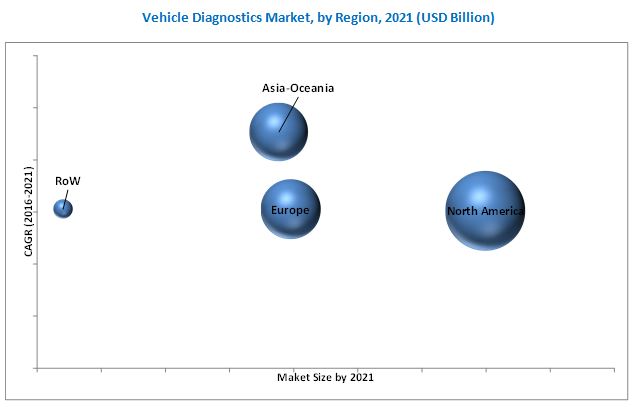
The North American region is estimated to be the largest market for vehicle diagnostics during the forecast period. This can be attributed to the high adoption rate of innovations and advanced technology in the region. Additionally, the demand for premium cars with advanced safety and security features is high in this region. North America has some of the most stringent regulations for vehicle safety, emissions, and fuel economy in the world; this is expected to boost the market for vehicle diagnostics in the region.
To know about the assumptions considered for the study, download the pdf brochure
A key factor restraining the growth of the vehicle diagnostics market is data security and privacy concerns. Owing to the increased number of electronic components in the vehicle, additional data has to be diagnosed on a real-time basis. The need to provide real-time information would bring about the threat of cybersecurity. This would adversely affect the market.
The global vehicle diagnostics market is dominated by established players such as Robert Bosch GmbH (Germany), Continental AG (Germany), OnStar LLC (U.S.), Magneti Marelli S.p.A (Italy), Delphi Automotive PLC (U.K.), Softing AG (Germany), Voxx International Corporation (U.S.), Snap-On Inc. (U.S.), and Vector Informatik GmbH (Germany). These companies have been focusing on new product development and collaborating with key local organizations to expand their presence in the global market. OnStar LLC is currently the market leader, and has adopted expansion a key strategy to gain traction in emerging markets. For instance, in 2016, the company entered the Argentinian market to expand its presence in South America.
To speak to our analyst for a discussion on the above findings, click Speak to Analyst
 Exclusive indicates content/data unique to MarketsandMarkets and not available with any competitors.
Table of Contents
1 Introduction (Page No. - 15)
1.1 Objectives of the Study
1.2 Market Definition
1.3 Market Scope
1.3.1 Markets Covered
1.3.2 Years Considered for the Study
1.4 Currency
1.5 Limitations
1.6 Stakeholders
2 Research Methodology (Page No. - 19)
2.1 Research Data
2.2 Secondary Data
2.2.1 Key Secondary Sources
2.2.2 Key Data From Secondary Sources
2.3 Primary Data
2.3.1 Sampling Techniques & Data Collection Methods
2.3.2 Primary Participants
2.4 Factor Analysis
2.4.1 Introduction
2.4.2 Demand-Side Analysis
2.4.2.1 Impact of Population on Total Vehicle Sales
2.4.2.2 Rising Demand for Hybrid & Electric Vehicles
2.4.2.3 Urbanization vs PCS Per 1,000 People
2.4.3 Supply-Side Analysis
2.4.3.1 Technological Advancements
2.5 Market Estimation
2.5.1 Bottom-Up Approach
2.5.2 Top-Down Approach
2.5.3 Market Breakdown & Data Triangulation
2.5.4 Assumptions
3 Executive Summary (Page No. - 31)
3.1 Vehicle Diagnostics Market, By Region
3.2 Market, By Application
3.3 Market, By Connectivity
3.4 Vehicle Diagnostics Aftermarket, By Region
3.5 Market: Growth Trends
4 Premium Insights (Page No. - 37)
4.1 Introduction
4.2 Attractive Opportunities in the Vehicle Diagnostics Market
4.3 Market Share, By Country (Value), 2016
4.4 Market Share, By Vehicle Type (Value), 2016?2021
4.5 Market, By Application (Volume), 2016?2021
4.6 Market, By Region (Value), 2016 - 2021
4.7 Market, By Connectivity (Value), 2016?2021
4.8 Vehicle Diagnostics Aftermarket, By Region (Value), 2016?2021
5 Market Overview (Page No. - 41)
5.1 Introduction
5.2 Market Segmentation
5.2.1 By Application
5.2.2 By Region
5.2.3 By Connectivity
5.2.4 By Vehicle Type
5.2.5 By Aftermarket
5.3 Market Dynamics
5.3.1 Drivers
5.3.1.1 Pressure From OEMS to Improve Vehicle Performance & Collect Relevant Data
5.3.1.2 Increasingly Stringent Emission & Fuel Economy Regulations
5.3.1.3 Rising Demand for Luxury & Comfort
5.3.1.4 Introduction of Rde Test
5.3.2 Restraints
5.3.2.1 Data Security Concerns
5.3.3 Opportunities
5.3.3.1 Opportunities for Tsps
5.3.3.2 Benefits for Fleet Operators & Insurance Companies
5.3.4 Challenges
5.3.4.1 Low-Cost Devices in the Aftermarket
5.4 Porter?s Five Forces Analysis
5.4.1 Vehicle Diagnostics Market
5.4.1.1 Intensity of Competitive Rivalry
5.4.1.2 Threat of New Entrants
5.4.1.3 Threat of Substitutes
5.4.1.4 Bargaining Power of Suppliers
5.4.1.5 Bargaining Power of Buyers
6 Vehicle Diagnostics, By Region, Vehicle, & Engine Type (Page No. - 59)
6.1 Introduction
6.2 Vehicle Diagnostic Market, By Region
6.3 Vehicle Diagnostic Market, By Vehicle Type
6.4 North America, By Vehicle & Engine Type
6.4.1 U.S.: Vehicle Diagnostics Market, By Vehicle & Engine Type
6.4.2 Mexico: Market, By Vehicle & Engine Type
6.4.3 Canada: Market, By Vehicle & Engine Type
6.5 Europe, By Vehicle & Engine Type
6.5.1 Germany: Market, By Vehicle & Engine Type
6.5.2 U.K.: Market, By Vehicle & Engine Type
6.5.3 France: Market, By Vehicle & Engine Type
6.5.4 Italy: Market, By Vehicle & Engine Type
6.6 Asia-Oceania, By Vehicle & Engine Type
6.6.1 China: Market, By Vehicle & Engine Type
6.6.2 Japan: Vehicle Diagnostics Market, By Vehicle & Engine Type
6.6.3 South Korea: Market, By Vehicle & Engine Type
6.6.4 India: Vehicle Diagnostics Market Size
6.7 RoW, By Vehicle & Engine Type
6.7.1 Brazil: Vehicle Diagnostics Market, By Vehicle & Engine Type
6.7.2 Russia: Market, By Vehicle & Engine Type
7 Vehicle Diagnostics, By Application (Page No. - 83)
7.1 Introduction
7.2 Vehicle Diagnostics Market, By Application
7.2.1 Acn Market, By Region
7.2.2 Vehicle Tracking Market, By Region
7.2.3 Vehicle Health Alert Market, By Region
7.2.4 Roadside Assistance Market, By Region
8 Vehicle Diagnostics Market, By Connectivity (Page No. - 96)
8.1 Introduction
8.2 Vehicle Diagnostics Market, By Connectivity
8.3 4G Lte Market, By Region
8.4 3G Market, By Region
8.5 Wi-Fi Market, By Region
8.6 Bluetooth Market, By Region
9 Vehicle Diagnostics Aftermarket, By Region (Page No. - 101)
9.1 Introduction
9.2 Vehicle Diagnostic Aftermarket, By Region
9.3 Light-Duty Vehicle Diagnostic Aftermarket, By Region
9.4 CV Vehicle Diagnostic Aftermarket, By Region
10 Vehicle Diagnostics, By Engine Type
10.1 Introduction
10.2 Vehicle Diagnostics Market, By Engine Type
10.2.1 ICE Market
10.2.2 BEV Market
10.2.3 HEV Market
11 Competitive Landscape (Page No. - 107)
11.1 Introduction
11.2 Company Ranking
11.3 Competitive Situation & Trends
11.4 New Product Launch
11.5 Agreements/ Joint Ventures/ Supply Contracts/ Partnerships
11.6 Mergers & Acquisitions
11.7 Expansion
12 Company Profiles (Page No. - 113)
(Company at A Glance, Business Overview, Products Offered, Key Strategy, Recent Developments, SWOT Analysis & MnM View)*
12.1 Introduction
12.2 Robert Bosch GmbH
12.3 Continental AG
12.4 Delphi Automotive PLC
12.5 Onstar LLC
12.6 Snap-On Inc.
12.7 Magneti Marelli
12.8 Softing AG
12.9 VOXX International Corporation
12.10 Vector Informatik
12.11 Vidiwave Ltd.
*Details on Company at A Glance, Recent Financials, Products Offered, Strategies & Insights, & Recent Developments Might Not Be Captured in Case of Unlisted Companies.
13 Appendix (Page No. - 136)
13.1 Insights of Industry Experts
13.2 Additional Recent Developments
13.3 Available Customizations
13.3.1 Vehicle Diagnostics for (OE) Market, By Heavy CV
13.3.1.1 Heavy CV
13.3.1.1.1 Trucks
13.3.1.1.2 Buses
13.3.2 Vehicle Diagnostics Aftermarket, By CV
13.3.2.1 CV
13.3.2.1.1 Light CV
13.3.2.1.2 Trucks
13.3.2.1.3 Buses
13.3.3 Vehicle Diagnostics (OE) Market, By Region
13.3.3.1 Spain
13.3.3.2 Portugal
13.3.3.3 The Netherlands
13.3.3.4 Sweden
13.4 Discussion Guide
13.5 Knowledge Store: Marketsandmarkets? Subscription Portal
13.6 Introducing RT: Real Time Market Intelligence
13.7 Related Reports
13.8 Author Details
List of Tables (81 Tables)
Table 1 Government Incentives for Electric Vehicles
Table 2 Vehicle Diagnostics Market: By Application
Table 3 Market: By Connectivity
Table 4 PCS With Vehicle Diagnostics Applications
Table 5 Luxury Vehicle Sales of Key Manufacturers, China, 2013?2015
Table 6 Luxury Vehicle Sales of Key Manufacturers, India, 2013?2015
Table 7 Porter?s Five Forces Analysis
Table 8 Market Size, By Region, 2015?2021 (??000 Units)
Table 9 Market Size, By Region, 2015?2021 (USD Million)
Table 10 Market Size, By Vehicle Type, 2015?2021 (?000 Units)
Table 11 Vehicle Diagnostics Market Size, By Vehicle Type, 2015?2021 (USD Million)
Table 12 North America: Market Size, By Vehicle & Engine Type, 2015?2021 (?000 Units)
Table 13 North America: Market Size, By Vehicle & Engine Type, 2015?2021 (USD Million)
Table 14 U.S.: Market Size, By Vehicle & Engine Type, 2015?2021 (?000 Units)
Table 15 U.S.: Market Size, By Vehicle & Engine Type, 2015?2021 (USD Million)
Table 16 Mexico: Market Size, By Vehicle & Engine Type, 2015?2021 (?000 Units)
Table 17 Mexico: Market Size, By Vehicle & Engine Type, 2015?2021 (USD Million)
Table 18 Canada: Market Size, By Vehicle & Engine Type, 2015?2021 (?000 Units)
Table 19 Canada: Market Size, By Vehicle & Engine Type, 2015?2021 (USD Million)
Table 20 Europe: Market Size, By Engine Type & Vehicle Type, 2015?2021 (?000 Units)
Table 21 Europe: Market Size, By Vehicle & Engine Type, 2015?2021 (USD Million)
Table 22 Germany: Vehicle Diagnostics Market Size, By Vehicle & Engine Type, 2015?2021 (?000 Units)
Table 23 Germany: Market Size, By Vehicle & Engine Type, 2015?2021 (USD Million)
Table 24 U.K.: Market Size, By Vehicle & Engine Type, 2015?2021 (?000 Units)
Table 25 U.K.: Market Size, By Vehicle & Engine Type, 2015?2021 (USD Million)
Table 26 France: Market Size, By Vehicle & Engine Type, 2015?2021 (?000 Units)
Table 27 France: Market Size, By Vehicle & Engine Type, 2015?2021 (USD Million)
Table 28 Italy: Market Size, By Vehicle & Engine Type, 2015?2021 (?000 Units)
Table 29 Italy: Market Size, By Vehicle & Engine Type, 2015?2021 (USD Million)
Table 30 Asia-Oceania: Market Size, By Vehicle & Engine Type, 2015?2021 (?000 Units)
Table 31 Asia-Oceania: Market Size, By Vehicle & Engine Type (USD Million)
Table 32 China: Market Size, By Vehicle & Engine Type (?000 Units)
Table 33 China: Market Size, By Vehicle & Engine Type (USD Million)
Table 34 Japan: Market Size, By Vehicle & Engine Type, 2015?2021 (?000 Units)
Table 35 Japan: Vehicle Diagnostics Market Size, By Vehicle & Engine Type, 2015?2021 (USD Million)
Table 36 South Korea: Market Size, By Vehicle & Engine Type, 2015?2021 (?000 Units)
Table 37 South Korea: Market Size, By Vehicle & Engine Type, 2015?2021 (USD Million)
Table 38 India: Market Size, By Vehicle & Engine Type, 2015?2021 (?000 Units)
Table 39 India: Market Size, By Vehicle & Engine Type, 2015?2021 (USD Million)
Table 40 RoW: Market Size, By Vehicle & Engine Type, 2015?2021 (?000 Units)
Table 41 RoW: Market Size, By Vehicle & Engine Type, 2015?2021 (USD Million)
Table 42 Brazil: Market Size, By Vehicle & Engine Type, 2015?2021 (?000 Units)
Table 43 Brazil: Market Size, By Vehicle & Engine Type, 2015?2021 (USD Million)
Table 44 Russia: Vehicle Diagnostics Market Size, By Vehicle & Engine Type, 2015?2021 (?000 Units)
Table 45 Russia: Market Size, By Vehicle & Engine Type, 2015?2021 (USD Million)
Table 46 Market Size, By Application, 2015?2021 (?000 Units)
Table 47 Acn: Market Size, By Region, 2015?2021 (?000 Units)
Table 48 North America: Acn Market Size, By Country, 2015?2021 (?000 Units)
Table 49 Europe: Acn Market Size, By Country, 2015?2021 (?000 Units)
Table 50 Asia-Oceania: Acn Market Size, By Country, 2015?2021 (?000 Units)
Table 51 RoW: Acn Market Size, By Country, 2015?2021 (?000 Units)
Table 52 Vehicle Tracking: Vehicle Diagnostics Market Size, By Region, 2015?2021 (?000 Units)
Table 53 North America: Vehicle Tracking Market Size, By Country, 2015?2021 (?000 Units)
Table 54 Europe: Vehicle Tracking Market Size, By Country, 2015?2021 (?000 Units)
Table 55 Asia-Oceania: Vehicle Tracking Market Size, By Country, 2015?2021 (?000 Units)
Table 56 RoW: Vehicle Tracking Market Size, By Country, 2015?2021 (?000 Units)
Table 57 Vehicle Health Alert: Market Size, By Region, 2015?2021 (?000 Units)
Table 58 North America: Vehicle Health Alert Market Size, By Country, 2015?2021 (?000 Units)
Table 59 Europe: Vehicle Health Alert Market Size, By Country, 2015?2021 (?000 Units)
Table 60 Asia-Oceania: Vehicle Health Alert Market Size, By Country, 2015?2021 (?000 Units)
Table 61 RoW: Vehicle Health Alert Market Size, By Country, 2015?2021 (?000 Units)
Table 62 Roadside Assistance: Vehicle Diagnostics Market Size, By Region, 2015?2021 (?000 Units)
Table 63 North America: Roadside Assistance Market Size, By Country, 2015?2021 (?000 Units)
Table 64 Europe: Roadside Assistance Market Size, By Country, 2015?2021 (?000 Units)
Table 65 Asia-Oceania: Roadside Assistance Market Size, By Country, 2015?2021 (?000 Units)
Table 66 RoW: Roadside Assistance Market Size, By Country, 2015?2021 (?000 Units)
Table 67 Vehicle Diagnostics Market Size, By Connectivity, 2015?2021 (USD Million)
Table 68 4G Lte: Market Size, By Region, 2015?2021 (USD Million)
Table 69 3G: Market Size, By Region, 2015?2021 (USD Million)
Table 70 Wi-Fi: Market Size, By Region, 2015?2021 (USD Million)
Table 71 Bluetooth: Market Size, By Region, 2015?2021 (Million)
Table 72 Vehicle Diagnostics Aftermarket Size, By Region, 2015?2021 (?000 Units)
Table 73 Vehicle Diagnostics Aftermarket Size, By Region, 2015?2021 (USD Million)
Table 74 LDV: Vehicle Diagnostics Aftermarket Size, By Region, 2015?2021 (?000 Units)
Table 75 LDV: Vehicle Diagnostics Aftermarket Size, By Region, 2015?2021 (USD Million)
Table 76 CV: Vehicle Diagnostics Aftermarket Size, By Region, 2015?2021 (?000 Units)
Table 77 CV: Vehicle Diagnostics Aftermarket Size, By Region, 2015?2021 (USD Million)
Table 78 New Product Launch, 2013?2016
Table 79 Agreements/ Joint Ventures/ Supply Contracts/ Partnerships, 2013?2016
Table 80 Mergers & Acquisitions, 2012 - 2016
Table 81 Expansions, 2012?2016
List of Figures (53 Figures)
Figure 1 PC Vehicle Diagnostics Market Segmentation
Figure 2 Market: Research Design
Figure 3 Research Design Model
Figure 4 Breakdown of Primary Interviews: By Company Type, Designation, & Region
Figure 5 Impact of Population on Vehicle Sales, 2014
Figure 6 Urbanization vs PC Per 1,000 People
Figure 7 Market Size Estimation Methodology: Bottom-Up Approach
Figure 8 Market Size Estimation Methodology: Top-Down Approach
Figure 9 Data Triangulation
Figure 10 North America is Estimated to Hold the Largest Share in the Vehicle Diagnostics Market, 2016?2021 (USD Billion)
Figure 11 Roadside Assistance is Estimated to Hold the Largest Market Share, 2016?2021 (?000 Units)
Figure 12 Bluetooth is Estimated to Account for the Largest Share in the Market, 2016?2021 (USD Million)
Figure 13 North America is Expected to Account for the Largest Share in the Vehicle Diagnostics Aftermarket, 2016?2021 (USD Billion)
Figure 14 India & China are Projected to Be the Fastest Growing Markets During the Forecast Period (USD Billion)
Figure 15 Increasing Demand for Safety & Security in Vehicles is Expected to Drive the Market
Figure 16 U.S. & Germany are Estimated to Hold the Largest Shares in the Vehicle Diagnostics Market in 2016
Figure 17 Market, By Vehicle Type (Volume vs Value), 2016?2021
Figure 18 Market Size, By Application, 2016?2021, (Million Units)
Figure 19 Market Size, By Region, 2016 vs 2021 (USD Billion)
Figure 20 Market Size, By Connectivity, 2016?2021 (USD Million)
Figure 21 Vehicle Diagnostics Aftermarket Size, By Region, 2016?2021 (USD Billion)
Figure 22 Vehicle Diagnostics Market: Market Dynamics
Figure 23 PC Emission Limits: Europe vs the U.S.
Figure 24 Porter?s Five Forces Analysis: Market
Figure 25 Intensity of Competitive Rivalry in the Market is Considered Medium
Figure 26 Limited Or No Product Differentiation Leads to Medium Degree of Competition in the Vehicle Diagnostics Market
Figure 27 Well-Established Companies & High Initial Investment Will Result in Low Impact of New Entrants
Figure 28 Limited Availability of Substitutes Makes the Threat of Substitutes Low
Figure 29 Intense Competition Among Existing Suppliers Makes the Bargaining Power of Suppliers Medium
Figure 30 Buyer?s Bargaining Power is Rated Medium Owing to Low Product Differentiation & Limited Awareness Among Users
Figure 31 Vehicle Diagnostics Market Outlook, By Volume (2016): North America is Estimated to Account for the Largest Market Share During the Forecast Period
Figure 32 The U.S. is Projected to Lead the North American Market By 2021
Figure 33 Germany is Estimated to Be the Largest Market for Vehicle Diagnostics in Europe During the Forecast Period (USD Billion)
Figure 34 China is Estimated to Be the Largest Contributor to the Asia-Oceania Market
Figure 35 Roadside Assistance to Be the Largest Segment of the Market, By Application, 2016?2021 (Million Units)
Figure 36 Bluetooth Segment is Estimated to Lead the Vehicle Diagnostics Market, By Connectivity, 2016
Figure 37 North America is Estimated to Lead the Vehicle Diagnostics Aftermarket, By Volume, 2016-2021 (Million Units)
Figure 38 Companies Adopted New Product Launch as the Key Growth Strategy From 2012 to 2016
Figure 39 Market Evolution Framework: New Product Launches are Expected to Boost Growth During the Forecast Period
Figure 40 Battle for Market Share: New Product Launch Was the Key Strategy Adopted
Figure 41 Robert Bosch GmbH: Company Snapshot
Figure 42 Robert Bosch GmbH: SWOT Analysis
Figure 43 Continental AG: Company Snapshot
Figure 44 Continental AG: SWOT Analysis
Figure 45 Delphi Automotive PLC: Company Snapshot
Figure 46 Delphi Automotive PLC: SWOT Analysis
Figure 47 Onstar LLC: SWOT Analysis
Figure 48 Snap-On Inc.: Company Snapshot
Figure 49 Snap-On Inc.: SWOT Analysis
Figure 50 Magneti Marelli: Company Snapshot
Figure 51 Softing AG: Company Snapshot
Figure 52 VOXX International Corporation: Company Snapshot
Figure 53 Vector Informatik: Company Snapshot
The study involved four major activities in estimating the current size of the in-vehicle infotainment market. Exhaustive secondary research was done to collect information on the market, the peer market, and the parent market. The next step was to validate these findings, assumptions, and sizing with the industry experts across value chains through primary research. The bottom-up and top-down approaches were employed to estimate the complete market size. Thereafter, market breakdown and data triangulation processes were used to estimate the market size of segments and subsegments.
Secondary Research
In the secondary research process, various secondary sources such as company annual reports/presentations, press releases, industry association publications [such as publications of OEMs, Canadian Automobile Association (CAA), country-level automotive associations and trade organizations, and the US Department of Transportation (DOT)], in-vehicle infotainment magazine articles, directories, technical handbooks, World Economic Outlook, trade websites, and technical articles have been used to identify and collect information useful for an extensive commercial study of the global in-vehicle infotainment market.
Primary Research
In the primary research process, various primary sources from both supply and demand sides were interviewed to obtain qualitative and quantitative information on the market. The primary sources from the supply side included various industry experts, such as CXOs, vice presidents, directors from business development, marketing, product development/innovation teams, and related key executives from various key companies. Various system integrators, industry associations, independent consultants/industry veterans, and key opinion leaders were also interviewed.
Primary interviews have been conducted to gather insights such as vehicle production forecast, in-vehicle infotainment market forecast, future technology trends, and upcoming technologies in the in-vehicle infotainment industry. Data triangulation of all these points was done with the information gathered from secondary research as well as model mapping. Stakeholders from demand as well as supply side have been interviewed to understand their views on the points mentioned above.
Primary interviews have been conducted with market experts from both the demand- (OEMs) and supply-side (in-vehicle infotainment solution and service providers) players across four major regions, namely, North America, Europe, Asia Pacific, and Rest of the World. Approximately 20% and 80% of primary interviews have been conducted from the demand and supply sides, respectively. Primary data has been collected through questionnaires, emails, and telephonic interviews. In the canvassing of primaries, we have strived to cover various departments within organizations, such as sales and operations, to provide a holistic viewpoint in our report.
After interacting with industry experts, we have also conducted brief sessions with highly experienced independent consultants to reinforce the findings from our primaries. This, along with the in-house subject matter experts’ opinions, has led us to the findings as described in the remainder of this report.
To know about the assumptions considered for the study, download the pdf brochure
Market Size Estimation
The top-down and bottom-up approaches were used to estimate and validate the total market size. These methods were also used extensively to estimate the size of various subsegments in the market. The research methodology used to estimate the market size includes the following:
- The key players in the industry and markets have been identified through extensive secondary research
- The industry’s supply chain and market size, in terms of value, have been determined through primary and secondary research processes
- All percentage shares, splits, and breakdowns have been determined using secondary sources and verified through primary sources
Data Triangulation
After arriving at the overall market size-using the market size estimation processes as explained above-the market was split into several segments and subsegments. To complete the overall market engineering process and arrive at the exact statistics of each market segment and subsegment, data triangulation and market breakdown procedures were employed, wherever applicable. The data was triangulated by studying various factors and trends from both the demand and supply sides.
Report Objectives
-
To define, describe, and forecast the in-vehicle infotainment market in terms of value (USD million) and volume (thousand units) that includes the following segments:
- By Vehicle Type {Passenger Car, Light Commercial Vehicle (LCV), and Heavy Commercial Vehicle (HCV)}
- By Component (Infotainment/Display Unit, Control Panel, Telematics Control Unit, and Head-Up Display)
- By Operating System (Linux, QNX, Microsoft, and Others)
- By Services (Entertainment Services, Navigation Services, E-call, Vehicle Diagnostics, and Others)
- By Location (Front Row and Rear Row)
- By Connectivity (3G, 4G, and 5G)
- By Form (Embedded, Tethered, and Integrated)
- By Region (Asia Pacific, Europe, North America, and RoW)
- To understand the dynamics (drivers, restraints, opportunities, and challenges) of the in-vehicle infotainment market
- To analyze the market ranking of key players operating in the in-vehicle infotainment market
- To understand dynamics of in-vehicle infotainment market competitors in terms of hardware and software providers and distinguish them into visionary leaders, innovators, emerging companies, and dynamic differentiators according to their product portfolio and business strategy
- To analyze recent developments, collaborations, joint ventures, mergers & acquisitions, new product launches, and other activities carried out by key industry participants in the in-vehicle infotainment market
- To determine the average selling price (ASP) of in-vehicle infotainment and analyze revenue missed scenarios
- To determine pessimistic scenarios, most likely scenarios, and optimistic scenarios related to the in-vehicle infotainment market
- To give a brief understanding of the in-vehicle infotainment market in the recommendations chapter
Available Customizations
With the given market data, MarketsandMarkets offers customizations in accordance to the company’s specific needs.
In-Vehicle Infotainment Market, Form Type By Country:
- Embedded
- Tethered
- Integrated
In-Vehicle Infotainment Market, By Electric Vehicle, By Region
- BEV
- HEV
- PHEV


Growth opportunities and latent adjacency in Vehicle Diagnostics Market
Looking to understand what is included in the report. Is both diagnostic scan and re-programming included? Could you send a sample of the report?
I would like to know the section of companies lists and market share in North America to evaluate the info before the purchasing. Thanks
Looking to obtain market insight regarding total market size and breakdown by region with dominant players in each market/segment
Hello - with regard to customisation, I am only interested in USA and Western Europe - would the report be cheaper with only these regions? Thanks