Power System State Estimator Market By Software Type (Utility & Power Control Centers), Application (Transmission & Distribution Networks) and Solution Methods (WLS, LAV, Kalman Filter, Bayesian, Newton Gaussian) - Global Trends & Forecasts To 2019


[185 pages report] This report analyzes and projects the power system state estimator market by value. The global market has been broken down into regions, which cover all major geographic markets.
Power system state estimator help in the monitoring, supervising, and controlling of transmission and distribution networks. The growing and complex nature of transmission and distribution networks, the advent of smart grids, and government regulations favoring energy efficient systems are driving the market. However, a lack of well-defined industry standards for state estimation is expected to be a major challenge for growth in the power system state estimator market. It can be applied in transmission networks, with distribution networks utilizing them on a comparatively lower scale. Most of the companies in the power system state estimator market use agreements, collaborations, joint ventures, and partnerships as the primary strategic approach for growth.
Various secondary sources such as government databases, facts published by multinational agencies, encyclopedias, associations, and directories have been used to compile information while preparing this commercial study on power system state estimator. Primary data sources include experts from the industry, discussions, and surveyshave been instrumental in offering important pieces of information as well as confirming future trends.
We have profiled leading players of this industryalong with their recent developments and other strategic industry activities. Some of the key companies profiled include Open Systems International Inc. (U.S.), General Electric (U.S.), Nexant (U.S.), ETAP/Operation Technology Inc. (U.S.), CYME International (Canada), ABB Ltd. (Switzerland), Siemens AG (Germany), DIgSILENT GmbH (Germany), Neplan AG (Switzerland), Alstom (France), Energy Computer Systems Ltda (Colombia), Electrocon International, Inc (U.S.), and GDF SUEZ S.A. (France).
The global power system state estimator market has been segmented into five regions, namely North America, Europe, Asia-Pacific, the Middle East& Africa, and Latin America. The market has also been segmented on the basis of types, applications, and solution methods. North America is the largest regional market for power system state estimator in terms of value, while Latin America has the highest projected CAGR.
The report also touches on other important aspects of the power system state estimator market, such as aspects of the value-chain, drivers, restraints/challenges, opportunities, and the competitive landscape of the market.
The global power system state estimator market is estimated to reach $5.87 Billion by 2019 from $3 billion in 2014, with a projected CAGR (Compound Annual Growth Rate) of 14.35%, signifying a high demand for state estimator and increasing concern for energy savings.
Effective monitoring and control of the grid requires real-time analysis tools that can estimate the system state and also predict its response to changing load and weather conditions. Thus, power system analysis requires dynamic network topology and real-time measurements. State estimation is the process of assigning a value to an unknown system state variable, based on measurements from that system based on preset criteria.
The process involves imperfect measurements that are redundant and the process of estimating the system states is based on a statistical criterion that takes into account the true value of state variables to minimize or maximize the selected criterion.
In a power system, state variables are the voltage MAGNITUDES and Relative Phase Angles at the System Nodes. The inputs to an estimator are imperfect power system measurements of voltage magnitude and power, VAR, or ampere flow quantities. The estimator is designed to produce the �best estimate� of the system voltage and phase angles, recognizing that there are errors in the measured quantities and that they may be redundant measurements.
With more smart metering devices being deployed on the grid, power system analysis receives data with higher accuracy and resolution. However, wide deployment of metering devices is limited owing to their high price. When metering devices are installed at key locations on the grid, state estimation can serve as a useful technique to fill-in the missing points as well as smooth-out noisy measurements. The estimation result reflects the true state of the circuit parameters such as bus voltages, real, and reactive power flow on the branches.
Increasing the consumption and Utilities pushing towards minimizing the T&D losses and outages, drive the Power System State Estimator market.
The Energy Policy Act of 2005 in the U.S. offers a tax deduction of $1.80 per sq. foot for commercial buildings equipped with energy efficient installations. The Energy Conservation Act of 2001 in India aims at improving energy efficiency, by developing and recommending norms and standards for energy consumption.
The global rollout of smart grids also pushes the power system state estimator market. North America and Europe are leaders in the smart grid rollouts and Asia-Pacific, Latin America, and the Middle East are also planning smart grid policies across their regions.
To mitigate risks from the blackouts, Utilities have been adopting sophisticated monitoring of the network through the deployment of state estimators.
The biggest market for power system state estimator is North America and Europe. The fast growth rate of the Latin American market can be attributed to increasing investments on preventive steps taken up by countries to curb energy loss and theft, thereby increasing the demand for smart infrastructure.
Power System State Estimator Market Share, by Region, 2014
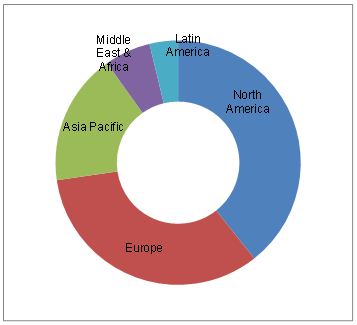
Source: MarketsandMarkets Analysis
Siemens AG (Germany), ABB (Switzerland) from the real time; and Open Systems International, Inc. (U.S.), DigSilent (Germany), Energy Computer Systems (Spain) from offline - are the major playersthat constitute amajor share of the global power system state estimator market.
Product/Service offering and Collaboration: Key Strategy
Most of these companies mainly rely on growth strategies such asjoint ventures & contracts, mergers & acquisitions, and investments & expansions in diversified geographic areas. The market for power system state estimator is technology driven and product/service offering plays a major part. To increase their market penetration and market share, companies opt for new product launches to offer differentiated products/service offerings.
The major software types of state estimators include Utility state estimation software and power control center software. It has also Transmission and Distribution as two applications.
 Exclusive indicates content/data unique to MarketsandMarkets and not available with any competitors.
Table of Contents
1 Introduction (Page No.- 13)
1.1 Research Overview
1.1.1 Purpose and Scope
1.1.2 Report Description
1.1.3 Key Take-Aways
1.2 Research Methodology
1.2.1 Secondary and Primary Research
1.2.1.1 Key Data Taken From Secondary Sources
1.2.1.2 Key Secondary Sources Used
1.2.1.3 Key Data Validated From Primary Sources
1.2.2 Assumptions Made for This Report
1.2.3 Data Triangulation and forecasting
1.3 Market Size Estimation Methodology
1.3.1 Markets Covered
1.3.2 Key Definitions
1.4 Market Share Estimation
1.4.1 Key Data Points Taken From Secondary Sources
2 Executive Summary (Page No.- 23)
3 Industry Overview (Page No.- 24)
3.1 Market Eco System
3.2 Energy Management Systems (EMS)
3.2.1 Introduction
3.2.2 Trends in the EMS Market
3.2.3 EMS: Market Size and forecast By Software
3.2.3.1 Overview
3.2.3.2 Utility EMS Software
3.2.3.2.1 Market Size and forecast By Region
3.2.3.3 Industrial EMS Software
3.2.3.3.1 Market Size and forecast By Region
3.2.3.4 Enterprise Carbon and Energy Management Software
3.2.3.4.1 Market Size and forecast By Region
3.2.3.5 Residential EMS
3.2.3.5.1 Market Size and forecast By Region
3.2.3.6 Others
3.2.3.6.1 Market Size and forecast By Region
3.2.4 EMS: Market Size and forecast in Power & Energy Vertical
3.2.4.1 Market Size and forecast By Software Type
3.2.4.2 Market Size and forecast By Region
3.2.5 EMS: Market Size and forecast By Regions
3.2.5.1 North America (NA) Market Size and forecast By Software Type
3.2.5.2 Europe
3.2.5.2.1 Market Size and forecast By Software Type
3.2.5.3 Asia-Pacific (APAC)
3.2.5.3.1 Market Size and forecast By Software Type
3.2.5.4 Latin America (LA)
3.2.5.4.1 Market Size and forecast By Software Type
3.2.5.5 Middle East and Africa (MEA)
3.2.5.5.1 Market Size and forecast By Software Type
3.3 SCADA
3.3.1 Introduction
3.3.2 SCADA Market Size and forecast By Region
3.3.2.1 Overview
3.3.2.2 Americas
3.3.2.2.1 Market Size and forecast By Component
3.3.2.2.2 Market Size and forecast By Architecture
3.3.2.2.3 Market Size and forecast By Application
3.3.2.3 Europe
3.3.2.3.1 Market Size and forecast By Component
3.3.2.3.2 Market Size and forecast By Architecture
3.3.2.3.3 Market Size and forecast By Application
3.3.2.4 Asia-Pacific
3.3.2.4.1 Market Size and forecast By Component
3.3.2.4.2 Market Size and forecast By Architecture
3.3.2.4.3 Market Size and forecast By Application
3.3.2.5 Rest of the World
3.3.2.5.1 Market Size and forecast By Component
3.3.2.5.2 Market Size and forecast By Architecture
3.3.2.5.3 Market Size and forecast By Application
3.4 State Estimator
3.4.1 Introduction
3.4.2 State Estimator Model
3.4.2.1 Network Topology Processing (NTP)
3.4.2.2 MEAsurements Consistency Checking
3.4.2.3 Observability Analysis
3.4.2.4 State Estimation
3.4.2.4.1 State Variables
3.4.2.4.2 Analog Measurements
3.4.2.4.3 Equality Constraints
3.4.2.4.4 Inequality Constraints
3.4.2.4.5 Bad Data Detection and Filtering
3.4.3 Topology Estimator
3.4.4 Time Schedule Model Implementations
3.4.5 Communication Channels for State Estimator
4 Market Overview (Page No.- 51)
4.1 Introduction
4.2 Mapping Trends
4.2.1 Increasing Global Energy Demand
4.2.2 Energy Price
4.3 Market Players and Roles
4.4 Market Dynamics
4.4.1 Drivers
4.4.1.1 Regulations and Benefits
4.4.1.2 Smart Grid Rollouts
4.4.1.3 Corporate Social Responsibility (CSR) and Brand Image
4.4.2 Restraints and Challenges
4.4.2.1 Lack of Industry Standards
4.4.2.2 Financial Constraints and Market Education
4.4.3 Opportunities
4.4.3.1 State Estimator for Smart Grid Projects
4.4.3.2 State Estimator for Blackout Mitigation
5 Cost Structure of Power System State Estimator (Page No.- 56)
5.1 Overview
5.1.1 State Estimation is A Statistical Process Whereby
5.2 Price Determinants
6 Implementation Challenges and Experiences (Page No.- 57)
6.1 Overview
6.2 Factors Affecting State Estimator Solution Availability and Accuracy
6.2.1 Incorrect Network Topology
6.2.2 Inadequate Observability
6.2.3 Inadequate Redundancy
6.2.4 Incorrect Load Distribution Factors for Unobservable Parts of the Network
6.2.5 Power System State Estimator Solution Quality Metrics
6.3 Economic Costs of Power Blackouts/Outages
6.3.1 Summary of the Root Causes Are:
6.3.2 The 2003 Events in North America
6.3.3 The 2003 Events in Europe
6.3.4 Historical Blackouts in Other Regions
6.3.5 Costs and Consequences of System Outages
6.3.6 North American Synchrophasor initiative (NASPI) Program
6.4 Se Implementation: Case Studies
6.4.1 Pacificorp
6.4.1.1 Pacificorp EMS System
6.4.1.2 Pacificorp Se Tuning Experience
6.4.1.3 Pacificorp EMS Advanced Applications (Current)
6.4.1.4 Pacificorp EMS Advanced Applications (Future)
6.4.2 Ercot
6.4.2.1 Cost Vs Output
6.4.3 Midwest Iso Trial
7 Market Size and forecast By Software (Page No.- 78)
7.1 Overview
7.1.1 Input Data and Measurements
7.1.2 Se: Component of EMS Application Suite
7.2 Utility State Estimator Software
7.2.1 Overview
7.2.2 Market Size and forecast By Region
7.3 Power Control Centres
7.3.1 Overview
7.3.2 Market Size and forecast By Region
8 Market Size and forecast By Applications (Page No.- 82)
8.1 Introduction
8.2 Transmission Network
8.2.1 Overview
8.2.2 Market Size and forecast By Region
8.3 Distribution Network
8.3.1 Overview
8.3.2 Market Size and forecast By Region
8.3.3 Market Size and forecast By Components
9 Market Size and forecast By Solution Methods (Page No.- 87)
9.1 Introduction
9.2 Weighted Lease Square (WLS) Method
9.2.1 Overview
9.2.2 Market Size and forecast By Region
9.3 Least Absolute Value (LAV) Method
9.3.1 Overview
9.3.2 Market Size and forecast By Region
9.4 Other Methods
9.4.1 Overview
9.4.2 Market Size and forecast By Region
10 Power System State Estimator (SE): Market Size and forecast, By Regions (Page No.- 92)
10.1 Overview and Introduction
10.1.1 Energy Industry Reviewing Operations
10.1.2 The Transformation of The Electricity Industry
10.1.3 Infrastructure
10.1.3.1 Key Elements Include:
10.1.4 Parfait Charts
10.2 North America
10.2.1 Overview
10.2.2 Market Size and forecast By Software Type
10.3 Europe
10.3.1 Overview
10.3.2 Market Size and forecast By Software Type
10.4 Asia-Pacific
10.4.1 Overview
10.4.2 Market Size and forecast By Software Type
10.5 Latin America
10.5.1 Overview
10.5.2 Market Size and forecast By Software Type
10.6 Middle East and Africa
10.6.1 Overview
10.6.2 Market Size and forecast By Software Type
11 Power System State Estimator: Customers and Value Proposition (Page No.- 98)
11.1 State Estimation Approach
11.1.1 Customers of Real-Time Applications:
11.1.1.1 Pseudo Measurements
11.1.1.2 Pmus
11.1.2 Customers of offline Applications:
11.2 Customer Demand Determinants
11.2.1 Customers of Real-Time Applications
11.2.2 Customers of off-Line
11.3 Value Proposition
11.3.1 Customers of Real-Time and offline Applications
12 Competitive Landscape (Page No.- 104)
12.1 Introduction
12.1.1 Competitive Market Scenario
12.1.2 Agreements/Partnerships/Contracts/Joint Ventures � Most Preferred Strategic Approach
12.2 Key Market Strategies
12.2.1 Mergers & Acquisitions
12.2.2 Agreements/Partnerships/Contracts/Joint Ventures
12.2.3 New Product/Technology Launches
12.2.4 Expansions and Investments
13 Company Profiles (Page No.- 120)
13.1 Abb Group
13.1.1 Business Overview
13.1.2 Products & Services
13.1.3 Key Strategy
13.1.4 Recent Developments
13.1.5 SWOT Analysis
13.1.6 MNM View
13.2 Siemens Ag
13.2.1 Business Overview
13.2.2 Products & Services
13.2.3 Key Strategy
13.2.4 Recent Developments
13.2.5 SWOT Analysis
13.2.6 MNM View
13.3 Alstom
13.3.1 Business Overview
13.3.2 Products & Services
13.3.3 Key Strategy
13.3.4 Recent Developments
13.3.5 SWOT Analysis
13.3.6 MNM View
13.4 Open System International, Inc. (OSI)
13.4.1 Business Overview
13.4.2 Products & Services
13.4.3 Key Strategy
13.4.4 Developments
13.5 General Electric
13.5.1 Business Overview
13.5.2 Products & Services
13.5.3 Key Strategy
13.5.4 Recent Developments
13.5.5 SWOT Analysis
13.5.6 MNM View
13.6 Nexant
13.6.1 Introduction
13.6.2 Products
13.6.3 SWOT Analysis: Nexant
13.6.4 Strategy & Insights
13.6.5 Developments
13.7 ETAP Electrical Engineering Software
13.7.1 Business Overview
13.7.2 Products & Services
13.7.3 Key Strategy
13.8 BCP Switzerland (Neplan)
13.8.1 Business Overview
13.8.2 Products & Services
13.8.3 Key Strategy
13.8.4 Recent Developments
13.9 CYME International
13.9.1 Business Overview
13.9.2 Products & Services
13.9.3 Key Strategic Insights
13.9.4 Recent Developments
13.9.5 SWOT Analysis
13.10 Digsilent (Power Factory)
13.10.1 Business Overview
13.10.2 Product offerings
13.10.3 Key Strategy
13.10.4 Recent Developments
13.10.5 SWOT Analysis
13.10.6 MNM View
13.11 Energy Computer Systems (Spard)
13.11.1 Business Overview
13.11.2 Products & Services
13.11.3 Key Strategy
13.11.4 Recent Developments
13.12 Electrocon (CAPE)
13.12.1 Overview
13.12.2 Products & Services
13.13 EPFL (Simsen)
13.13.1 Business Overview
13.13.2 Products & Services
13.13.3 Developments
13.14 GDF Suez (Eurostag)
13.14.1 Business Overview
13.14.2 Products & Services
13.14.3 Key Strategy
13.14.4 Recent Developments
13.15 Powerworld
13.15.1 Business Overview
13.15.2 Products & Services
13.15.3 Key Strategy
13.15.4 Developments
13.16 KEPCO (KW-PSS)
13.16.1 Business Overview
13.16.2 Products & Services
13.16.3 Key Strategy
13.16.4 Recent Developments
13.17 PRDC (Mipower)
13.17.1 Business Overview
13.17.2 Products & Services
13.17.3 Key Strategy
13.17.4 Recent Developments
13.18 Inspired Interfaces (Retic Master)
13.18.1 Business Overview
13.18.2 Product offerings
13.18.3 Key Strategy
13.18.4 Recent Developments
13.19 Siemens PTI
13.19.1 Business Overview
13.19.2 Product offerings
13.19.3 Key Strategy
13.19.4 Recent Developments
13.20 SKM (Power Tools for Windows)
13.20.1 Business Overview
13.20.2 Products & Services
13.20.3 Key Strategy
13.21 TOM (Pasha)
13.21.1 Business Overview
13.21.2 Products & Services
13.21.3 Key Strategy
List of Tables (63 Tables)
Table 1 EMS Software Market Size, By Types, 2013-2014 ($Billion)
Table 2 Utility EMS Software Market Size, By Region, 2013-2014 ($Billion)
Table 3 Industrial EMS Software Market Size, By Region, 2013-2014 ($Billion)
Table 4 Ecem Software Market Size, By Region, 2013-2014 ($Million)
Table 5 Residential EMS Software Market Size, By Region, 2013-2014 ($Million)
Table 6 Others EMS Software Market Size, By Region, 2013-2014 ($Million)
Table 7 Power and Energy Market Size, By Software Type, 2013-2014 ($Billion)
Table 8 Power and Energy Market Size, By Region, 2013-2014 ($Billion)
Table 9 North America: EMS Market Size, 2013-2014 ($Billion)
Table 10 North America: EMS Market Size, By Software Type, 2013-2014 ($Million)
Table 11 EU: EMS Market Size, 2013-2014 ($Billion)
Table 12 EU: EMS Market Size, By Software Type, 2013-14 ($ Billion)
Table 13 APAC: EMS Market Size, 2013-2014 ($Billion)
Table 14 Asia-Pacific: EMS Market Size, By Software Type, 2013-2014 ($Billion)
Table 15 Latin America: EMS Market Size, 2013-2014 ($Billion)
Table 16 Latin America: EMS Market Size, By Software Type, 2013-2014 ($Million)
Table 17 MEA: EMS Market Size, 2013-2014 ($Billion)
Table 18 MEA: EMS Market Size, By Software Type, 2013-2014 ($Million)
Table 19 SCADA Market Size, By Geography, 2013-2014 ($Billion)
Table 20 The Americas: SCADA Market Size, By Component, 2013-2014 ($Million)
Table 21 The Americas: SCADA Market Size, By Architecture, 2013-2014 ($Million)
Table 22 The Americas: SCADA Market Size, By Application, 2013-2014 ($Million)
Table 23 Europe: SCADA Market Size, By Component, 2013-2014 ($Million)
Table 24 Europe: SCADA Market Size, By Architecture, 2013-2014 ($Million)
Table 25 Europe: SCADA Market Size, By Application, 2013-2014 ($Million)
Table 26 APAC: SCADA Market Size, By Component, 2013-2014 ($Million)
Table 27 APAC: SCADA Market Size, By Architecture, 2013-2014 ($Million)
Table 28 APAC: SCADA Market Size, By Application, 2013-2014 ($Million)
Table 29 ROW: SCADA Market Size, By Component, 2013-2014 ($Million)
Table 30 ROW: SCADA Market Size, By Architecture, 2013-2014 ($Million)
Table 31 ROW: SCADA Market Size, By Application, 2013-2014 ($Million)
Table 32 Pacificorp Internal and External Model Footprint
Table 33 Table: Ercot Internal and External Model Footprint
Table 34 Example 1 - No UFE, Congestion
Table 35 Example 2A - UFE Concentrated in High Price Zone, Congestion (Uplift LRS UFE Allocation)
Table 36 Example 2B - UFE Concentrated in High Price Zone, Congestion (Zonal LRS UFE Allocation)
Table 37 Example 3A - UFE Concentrated in Low Price Zone, Congestion (Uplift LRS UFE Allocation)
Table 38 Example 3B - UFE Concentrated in Low Price Zone, Congestion (Zonal LRS UFE Allocation)
Table 39 Example 4A - UFE Concentrated in One Zone, No Congestion (Uplift LRS UFE Allocation)
Table 40 Example 4B - UFE Concentrated in One Zone, No Congestion (Zonal LRS UFE Allocation)
Table 41 Example 5A - Positive UFE in High Price Zone, Negative UFE in Low Price Zone Congestion (Uplift LRS UFE Allocation)
Table 42 Example 5B - Positive UFE in High Price Zone, Negative UFE in Low Price Zone Congestion (Zonal LRS UFE Allocation)
Table 43 Power System State Estimator Market Size, By Software Type, 2012-2019 ($Million)
Table 44 State Estimator Market Size, By Utility Application, By Region, 2012-2019($Million)
Table 45 State Estimator Market Size, By Power Control Center Application, By Region, 2012-2019($Million)
Table 46 Power System State Estimator Market Size, By Application, 2012-2019($Million)
Table 47 Transmission Market Size, By Region, 2012-2019($Million)
Table 48 Distribution Market Size, By Region, 2012-2019($Million)
Table 49 Distribution Market Size, By Components, 2012-2019($Million)
Table 50 Power System State Estimator Market Size, By Solution Method, 2012-2019 ($Million)
Table 51 Market Size, Weighted Least Square Method, By Region, 2012-2019 ($Million)
Table 52 Market Size, Least Absolute Value Method, By Region, 2012-2019 ($Million)
Table 53 Market Size, Other Methods, By Region, 2012-2019($Million)
Table 54 Power System State Estimator Market Size, By Region, 2012-2019($Million)
Table 55 North America Power System State Estimator Market Size, By Software Type, 2012-2019($Million)
Table 56 Europe Power System State Estimator Market Size, By Software Type, 2012-2019($Million)
Table 57 Asia-Pacific Power System State Estimator Market Size, By Software Type, 2012-2019($Million)
Table 58 Latin America Power System State Estimator Market Size, By Software Type, 2012-2019 ($Million)
Table 59 Middle East & Africa Power System State Estimator Market Size, By Software Type, 2012-2019 ($Million)
Table 60 Mergers & Acquisitions, 2011-2014
Table 61 Agreements/Partnerships/Collaborations, 2011-2014
Table 62 New Product Launches 2011-2014
Table 63 Expansions and Investments, 2011-2014
List of Figures (24 Figures)
Figure 1 Research Methodology
Figure 2 Market Size Estimation Methodology: Bottom-Up Approach
Figure 3 Market Size Estimation Methodology: Top-Down Approach
Figure 4 Power System State Estimator Market Size, By Region, 2012-2019 ($Million)
Figure 5 Market Ecosystem for State Estimator Market
Figure 6 Energy Consumption, By Fuel Type, 2012�2020 (Quadrillion BTU)
Figure 7 Market Players
Figure 8 Model for Centralized to Distributed State Estimation
Figure 9 State Estimator Market Size, By Region, 2012-2019 ($Million)
Figure 10 State Estimation - Evaluation Procedure:
Figure 11 Topology Estimator Adoption : Real-Time Customer Views
Figure 12 Topology Estimator Benefits : Real-Time Customer Views
Figure 13 Topology Estimator Adoption : off-Line Customer Views
Figure 14 Topology Estimator Benefits : off-Line Customer Views
Figure 15 Power System State Estimator Market Developments, 2011-2014
Figure 16 Market Share, By Growth Strategies, 2011�2014
Figure 17 Market Developments, By Growth Strategies, 2011�2014
Figure 18 Market Growth Strategies, By Companies, 2011�2014
Figure 19 Abb SWOT Analysis
Figure 20 Siemens PTI SWOT Analysis
Figure 21 Alstom SWOT Analysis
Figure 22 General Electric SWOT Analysis
Figure 23 CYME Internationalswot Analysis
Figure 24 Digsilent SWOT Analysis


Growth opportunities and latent adjacency in Power System State Estimator Market