Power Line Communication Market by Offering (Hardware, Software, and Services), Frequency (Narrowband, and Broadband), Application (Energy Management and Smart Grid, and Indoor Networking), Vertical, and Geography - Global Forecast to 2023


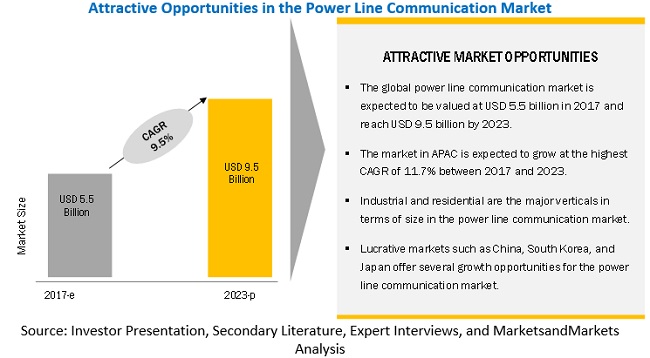
MarketsandMarkets forecasts the Power Line Communication market to grow from USD 5.5 billion in 2017 to USD 9.5 billion by 2023, at a Compound Annual Growth Rate (CAGR) of 9.5% during the forecast period. The major factors that are expected to be driving the PLC market are cost-effective installation, enabling wide coverage by using the existing electricity distribution network, growing deployment of smart grids and high penetration of broadband power line communication devices in indoor networking applications.
Power Line Communication Market by application, the energy management and smart grid segment is expected to grow at the highest growth rate during the forecast period
Integration of renewable energy sources into the electricity supply chain, effective utilization of existing electrical infrastructure, and delivery of secure, reliable electricity are the major objectives of smart grids. Communication technologies play an important role in smart grids, as these technologies are required for obtaining data for the efficient control and distribution of energy. Power line communication technology is one of the most preferred technologies for communication on smart grids. This preference can be attributed to the ability of this technology to enable communication using existing powerlines, resulting in a wide coverage with less capital expenditure. A number of companies in the power line communication industry are offering products for application in smart grids.
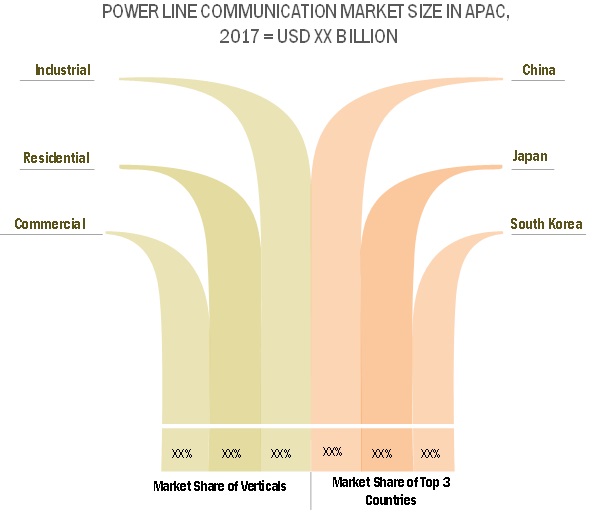
Power Line Communication Market by vertical, the industrial holds the largest share of the market
Automation and control of power grids, advanced metering, electric vehicle charging, monitoring and control of solar panels, lighting control, and indoor networking are the major applications of the power line communication technology in the industrial vertical. Various companies operating in power line communication market are offering products and solutions for meeting the demand being generated from industrial customers.
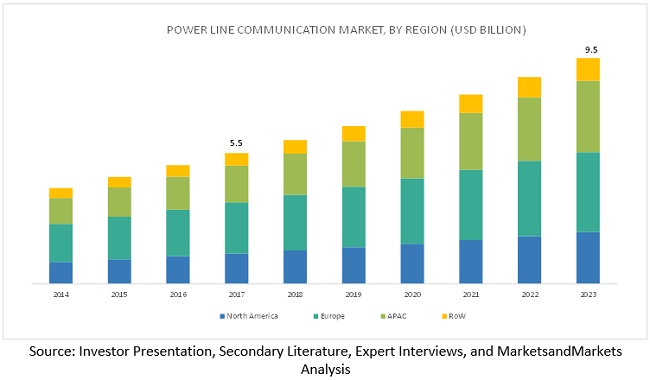
Europe to account for the largest market size during the forecast period.
Europe is expected to hold the largest market size in the PLC market during the forecast period, followed by the APAC region. Europe held the largest share of the market and Italy is one of the major contributors. The dominant position of Europe in the market can be attributed to the high adoption of power line communication technology-based products for the advanced metering, substation communication, and network expansion applications. Moreover, prominent players, such as ABB (Switzerland), Siemens (Germany), devolo (Germany), Iskra (Slovenia), Landis+Gyr (Switzerland), Iskraemeco (Slovenia), and Schneider Electric (France), in the power line communication market are based in this region, contributing to the market growth.
Power Line Communication Market Dynamics
Driver: Enabling wide coverage by using the existing electricity distribution network
The use of power line communication technology for communication is not only cost-effective but also allows wide coverage. Considering the wide availability of the power lines, nearly all the devices receiving power through these power lines can be controlled and monitored with the use of the power line communication technology. The fact that the power line communication technology uses the existing electricity distribution network for communication makes it especially useful for communication with devices, which are located in remote areas where no communication infrastructure is available. One of such example is communication with substations located in remote areas with inadequate communication infrastructure. Extension of each electricity distribution network results in the extension of power line communication network, thereby enabling a wider geographic network coverage.
Restraint: High noise generation on power lines limiting the data transmission quality
Initially, the power lines were used for energy distribution and not for data transmission. The harsh environment of the power lines can negatively impact the quality of data being transmitted. Noise is one of the main distortion factors, which impacts the performance of the communication systems over power lines. Noise is generated by electrical appliances, which are connected to the electric grid, as well as the coupling of the radio broadcasters that transmit signals over short, middle, and long wave ranges. There is an inverse relationship between the noise on the power line and performance of the power line communication systems. With the increase in the noise level, it is harder to detect the received signal. For instance, light dimmers, vacuum cleaners, drills, and kitchen appliances are some of the noise-sourced devices, which can have a negative impact on the performance of a power line communication technology-based home network.
Opportunity: Use of power line communication technology for lighting control applications
The power line communication technology is witnessing an increasing penetration in the lighting control applications. This technology can be used for both indoor as well as outdoor lighting control. In outdoor lighting, street lighting, such as roadway lighting, tunnel lighting, car park lighting, and urban lighting, is one of the upcoming applications where this technology is increasingly being used. Street lighting accounts for a significant portion of operating expenses incurred by municipalities and businesses with large facilities. Moreover, the lighting cost cannot be avoided, as it is necessary for public safety and operation; hence, municipalities and businesses are moving toward automating lighting networks for lowering the energy usage. Power line communication is considered one of the ideal technologies for this purpose. The advantages, such as no additional wiring required for setting up communication network, as well as network coverage even through walls, underground, and adverse weather conditions, offered by this technology has led to its adoption in the lighting control applications. Furthermore, this technology is increasingly being used for network expansion and lighting control in smart homes. A number of companies in the power line communication market are offering power line communication technology-based products for the lighting control application. For instance, NYX Hemera Technologies (Canada) offers TLACS-EM solution designed for switching on and off luminaire/lamps, and controlling and supervising luminaire/lamps status and consumption. This solution for communication either uses the power line communication technology and transfers the data through the power lines or uses dedicated communication wires.
Challenge: Availability of various substitute technologies
The players providing power line communication technology face competition from other players providing wired and wireless communication technologies. Fiber-optic network is one of the communication technologies, which can be used for smart grid communication instead of power lines. The selection of the communication technology depends upon various factors such as infrastructure, application, and resources. For instance, the factors, such as frequency spectrum for wireless technologies, availability of fiber-optic cables, and quality and length of the power cables for broadband power line carrier, needs to be considered for the selection of communication technology for data communication in power utilities. At times, a combination of various communication technologies is also required to be deployed at the power utilities for effective communication and cost efficiency. At the consumers� end, the selection of communication technology differs based on consumer�s requirements. For instance, in buildings, where a communication network is required only for the transmission of meter data and price signals, GPRS modems or narrowband power line carriers are sufficient. On the other hand, broadband power line carriers, fiber-optic cables, or wireless solutions can be used in smart homes where power generation and controllable loads or e-car charging stations need to be managed. In the network expansion application segment, the power line communication technology-based product providers face competition from other players offering various communication devices such as Wi-Fi extenders and network switches. However, companies operating in the power line communication market are focusing on offering innovative products to compete with the substitute communication technologies. For instance, in 2016 TP-Link Technologies launched the TL-WPA9610, an AV2000 gigabit powerline AC Wi-Fi kit. This device is designed for the network expansion application and is capable of simultaneously delivering AV2000 via powerline and AC1200 via Wi-Fi.
Scope of the Report
|
Report Metric |
Details |
|
Market size available for years |
2014�2023 |
|
Base year considered |
2016 |
|
Forecast period |
2017�2023 |
|
Forecast units |
Million (USD) |
|
Segments covered |
Offering, Frequency, Application, Vertical, Solution and Region |
|
Geographies covered |
North America, Europe, APAC, RoW |
|
Companies covered |
Siemens (Germany), NETGEAR (US), ABB (Switzerland), AMETEK (US), Schneider Electric (France), General Electric (US), Hubbell Power Systems (US), TP-Link Technologies (China), D-Link (Taiwan), Landis+Gyr (Switzerland), Belkin International (US), Devolo (Germany), and Zyxel Communications (Taiwan). |
The research report categorizes the PLC to forecast the revenues and analyze the trends in each of the following sub-segments:
Power Line Communication Market, By Offering
- Hardware
- Software
- Services
Power Line Communication Market, By Frequency
- Narrowband (3 kHz to 500 kHz)
- Broadband (Greater than 500 kHz)
Power Line Communication Market, By Application
- Energy Management and Smart Grid
- Indoor Networking
Power Line Communication Market, By Vertical
- Residential
- Commercial
- Industrial
Power Line Communication Market, By Solution
- PLC over AC Lines
- PLC over DC Lines
Power Line Communication Market, By Region
- North America
- Europe
- Asia Pacific (APAC)
- RoW
Key Market Players
Siemens (Germany), NETGEAR (US), ABB (Switzerland), AMETEK (US), Schneider Electric (France), General Electric (US), Hubbell Power Systems (US), TP-Link Technologies (China), D-Link (Taiwan), Landis+Gyr (Switzerland), Belkin International (US), Devolo (Germany), and Zyxel Communications (Taiwan).
Siemens (US) ranked first in the power line communication market for substation communication application in 2016. The company�s leading position in this market can be attributed to its strong product portfolio of power line communication technology-based products. The company is further trying to expand its product portfolio by introducing new products. In September 2017, the company launched the PowerLink IP, a new power line communication system. In addition to an extensive product portfolio, the company�s strong brand image, customer base, and wide geographic reach have also helped it attain a leading position in the market.
Recent Developments
- In September 2017, Siemens launched the PowerLink IP, a power line communication system that uses high-voltage lines between transformer substations as a medium for communication of data, teleprotection, and voice. This system uses bandwidths of up to 256 kHz and can offer a data rate of up to 2.5 megabits per second (Mbps) of bidirectional transmission.
- In May 2017, Siemens entered into an agreement with African countries � Uganda and Sudan. Under this agreement, the company along with its partners would develop solutions in the areas of power supply, industry, transportation, and healthcare. Moreover, the company would participate in the "Make IT Alliance" for the promotion of start-ups and technology companies in Africa. Furthermore, it would conduct training programs for various technical fields for creation of a pool of well-trained local workers.
- In November 2016, Zyxel Communications launched the PLA5236, a 1000 Mbps powerline AC900 wireless extender designed to help users extend both Ethernet and Wi-Fi network in buildings using power outlets.
- In October 2016, ABB (Switzerland) entered into a strategic partnership with Fluor Corporation (US) to execute large turnkey engineering, procurement, and construction projects for electrical substations. Under this partnership, Fluor would benefit from the prominent position of ABB in the power technologies market while ABB would benefit from the expertise of Fluor in managing large engineering, procurement, and construction projects. The companies have collaborated with an aim to capture new growth opportunities in the substation market.
Critical Questions the Report Answers:
- Where will all these developments take the industry in the long term?
- What are the upcoming trends for the PLC market?
- Which segment provides the most opportunity for growth?
- Who are the leading vendors operating in this market?
- What are the opportunities for new market entrants?
To speak to our analyst for a discussion on the above findings, click Speak to Analyst
 Exclusive indicates content/data unique to MarketsandMarkets and not available with any competitors.
Table of Contents
1 Introduction (Page No. - 14)
1.1 Study Objectives
1.2 Definition
1.3 Study Scope
1.3.1 Markets Covered
1.3.2 Geographic Scope
1.3.3 Years Considered for Study
1.4 Currency
1.5 Limitations
1.6 Stakeholders
2 Research Methodology (Page No. - 17)
2.1 Research Data
2.1.1 Secondary Data
2.1.1.1 Secondary Sources
2.1.2 Primary Data
2.1.2.1 Key Data From Primary Sources
2.1.2.2 Key Industry Insights
2.1.2.3 Breakdown of Primaries
2.2 Market Size Estimation
2.2.1 Bottom-Up Approach
2.2.2 Top-Down Approach
2.3 Market Breakdown and Data Triangulation
2.3.1 Assumptions for Research Study
3 Executive Summary (Page No. - 26)
4 Premium Insights (Page No. - 31)
4.1 Attractive Opportunities for Power Line Communication Market
4.2 Market, By Offering
4.3 Market in APAC, By Country and Vertical
4.4 Market, By Application
4.5 Market, By Country (2017)
5 Market Overview (Page No. - 36)
5.1 Introduction
5.2 Market Dynamics
5.2.1 Drivers
5.2.1.1 Cost-Effective Installation
5.2.1.2 Enabling Wide Coverage By Using the Existing Electricity Distribution Network
5.2.1.3 Growing Deployment of Smart Grids
5.2.1.4 High Penetration of Broadband Power Line Communication Devices in Indoor Networking Applications
5.2.2 Restraints
5.2.2.1 High Noise Generation on Power Lines Limiting the Data Transmission Quality
5.2.2.2 Adverse Effect of Signal Attenuation
5.2.3 Opportunities
5.2.3.1 Growth Opportunities From Emerging Countries in APAC
5.2.3.2 Use of Power Line Communication Technology for Lighting Control Applications
5.2.4 Challenges
5.2.4.1 Availability of Various Substitute Technologies
5.3 Value Chain Analysis
6 Power Line Communication Market, By Offering (Page No. - 43)
6.1 Introduction
6.2 Hardware
6.3 Software
6.3.1 Data Acquisition and Management
6.3.2 Energy Management
6.4 Services
6.4.1 Professional Services
6.4.1.1 Consulting
6.4.1.2 Training & Development
6.4.2 Maintenance and Repair
7 Power Line Communication Market, By Frequency (Page No. - 49)
7.1 Introduction
7.2 Narrowband (3 kHz to 500 kHz)
7.3 Broadband (Greater Than 500 kHz)
8 Power Line Communication Market, By Application (Page No. - 53)
8.1 Introduction
8.2 Energy Management and Smart Grid
8.2.1 Substation Communication
8.2.2 Advanced Metering
8.2.3 Micro Inverter Monitoring
8.2.4 Vehicle Communication and Electric Vehicle Charging
8.2.5 Lighting Control
8.2.5.1 Indoor Lighting Control
8.2.5.2 Outdoor Lighting Control
8.2.5.2.1 Street Lighting
8.2.5.2.2 Airport Runway Lighting
8.3 Indoor Networking
9 Power Line Communication Market, By Vertical (Page No. - 66)
9.1 Introduction
9.2 Residential
9.3 Commercial
9.3.1 Smart Buildings
9.3.2 Retail
9.4 Industrial
9.4.1 Energy and Power
9.4.2 Automotive & Transportation
9.4.3 Others
10 Power Line Communication, By Modulation Technique (Page No. - 73)
10.1 Introduction
10.2 Single Carrier Modulation
10.2.1 Frequency Shift Keying (FSK)
10.2.2 Phase Shift Keying (PSK)
10.2.3 Amplitude Shift Keying (ASK)
10.3 Multi Carrier Modulation
10.3.1 Orthogonal Frequency Division Multiplexing (OFDM)
10.3.2 Filtered Multitone (FMT) Modulation
10.3.3 Discrete Wavelet Multitone (DWMT) Modulation
10.4 Spread Spectrum Modulation
11 Geographic Analysis (Page No. - 76)
11.1 Introduction
11.2 North America
11.2.1 US
11.2.2 Canada
11.2.3 Mexico
11.3 Europe
11.3.1 Italy
11.3.2 UK
11.3.3 Germany
11.3.4 Spain
11.3.5 France
11.3.6 Rest of Europe
11.4 Asia Pacific
11.4.1 China
11.4.2 Japan
11.4.3 South Korea
11.4.4 India
11.4.5 Rest of APAC
11.5 Rest of the World
11.5.1 South America
11.5.2 Middle East and Africa
12 Competitive Landscape (Page No. - 103)
12.1 Overview
12.2 Market Ranking Analysis: Market
12.3 Competitive Situations and Trends
12.3.1 Product Launches
12.3.2 Partnerships, Agreements, and Contracts
12.3.3 Others
13 Company Profiles (Page No. - 108)
(Business Overview, Product Offering, Strength of Product Portfolio, Business Strategy Excellence & Recent Developments, Key Relationships)*
13.1 Key Players
13.1.1 ABB
13.1.2 Siemens
13.1.3 Ametek
13.1.4 General Electric
13.1.5 Schneider Electric
13.1.6 Tp-Link Technologies
13.1.7 Netgear
13.1.8 D-Link
13.1.9 Hubbell Power Systems
13.1.10 Belkin International
13.1.11 Zyxel Communications
13.1.12 Landis+Gyr
(Business Overview, Product Offering, Strength of Product Portfolio, Business Strategy Excellence & Recent Developments, Key Relationships)*
13.2 Key Innovators
13.2.1 NYX Hemera Technologies
13.2.2 Trendnet
13.2.3 Lumenpulse
13.2.4 Devolo
13.3 Other Companies
13.3.1 Billion Electric
13.3.2 Extollo Communications
13.3.3 Netcomm Wireless
13.3.4 Asustek Computer
13.3.5 ZIV
13.3.6 Comtrend
13.3.7 Corinex Communications
13.3.8 Iskra
13.3.9 Aeconversion
14 Appendix (Page No. - 150)
14.1 Insights of Industry Experts
14.2 Discussion Guide
14.3 Knowledge Store: Marketsandmarkets� Subscription Portal
14.4 Introducing RS: Real-Time Market Intelligence
14.5 Available Customizations
14.6 Related Reports
14.7 Author Details
List of Tables (64 Tables)
Table 1 Market, By Offering, 2014�2023 (USD Million)
Table 2 Market for Hardware, By Application, 2014�2023 (USD Million)
Table 3 Market, By Frequency, 2014�2023 (USD Billion)
Table 4 Narrowband Market, By Application, 2014�2023 (USD Million)
Table 5 Broadband Market, By Application, 2014�2023 (USD Million)
Table 6 Market, By Application, 2014�2023 (USD Billion)
Table 7 Market for Energy Management and Smart Grid Application, By Type, 2014�2023 (USD Million)
Table 8 Market for Energy Management and Smart Grid Application, By Vertical, 2014�2023 (USD Million)
Table 9 Market for Energy Management and Smart Grid Application, By Region, 2014�2023 (USD Million)
Table 10 Market for Energy Management and Smart Grid Application in North America, By Country, 2014�2023 (USD Million)
Table 11 Market for Energy Management and Smart Grid Application in Europe, By Country, 2014�2023 (USD Million)
Table 12 Market for Energy Management and Smart Grid Application in APAC, By Country, 2014�2023 (USD Million)
Table 13 Market for Energy Management and Smart Grid Application in RoW, By Region, 2014�2023 (USD Million)
Table 14 Market for Indoor Networking Application, By Vertical, 2014�2023 (USD Million)
Table 15 Market for Indoor Networking Application, By Region, 2014�2023 (USD Million)
Table 16 Market for Indoor Networking Application in North America, By Country, 2014�2023 (USD Million)
Table 17 Market for Indoor Networking Application in Europe, By Country, 2014�2023 (USD Million)
Table 18 Market for Indoor Networking Application in APAC, By Country, 2014�2023 (USD Million)
Table 19 Market for Indoor Networking Application in RoW, By Region, 2014�2023 (USD Million)
Table 20 Market, By Vertical, 2014�2023 (USD Billion)
Table 21 Market for Residential Vertical, By Application, 2014�2023 (USD Million)
Table 22 Market for Commercial Vertical, By Application, 2014�2023 (USD Million)
Table 23 Market for Industrial Vertical, By Application, 2014�2023 (USD Million)
Table 24 Market, By Region, 2014�2023 (USD Million)
Table 25 Market in North America, By Country, 2015�2023 (USD Million)
Table 26 Market in US, By Application, 2015�2023 (USD Million)
Table 27 Market in US, By Vertical, 2015�2023 (USD Million)
Table 28 Market in Canada, By Application, 2015�2023 (USD Million)
Table 29 Market in Canada, By Vertical, 2015�2023 (USD Million)
Table 30 Market in Mexico, By Application, 2015�2023 (USD Million)
Table 31 Market in Mexico, By Vertical, 2015�2023 (USD Million)
Table 32 Market in Europe, By Country, 2015�2023 (USD Million)
Table 33 Market in Italy, By Application, 2015�2023 (USD Million)
Table 34 Market in Italy, By Vertical, 2015�2023 (USD Million)
Table 35 Market in UK, By Application, 2015�2023 (USD Million)
Table 36 Market in UK, By Vertical, 2015�2023 (USD Million)
Table 37 Market in Germany, By Application, 2015�2023 (USD Million)
Table 38 Market in Germany, By Vertical, 2015�2023 (USD Million)
Table 39 Market in Spain, By Application, 2015�2023 (USD Million)
Table 40 Market in Spain, By Vertical, 2015�2023 (USD Million)
Table 41 Market in France, By Application, 2015�2023 (USD Million)
Table 42 Market in France, By Vertical, 2015�2023 (USD Million)
Table 43 Market in Rest of Europe, By Application, 2015�2023 (USD Million)
Table 44 Market in Rest of Europe, By Vertical, 2015�2023 (USD Million)
Table 45 Market in APAC, By Country, 2015�2023 (USD Million)
Table 46 Market in China, By Application, 2015�2023 (USD Million)
Table 47 Market in China, By Vertical, 2015�2023 (USD Million)
Table 48 Market in Japan, By Application, 2015�2023 (USD Million)
Table 49 Market in Japan, By Vertical, 2015�2023 (USD Million)
Table 50 Market in South Korea, By Application, 2015�2023 (USD Million)
Table 51 Market in South Korea, By Vertical, 2015�2023 (USD Million)
Table 52 Market in India, By Application, 2015�2023 (USD Million)
Table 53 Market in India, By Vertical, 2015�2023 (USD Million)
Table 54 Market in Rest of APAC, By Application, 2015�2023 (USD Million)
Table 55 Market in Rest of APAC, By Vertical, 2015�2023 (USD Million)
Table 56 Market in RoW, By Region, 2015�2023 (USD Million)
Table 57 Market in South America, By Application, 2015�2023 (USD Million)
Table 58 Market in South America, By Vertical, 2015�2023 (USD Million)
Table 59 Market in Middle East and Africa, By Application, 2015�2023 (USD Million)
Table 60 Market in Middle East and Africa, By Vertical, 2015�2023 (USD Million)
Table 61 Market Ranking of Key Players in Market, 2016
Table 62 Product Launches, 2016�2017
Table 63 Partnerships, Agreements, and Contracts, 2015�2017
Table 64 Expansions and Joint Ventures, 2015�2017
List of Figures (40 Figures)
Figure 1 Market Segmentation
Figure 2 Process Flow: Market Size Estimation
Figure 3 Market: Research Design
Figure 4 Market: Bottom-Up Approach
Figure 5 Market: Top-Down Approach
Figure 6 Data Triangulation
Figure 7 Market Size (2014�2023)
Figure 8 Market, By Frequency (2017 vs 2023)
Figure 9 Market for Energy Management and Smart Grid Application to Grow at Higher CAGR During Forecast Period
Figure 10 Industrial Vertical to Hold Largest Share of Market By 2023
Figure 11 Europe Accounted for Largest Share of Market in 2016
Figure 12 Market Expected to Witness Attractive Growth Opportunities Owing to Increasing Demand From Industrial Vertical During the Forecast Period
Figure 13 Software Expected to Grow at Highest CAGR in Market During Forecast Period
Figure 14 China to Hold Largest Share of Market in 2017
Figure 15 Market for Energy Management and Smart Grid to Grow at Higher CAGR During Forecast Period
Figure 16 US Expected to Hold Largest Share of Market in 2017
Figure 17 Growing Deployment of Smart Grids Boosts Market
Figure 18 Value Chain Analysis: Major Value Addition During System Or Equipment Manufacturing Stage
Figure 19 Market, By Offering
Figure 20 Software Segment Expected to Witness Highest Growth in Market Between 2017 and 2023
Figure 21 Market, By Frequency
Figure 22 Indoor Networking Application Expected to Hold Largest Share of Broadband Market By 2023
Figure 23 Market, By Application
Figure 24 Energy Management and Smart Grid Application to Hold Largest Share of Market By 2023
Figure 25 Vehicle Communication & Electric Vehicle Charging Application to Witness Highest Growth Rate During Forecast Period
Figure 26 China Expected to Dominate Market for Energy Management and Smart Grid Application in APAC During Forecast Period
Figure 27 Market, By Vertical
Figure 28 Industrial Vertical to Hold Largest Share of Market By 2023
Figure 29 Geographic Snapshot (2017�2023): APAC Countries, Such as China and Japan, Expected to Witness Significant Growth in Market During Forecast Period
Figure 30 North America: Market Snapshot
Figure 31 Europe: Market Snapshot
Figure 32 Asia Pacific: Market Snapshot
Figure 33 ABB: Company Snapshot
Figure 34 Siemens: Company Snapshot
Figure 35 Ametek: Company Snapshot
Figure 36 General Electric: Company Snapshot
Figure 37 Schneider Electric: Company Snapshot
Figure 38 Netgear: Company Snapshot
Figure 39 D-Link: Company Snapshot
Figure 40 Landis+Gyr: Company Snapshot
This research study incorporates the usage of secondary sources, annual reports, directories, and databases (such as Hoovers, Bloomberg Businessweek, Factiva, and OneSource) to identify and collect information useful for the extensive technical, market-oriented, and commercial study of the power line communication market. The key players in the power line communication market have been identified through secondary research, and their market share has been determined through primary and secondary research. Primary sources mainly comprise several experts from core and related industries, along with preferred suppliers, manufacturers, distributors, technology developers, alliances, standards, and certification organizations related to various parts of the value chain of the industry. In-depth interviews with various primary respondents, including key industry participants, subject matter experts (SMEs), C-level executives of key companies, and consultants, have been conducted to obtain and verify critical qualitative and quantitative information as well as assess prospects.
Secondary Research
In the secondary research process, various secondary sources have been referred to identify and collect information important for this study. Secondary sources include corporate filings such as annual reports, press releases, investor presentations, and financial statements; trade, business, and professional associations; white papers, journals, and articles from recognized authors; and certified publications related to power line communication technology, directories, and databases. The secondary research has been conducted to obtain key information about the supply chain of the industry, monetary chain of the market, the total pool of key players, and segmentation of the market according to industry trends to the bottommost level, geographic markets, and key developments from the market-oriented perspective. The secondary data has been collected and analyzed to arrive at the overall market size, which has been further validated through primary research.
Primary Research
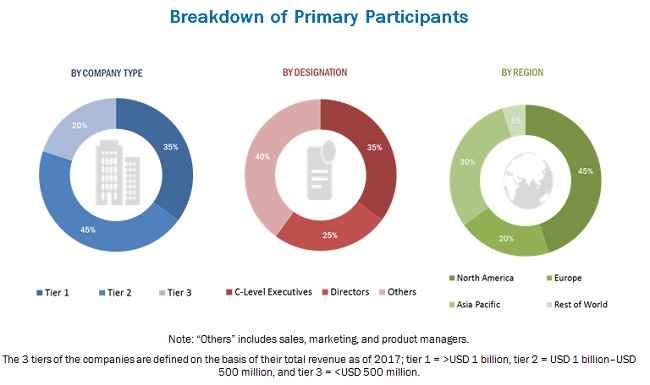
In the primary research process, various primary sources from both supply and demand sides have been interviewed to obtain qualitative and quantitative information for this report. Primary sources from the supply side include experts such as CEOs, vice presidents, marketing directors, technology and innovation directors, subject matter experts (SMEs), consultants, and related key executives from the major companies and organizations operating in the power line communication market. After the complete market engineering process (which includes market statistics calculations, market breakdown, market size estimations, market forecasting, and data triangulation), extensive primary research has been conducted to gather information, and verify and validate the critical market numbers. Several primary interviews have been conducted with experts from both demand and supply sides across 4 major regions�North America, Europe, Asia Pacific (APAC), and Rest of the World (RoW). Approximately 25% of the primary interviews have been conducted with the demand side and 75% with the supply side. This primary data has been collected through questionnaires, e-mails, and telephonic interviews.
To know about the assumptions considered for the study, download the pdf brochure
Market Size Estimation
Top-down and bottom-up approaches have been used to estimate and validate the size of the power line communication market and other dependent submarkets. The key players in the market have been identified through secondary research, and their market ranking in respective regions has been determined through primary and secondary research. This entire research methodology includes the study of annual and financial reports of the top market players and interviews with industry experts (CEOs, VPs, directors, and marketing executives) for key insights (both quantitative and qualitative) on the power line communication market. All percentage shares and breakdowns have been determined using secondary sources and verified through primary sources. All possible parameters that positively and negatively impact the markets covered in this research study have been accounted for, viewed in extensive detail, verified through primary research, and analyzed to get the final quantitative and qualitative data. This data has been consolidated and supplemented with detailed inputs and analysis from MarketsandMarkets and presented in this report
Data Triangulation
After arriving at the overall market size through the process explained earlier, the total market has been split into several segments. The market breakdown and data triangulation procedures have been employed, wherever applicable, to complete the overall market engineering process and arrive at the exact statistics for all the segments and subsegments. The data has been triangulated by studying various factors and trends from both demand and supply sides. Along with this, the market has been validated using both top-down and bottom-up approaches.
Study Objectives
The objectives of the study are as follows:
- Define, describe, and forecast the overall power line communication market in terms of value
- Define, describe, and forecast the power line communication market segmented on the basis of offering, frequency, application, vertical, and geography
- Forecast the size of the power line communication market, in terms of value, for various segments with respect to 4 main regions�North America, Europe, Asia Pacific (APAC), and Rest of the World (RoW)
- Describe the major factors (drivers, restraints, opportunities, and challenges) influencing the growth of the power line communication market and its submarkets
- Analyze the micromarkets with respect to individual growth trends, prospects, and contributions to the overall power line communication market
- Analyze the opportunities in the market for stakeholders by identifying the high-growth segments of the power line communication market
- Identify the key players operating in the power line communication market and comprehensively analyze their market ranking and core competencies
- Analyze strategic developments such as product launches, partnerships, expansions, and contracts in the power line communication market
Available Customizations:
With the given market data, MarketsandMarkets offers customizations according to the company�s specific needs. The following customization options are available for the report:
Company Information
Detailed analysis and profiling of additional market players (up to 5)


Growth opportunities and latent adjacency in Power Line Communication Market