Optoelectronic Components Market by Component (Sensor, LED, Laser Diode, and Infrared Components), Application (Measurement, Lighting, Communications, and Security & Surveillance), Material, Vertical, and Region - Global Forecast to 2025


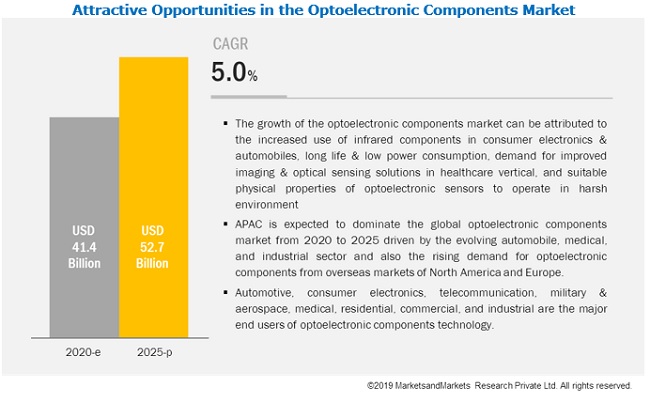
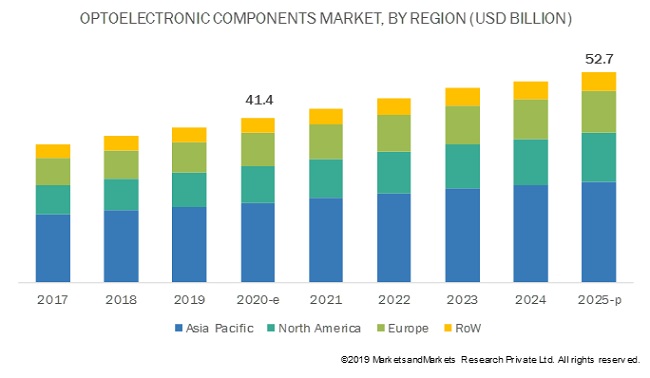
The global Optoelectronic components market size is projected to grow from USD 41.4 billion in 2020 to USD 52.7 billion by 2025, recording a CAGR of 5.0%.
The growth of the optoelectronic components industry is mainly driven by the increased use of infrared components in consumer electronics & automobiles, the long life & low power consumption, demand for improved imaging & optical sensing solutions in the healthcare vertical, and the suitable physical properties of optoelectronic sensors to operate in harsh environments.
The optoelectronic components market is experiencing significant growth, driven by increasing demand for advanced lighting, communication, and sensing technologies. As industries and consumers alike seek efficient solutions, the integration of optoelectronics in applications such as telecommunications, consumer electronics, and automotive systems is becoming more prevalent. Key trends in this market include the rising adoption of LEDs for lighting applications due to their energy efficiency and longevity, alongside the growing use of photonic devices in fiber optic communication systems that enable high-speed data transmission. Additionally, advancements in sensor technologies, such as LiDAR and imaging systems, are enhancing automation and safety in various sectors, including transportation and manufacturing. As the push for smart devices and the Internet of Things (IoT) continues, the optoelectronic components market is well-positioned for robust growth, with ongoing innovations driving the development of new applications and improving existing technologies.
Impact of AI Optoelectronic Components Market
The integration of artificial intelligence (AI) into the optoelectronic components market is accelerating innovation by enhancing performance, automation, and real-time data processing in applications such as autonomous vehicles, telecommunications, healthcare, and industrial automation. AI algorithms optimize the functionality of components like photodetectors, LEDs, laser diodes, and image sensors by enabling intelligent signal processing, adaptive control, and predictive maintenance. This synergy is driving the development of smarter, more energy-efficient optoelectronic systems capable of self-calibration and advanced analytics, ultimately expanding their application scope and boosting market growth in an increasingly data-driven and connected world.
“Sensor component segment to hold the largest share in the optoelectronic components market during the forecast period”
The component segment comprises sensor, LED, laser diode, and infrared components. This segment is projected to hold the largest share during the forecast period, owing to the usage of several types of sensors, including optical, image, phototransistors, photodiode, and photo relay for varied applications across several industries. The sensor component segment has further been subsegmented into phototransistors, photodiodes, photo relays, image sensors, optical sensors, and ultraviolet sensors.
“The measurement application segment to hold the largest share in the optoelectronic components market during the forecast period”
The measurement application segment is projected to hold the largest share in market during the forecast period. Measurement systems use optoelectronic sensors to convert light signals to electric currents and are used for applications such as machine vision, monitoring of process & operations, control of processes & operation, and experimental engineering analysis, among others.
“The gallium nitride material segment to hold the largest share in the optoelectronic components market during the forecast period”
The material segment comprises gallium nitride, gallium arsenide, silicon carbide, indium phosphide, silicon germanium, and gallium phosphide. The gallium nitride segment is projected to hold the largest share in market during the forecast period. Gallium nitride is a high electron mobility transistor (HEHT) material that is used as a basic component for optoelectronic components, which are superior to older silicon-based optoelectronic components. Gallium nitride finds application in LEDs, which are widely used in general lighting and commercial lighting.
“The consumer electronics vertical segment accounted for the largest share in the optoelectronic components market due to the increasing use of consumer goods”
The consumer electronics vertical segment is projected to hold the largest share in the optoelectronic components industry during the forecast period. The adoption of optoelectronic components in consumer electronics has increased due to technical advancements and the increasing use of consumer goods such as high-end sophisticated cameras, photocopy machines, smartphones, blue-ray storage devices, flat & flexible television displays, and more.
“Asia Pacific market to record significant growth during the forecast period”
Asia Pacific is projected to account for the largest share in optoelectronic components market during the forecast period. China, India, South Korea, and Japan are the major contributors to the growth of the market in Asia Pacific. The market here is likely to be driven by the evolving automobile, medical, and industrial manufacturing companies and also the rising demand for optoelectronic components from the overseas markets of North America and Europe.
Optoelectronic Components Market Key Players
The optoelectronic components market is currently dominated by Hamamatsu (Japan), Osram (Germany), TT Electronics (UK), Vishay (US), ON Semiconductor (US), Cree (US), Trumpf (Germany), SICK AG (Germany), Samsung (South Korea), Sony (Japan), and Broadcom (US). A few of the major strategies adopted by these players to compete in the optoelectronic components industry include product launches & developments, expansions, partnerships, and mergers & acquisitions.
Other players operating in the market are OmniVision (US), Micropac (US), Rohm (Japan), OSI Systems (US), Sharp (Japan), Renesas (Japan), Lite-On (Taiwan), SK Hynix (South Korea), Newport (US), and Himax (Japan). These players have adopted strategies such as product developments & launches, mergers & acquisitions, expansions, partnerships, and collaborations to grow in the optoelectronic components market.
Optoelectronic Components Market Report Scope
|
Report Metric |
Details |
| Market size value in 2020 | USD 41.4 Billion |
| Market size value in 2025 | USD 52.7 Billion |
| Growth rate | CAGR of 5.0% |
|
Market size available for years |
2017–2025 |
|
Base year |
2019 |
|
Forecast period |
2020–2025 |
|
Units |
Value (USD billion), Shipment (million units) |
|
Segments covered |
|
|
Geographic regions covered |
|
|
Companies covered |
|
| Key Market Driver | Optical Sensing And Imaging Solutions In Healthcare |
| Largest Growing Region | North America |
| Largest Market Share Segment | Consumer Electronics Vertical |
| Highest CAGR Segment | Indium Phosphide & Automotive Vertical |
This report categorizes the optoelectronic components market by component, application, material, vertical, and region.
Optoelectronic Components Market, by Component:
- Sensor
- LED
- Laser Diode
- Infrared Components
Optoelectronic Components Market, by Application
- Measurement
- Lighting
- Communications
- Security & Surveillance
- Others (geographical survey, scanning, and spectrometry)
Optoelectronic Components Market, by Material:
- Gallium Nitride
- Gallium Arsenide
- Silicon Carbide
- Indium Phosphide
- Silicon Germanium
- Gallium Phosphide
Optoelectronic Components Market, by Vertical:
- Automotive
- Consumer Electronics
- Telecommunication
- Military & Aerospace
- Medical
- Residential
- Commercial
- Manufacturing
- Others (utility, food & beverages, and pulp & paper)
Optoelectronic Components Market, by Geography:
-
North America
- US
- Canada
- Mexico
-
Europe
- Germany
- UK
- France
- Rest of Europe (Italy, Russia, Austria, the Netherlands, Denmark, Switzerland, Slovenia, Sweden, Finland, Norway, Romania, Bulgaria, Spain, and Poland)
-
Asia Pacific (APAC)
- China
- Japan
- South Korea
- India
- Rest of Asia Pacific (Australia, Taiwan, Indonesia, the Philippines, and Singapore)
-
Rest of the World (RoW)
- Middle East & Africa
- South America
Major Market Developments in Optoelectronic Components Industry
- In October 2018, Hamamatsu (Japan) strengthened its product portfolio by adding a 4-channel pulsed laser diode to its laser diode product line. The laser diode can operate at a high temperature of up to 105°C.
- In February 2019, Osram (Germany) acquired Ring Automotive, is a British manufacturer and distributor of vehicle lighting and auto-electrical parts. The acquisition will enable OSRAM to strengthen its expertise in automotive lighting and tap into additional sales potential by using the distribution channels of Ring Automotive.
- In August 2018, TT Electronics (UK) strengthened its product portfolio by launching OP207CL under its optoelectronics product line. The OP207CL is an infrared LED emitter with a spot diameter of 7mm. The emitter offers up to 10mW radiated power at a maximum drive current of 100mA.
- In April 2019, Vishay (US) strengthened its product portfolio by adding two series of optocouplers, DIP-6 and SMD-6. Both optocouplers offer a high off-state voltage of 800 V.
Key Questions Addressed by the Report
- Where will all these developments take the industry in the mid-to-long term?
- What are the upcoming trends in the optoelectronic components market?
- What are the opportunities for existing market players and those who are planning to enter the market?
- How are inorganic growth strategies implemented by key players likely to impact the growth of market, and who would have the advantage?
- What are the current investment trends in market?
Frequently Asked Questions (FAQ):
Which are the major applications of optoelectronic components? How huge is the opportunity for their growth in the next five years?
The major applications of optoelectronic components includes measurement, lighting, communications, and security & surveillance and it is expected that increased use of infrared components in consumer electronics and automobiles and long life and low power consumption of optoelectronic components will lead to USD 52.7 billion opportunity till 2025.
Which are the major companies in the optoelectronic components market? What are their major strategies to strengthen their market presence?
The major companies in optoelectronic components includes Hamamatsu (Japan), Osram (Germany), TT Electronics (UK), Vishay (US), and ON Semiconductor (US). Hamamatsu (Japan) is the dominant player in the global optoelectronic components market. It is a leading manufacturer of optoelectronic components components such as image sensors, photodiodes, infrared detectors, LEDs, UV-LED light source, and semiconductor lasers. The major strategies adopted by these players are product launches and expansion strategy.
What are the opportunities for new market entrants?
Recent developments in LED technology have led to the development of Li-Fi which can be used to transmit data by using visible light. This technology is more energy-efficient than other wireless data transmission technologies due to its ability to transfer data through light. Therefore, this will presents a greater opportunity to the industry players in the optoelectronic components market, especially LED manufacturers.
What are the drivers and opportunities for the optoelectronic components market?
Factors such as long life and low power consumption, demand for improved imaging and optical sensing solutions in healthcare vertical, and ability to operate in extreme environment are fueling the growth of the optoelectronic components market. Moreover, availability of cheaper substitute technologies to LED is expected to affect market growth.
Which end users are expected to drive the growth of the market in the next 5 years?
The market for the automotive vertical is expected to grow at the highest CAGR during the forecast period. The automotive vertical segment uses various LEDs, infrared components, image sensors, and laser diodes. It widely uses light sensors to detect ambient light to enable the automatic switching of automobile lights. Light sensors are also used to sense rain on the windshield and activate wipers.
To speak to our analyst for a discussion on the above findings, click Speak to Analyst
 Exclusive indicates content/data unique to MarketsandMarkets and not available with any competitors.
Table of Contents
1 Introduction (Page No. - 23)
1.1 Objectives of the Study
1.2 Market Definition and Scope
1.2.1 Inclusions & Exclusions
1.3 Scope of the Study
1.3.1 Markets Covered
1.3.2 Geographic Scope
1.3.3 Years Considered for the Study
1.4 Currency Considered
1.5 Limitations
1.6 Unit Considered
1.7 Stakeholders
2 Research Methodology (Page No. - 28)
2.1 Introduction
2.1.1 Secondary and Primary Research
2.1.1.1 Key Industry Insights
2.1.2 Secondary Data
2.1.2.1 List of Major Secondary Sources
2.1.2.2 Secondary Sources
2.1.3 Primary Data
2.1.3.1 Primary Interviews With Experts
2.1.3.2 Breakdown of Primaries
2.1.3.3 Primary Sources
2.2 Market Size Estimation
2.2.1 Bottom-Up Approach
2.2.1.1 Approach for Bottom-Up Analysis (Demand Side)
2.2.2 Top-Down Approach
2.2.2.1 Approach for Top-Down Analysis (Supply Side)
2.3 Market Breakdown and Data Triangulation
2.4 Research Assumptions
3 Executive Summary (Page No. - 37)
4 Premium Insights (Page No. - 43)
4.1 Attractive Opportunities in Optoelectronic Components Market
4.2 Market in APAC, By Country and Vertical
4.3 Market, By Material
4.4 Market, By Application
4.5 Market, By Component, 2025
4.6 Market, By Vertical
4.7 Market, By Country
5 Market Overview (Page No. - 47)
5.1 Introduction
5.2 Market Dynamics
5.2.1 Drivers
5.2.1.1 Increased use of Infrared Components in Consumer Electronics and Automobiles
5.2.1.2 Long Life and Low Power Consumption
5.2.1.3 Demand for Improved Imaging and Optical Sensing Solutions in Healthcare Vertical
5.2.1.4 Ability to Operate in Extreme Environment
5.2.2 Restraints
5.2.2.1 Availability of Cheaper Substitute Technologies to LED
5.2.3 Opportunities
5.2.3.1 Advancements in Technology Such as Li-Fi
5.2.3.2 Innovation for Improvements in Functional Capabilities
5.2.3.3 Promising Industrial IoT Applications
5.2.4 Challenges
5.2.4.1 High Cost of Raw Materials
5.2.4.2 Regulatory Barriers
5.3 Value Chain Analysis
6 Optoelectronic Components Market, By Component (Page No. - 57)
6.1 Introduction
6.2 Sensors
6.2.1 Phototransistor
6.2.1.1 Low Cost and High Current Amplification Property Boost Demand for Phototransistors
6.2.2 Photodiode
6.2.2.1 Quick Response Time and Ability to Operate in High Temperatures Drive Demand for Photodiodes
6.2.3 Photo Relay
6.2.3.1 Ability to Work as Both, Forward and Reserve-Biased Components Boosts the Demand for Photo Relays
6.2.4 Image Sensor
6.2.4.1 CMOS Image Sensor
6.2.4.1.1 Low Price and Less Expensive Fabrication Drive the Demand for CMOS Image Sensors
6.2.4.2 CCD Image Sensor
6.2.4.2.1 Applications in Medical and Machine Vision Drive the Demand for CCD Image Sensors
6.2.4.3 Hybrid Image Sensor
6.2.4.3.1 Key Performance Parameters of Hybrid Image Sensors Include Sensitivity, Speed, Dynamic Range, High Efficiency & Resolution, and Field of View
6.2.5 Optical Sensor
6.2.5.1 Advantages Such as High Sensitivity, Electrical Passiveness, and Wide Dynamic Range Drive Market Growth for Optical Sensors
6.2.6 UV Sensor
6.2.6.1 UV Sensors Find Wide Application in Automobiles, Pharmaceuticals, and Robotics
6.3 LED
6.3.1 General LED
6.3.1.1 Lower Power Consumption and Longer Life Expectancy Boosting Demand for LEDs
6.3.2 UV LED
6.3.2.1 Applications Such as Sterilization and Counterfeit Detection Boost UV LED Demand
6.3.3 Organic LED
6.3.3.1 Low Power Consumption of Oled Drives the Market for This Segment
6.4 Laser Diode
6.4.1 Lightweight, Energy-Efficient, and Low Intensity Properties Drive Demand for Laser Diode
6.5 Infrared Components
6.5.1 Infrared (IR) Detector
6.5.1.1 Applications Such as Flame & Gas Detection and Night Vision Boost the Demand for IR Detectors
6.5.2 Infrared Emitting Diode (IRED)
6.5.2.1 Applications in Security Cameras and Surveillance Boost Demand for IRED
6.5.3 Irda Transceiver
6.5.3.1 Application in Telecommunication is Boosting the Demand for Irda Transceivers
7 Optoelectronic Components Market, By Material (Page No. - 70)
7.1 Introduction
7.2 Gallium Nitride
7.2.1 Gan Accounted for the Largest Share in the Market
7.3 Gallium Arsenide
7.3.1 Gaas has Application in Diodes, Field Effect Transistors (FETS), and Integrated Circuits (ICS)
7.4 Indium Phosphide
7.4.1 Indium Phosphide Serves as a Substrate for Epitaxial Indium Gallium Arsenide, Which is Used in Optoelectronic Components
7.5 Silicon Germanium
7.5.1 Sige is a Commonly Used Compound Semiconductor Material in Integrated Circuits
7.6 Gallium Phosphide
7.6.1 a Short Life Span at High Current Makes Gallium Phosphide Suitable for Low Current and Low Power Applications
7.7 Silicon Carbide
7.7.1 Silicon Carbide to Have the Highest Growth Rate
8 Optoelectronic Components Market, By Application (Page No. - 80)
8.1 Introduction
8.2 MEAsurement
8.2.1 Measurement Application to Grow at the Highest Growth Rate
8.3 Lighting
8.3.1 LEDs are Widely Used in Several Lighting Applications
8.4 Communications
8.4.1 Optoelectronic Components Such as Infrared Detectors and Laser Diodes are Widely Used for Communication Applications
8.5 Security & Surveillance
8.5.1 Optoelectronic Components are Being Used for Security & Surveillance in CCTV Cameras and for Facial Recognition
8.6 Others
8.6.1 Laser Diodes, Image Sensors, Infrared Transmitters, and Detectors are Used in Scanning and Spectrometry Applications
9 Optoelectronic Components Market, By Vertical (Page No. - 88)
9.1 Introduction
9.2 Consumer Electronics
9.2.1 Consumer Electronic Devices
9.2.1.1 Optoelectronic Components Such as LEDs, Image Sensors, IR Components, Laser Diodes, and Phototransistors are Extensively Used in
Consumer Electronic Devices
9.2.2 Smart Home Devices
9.2.2.1 Optoelectronic Components Such as Sensors, LEDs, and IR Components are Used for Smart Home Devices
9.2.3 Wearable Devices
9.2.3.1 LEDs, Image Sensors, and Optical Sensors are Used By Wearable Devices
9.3 Residential
9.3.1 LED is One of the Prominent Components Used in the Residential Vertical
9.4 Commercial
9.4.1 Laser Didoes, Image Sensors, Phototransistors, Photo Diodes, Photo Relays are Widely Used in the Commercial Vertical
9.5 Industrial
9.5.1 Cameras Supported By Infrared Sensors are Used in Industrial Vertical for Applications Like Machine Vision, Industrial Surveillance, and Robotic Vision
9.6 Automotive
9.6.1 LEDs and Image Sensors Find Application in Autonomous and Semi-Autonomous Vehicles
9.7 Telecommunication
9.7.1 Optoelectronic Components Find Application in Transmitters, Receivers, and Optical Amplifiers
9.8 Military & Aerospace
9.8.1 Military
9.8.1.1 Flexibility, Easy Integration, Ability to Work in Harsh Environments, and Durability Make Optoelectronic Components Suitable in the Military Vertical
9.8.2 Aerospace
9.8.2.1 Optoelectronic Components Find Usage in Aerospace for Distance Measurement Applications
9.9 Medical
9.9.1 Optoelectronic Components Such as LEDs and CCD & CMOS Image Sensors are Used Extensively Across a Wide Range of Medical Devices
9.10 Others
9.10.1 Utility
9.10.1.1 Optical Sensors are Used in Cable Tunnels, Cable Bridges, and Substation & Transformer Cables
9.10.2 Food & Beverages
9.10.2.1 LED Fixtures Find Application in Food & Beverage Companies
9.10.3 Pulp & Paper
9.10.3.1 Optical Sensors Can be Used to Measure Wood-Free Pulp
10 Geographic Analysis (Page No. - 118)
10.1 Introduction
10.2 North America
10.2.1 US
10.2.1.1 US Held Largest Share of Optoelectronic Components Market in North America
10.2.2 Canada
10.2.2.1 Robust Aviation Industry and Presence of Prominent Manufacturing and Automotive Players Likely to Increase Demand for Pressure Sensors in Canada
10.2.3 Mexico
10.2.3.1 Market in Mexico to Grow at the Highest Rate in North America
10.3 Europe
10.3.1 Germany
10.3.1.1 Germany Held the Largest Share of Market in Europe in 2019
10.3.2 UK
10.3.2.1 Automotive Sector and Industrial Automation are Likely to Propel Demand for Optoelectronic Components in the UK
10.3.3 France
10.3.3.1 Presence of Prominent Automotive, Aerospace & Defense, and Healthcare Companies to Drive Demand for Optoelectronic Components in France
10.3.4 Rest of Europe
10.3.4.1 Optoelectronic Components Market in RoE Will be Driven By Supportive Government Programs and Incentives
10.4 Asia Pacific
10.4.1 China
10.4.1.1 China Held the Largest Share of Market in APAC in 2019
10.4.2 Japan
10.4.2.1 Rapid Industrialization and Modernization Expected to Boost Demand for Optoelectronic Components in Japan
10.4.3 South Korea
10.4.3.1 Electronics and Automotive Verticals to Drive Demand for Optoelectronic Components in South Korea
10.4.4 India
10.4.4.1 Increasing Manufacturing Activity in India is Expected to Boost Growth in Demand for Optoelectronic Components
10.4.5 Rest of APAC
10.4.5.1 RoAPAC is an Attractive Destination for Investments in the Electronics Industry
10.5 Rest of the World
10.5.1 Middle East & Africa (MEA)
10.5.1.1 MEA Held a Larger Share of Market
in RoW 156
10.5.2 South America
10.5.2.1 Market in South America Expected to Grow at Higher CAGR in RoW
11 Competitive Landscape (Page No. - 158)
11.1 Introduction
11.2 Ranking Analysis of Players in Optoelectronic Components Market
11.3 Competitive Leadership Mapping
11.3.1 Visionary Leaders
11.3.2 Dynamic Differentiators
11.3.3 Innovators
11.3.4 Emerging Companies
11.4 Strength of Product Portfolio (25 Companies)
11.5 Business Strategy Excellence (25 Companies)
11.6 Competitive Scenario
11.6.1 Expansions
11.6.2 Product Launches
11.6.3 Mergers & Acquisitions
11.6.4 Partnerships, Collaborations, Joint Ventures, Strategic Alliances, Contracts
12 Company Profiles (Page No. - 175)
12.1 Key Players
(Business Overview, Products Offered, Recent Developments, SWOT Analysis, and MnM View)*
12.1.1 Hamamatsu
12.1.2 Osram
12.1.3 TT Electronics
12.1.4 Vishay
12.1.5 ON Semiconductor
12.1.6 Cree
12.1.7 Trumpf
12.1.8 SICK AG
12.1.9 Samsung
12.1.10 Sony
12.1.11 Broadcom
* Business Overview, Products Offered, Recent Developments, SWOT Analysis, and MnM View Might Not be Captured in Case of Unlisted Companies.
12.2 Right to Win
12.2.1 Hamamatsu
12.2.2 Osram
12.2.3 TT Electronics
12.2.4 Vishay
12.2.5 ON Semiconductor
12.3 Other Key Players
12.3.1 Omnivision
12.3.2 Micropac
12.3.3 Rohm
12.3.4 OSI System
12.3.5 Sharp
12.3.6 Newport
12.3.7 Himax
12.3.8 Renesas
12.3.9 Lite-On
12.3.10 SK Hynix
13 Appendix (Page No. - 232)
13.1 Insights of Industry Experts
13.2 Discussion Guide
13.3 Knowledge Store: Marketsandmarkets’ Subscription Portal
13.4 Available Customizations
13.5 Related Reports
13.6 Author Details
List of Tables (110 Tables)
Table 1 Optoelectronic Components Market, By Component, 2017–2025 (USD Million)
Table 2 Market for Sensors, By Region, 2017–2025 (USD Million)
Table 3 Market for LED, By Region, 2017–2025 (USD Million)
Table 4 Market for Laser Diode, By Region, 2017–2025 (USD Million)
Table 5 Market for Infrared Components, By Subcomponent, 2017–2025 (USD Million)
Table 6 Market for Infrared Components, By Region, 2017–2025 (USD Million)
Table 7 Market, By Material, 2017–2025 (USD Million)
Table 8 Gallium Nitride Market, By Region, 2017–2025 (USD Million)
Table 9 Gallium Arsenide Market, By Region, 2017–2025 (USD Million)
Table 10 Indium Phosphide Market, By Region, 2017–2025 (USD Million)
Table 11 Silicon Germanium Market, By Region, 2017–2025 (USD Million)
Table 12 Gallium Phosphide Market, By Region, 2017–2025 (USD Million)
Table 13 Silicon Carbide Market, By Region, 2017–2025 (USD Million)
Table 14 Market, By Application, 2017–2025 (USD Million)
Table 15 Market for Measurement, By Region, 2017–2025 (USD Million)
Table 16 Market for Lighting, By Region, 2017–2025 (USD Million)
Table 17 Market for Communications, By Region, 2017–2025 (USD Million)
Table 18 Market for Security & Surveillance, By Region, 2017–2025 (USD Million)
Table 19 Market for Other Applications, By Region, 2017–2025 (USD Million)
Table 20 Market, By Vertical, 2017–2025 (USD Million)
Table 21 Optoelectronic Components Market for Consumer Electronics, By Region, 2017–2025 (USD Million)
Table 22 APAC: Market for Consumer Electronics Vertical, By Country, 2017–2025 (USD Million)
Table 23 North America: Market for Consumer Electronics Vertical, By Country, 2017–2025 (USD Million)
Table 24 Europe: Market for Consumer Electronics Vertical, By Country, 2017–2025 (USD Million)
Table 25 RoW: Market for Consumer Electronics Vertical, By Region, 2017–2025 (USD Million)
Table 26 Market for Residential Vertical, By Region, 2017–2025 (USD Million)
Table 27 APAC: Market for Residential Vertical, By Country, 2017–2025 (USD Million)
Table 28 North America: Market for Residential Vertical, By Country, 2017–2025 (USD Million)
Table 29 Europe: Market for Residential Vertical, By Country, 2017–2025 (USD Million)
Table 30 RoW: Market for Residential Vertical, By Region, 2017–2025 (USD Million)
Table 31 Optoelectronic Components Market for Commercial Vertical, By Region, 2017–2025 (USD Million)
Table 32 APAC: Market for Commercial Vertical, By Country, 2017–2025 (USD Million)
Table 33 North America: Market for Commercial Vertical, By Country, 2017–2025 (USD Million)
Table 34 Europe: Market for Commercial Vertical, By Country, 2017–2025 (USD Million)
Table 35 RoW: Market for Commercial Vertical, By Region, 2017–2025 (USD Million)
Table 36 Market for Industrial Vertical, By Region, 2017–2025 (USD Million)
Table 37 APAC: Market for Industrial Vertical, By Country, 2017–2025 (USD Million)
Table 38 North America: Market for Industrial Vertical, By Country, 2017–2025 (USD Million)
Table 39 Europe: Market for Industrial Vertical, By Country, 2017–2025 (USD Million)
Table 40 RoW: Market for Industrial Vertical, By Region, 2017–2025 (USD Million)
Table 41 Optoelectronic Components Market for Automotive Vertical, By Region, 2017–2025 (USD Million)
Table 42 APAC: Market for Automotive Vertical, By Country, 2017–2025 (USD Million)
Table 43 North America: Market for Automotive Vertical, By Country, 2017–2025 (USD Million)
Table 44 Europe: Market for Automotive Vertical, By Country, 2017–2025 (USD Million)
Table 45 RoW: Market for Automotive Vertical, By Region, 2017–2025 (USD Million)
Table 46 Market for Telecommunication Vertical, By Region, 2017–2025 (USD Million)
Table 47 APAC: Market for Telecommunication, By Country, 2017–2025 (USD Million)
Table 48 North America: Market for Telecommunication Vertical, By Country, 2017–2025 (USD Million)
Table 49 Europe: Market for Telecommunication Vertical, By Country, 2017–2025 (USD Million)
Table 50 RoW: Market for Telecommunication, By Region, 2017–2025 (USD Million)
Table 51 Market for Military & Aerospace Vertical, By Region, 2017–2025 (USD Million)
Table 52 APAC: Market for Military & Aerospace Vertical, By Country, 2017–2025 (USD Million)
Table 53 North America: Market for Military & Aerospace Vertical, By Country, 2017–2025 (USD Million)
Table 54 Europe: Market for Military & Aerospace Vertical, By Country, 2017–2025 (USD Million)
Table 55 RoW: Market for Military & Aerospace Vertical, By Region, 2017–2025 (USD Million)
Table 56 Optoelectronic Components Market for Medical, By Region, 2017–2025 (USD Million)
Table 57 APAC: Market for Medical Vertical, By Country, 2017–2025 (USD Million)
Table 58 North America: Market for Medical Vertical, By Country, 2017–2025 (USD Million)
Table 59 Europe: Market for Medical Vertical, By Country, 2017–2025 (USD Million)
Table 60 RoW: Market for Medical Vertical, By Region, 2017–2025 (USD Million)
Table 61 Market for Other Verticals, By Region, 2017–2025 (USD Million)
Table 62 APAC: Market for Other Verticals, By Country, 2017–2025 (USD Million)
Table 63 North America: Market for Other Verticals, By Country, 2017–2025 (USD Million)
Table 64 Europe: Market for Other Verticals, By Country, 2017–2025 (USD Million)
Table 65 RoW: Market for Other Verticals, By Region, 2017–2025 (USD Million)
Table 66 Optoelectronic Components Market, By Region, 2017–2025 (USD Million)
Table 67 North America: Market, By Country, 2017–2025 (USD Million)
Table 68 North America: Market, By Component, 2017–2025 (USD Million)
Table 69 North America: Market, By Application, 2017–2025 (USD Million)
Table 70 North America: Market, By Material, 2017–2025 (USD Million)
Table 71 North America: Market, By Vertical, 2017–2025 (USD Million)
Table 72 US: Market, By Vertical, 2017–2025 (USD Million)
Table 73 US: Market, By Component, 2017–2025 (USD Million)
Table 74 Canada: Market, By Vertical, 2017–2025 (USD Million)
Table 75 Mexico: Market, By Vertical, 2017–2025 (USD Million)
Table 76 Europe: Optoelectronic Components Market, By Country, 2017–2025 (USD Million)
Table 77 Europe: Market, By Component, 2017–2025 (USD Million)
Table 78 Europe: Market, By Application, 2017–2025 (USD Million)
Table 79 Europe: Market, By Material, 2017–2025 (USD Million)
Table 80 Europe: Market, By Vertical, 2017–2025 (USD Million)
Table 81 Germany: Market, By Vertical, 2017–2025 (USD Million)
Table 82 Germany: Market, By Component, 2017–2025 (USD Million)
Table 83 UK: Optoelectronic Components Market, By Vertical, 2017–2025 (USD Million)
Table 84 UK: Market, By Component, 2017–2025 (USD Million)
Table 85 France: Market, By Vertical, 2017–2025 (USD Million)
Table 86 France: Market, By Component, 2017–2025 (USD Million)
Table 87 RoE: Market, By Vertical, 2017–2025 (USD Million)
Table 88 APAC: Market, By Country, 2017–2025 (USD Million)
Table 89 APAC: Market, By Component, 2017–2025 (USD Million)
Table 90 APAC: Market, By Application, 2017–2025 (USD Million)
Table 91 APAC: Market, By Material, 2017–2025 (USD Million)
Table 92 APAC: Market, By Vertical, 2017–2025 (USD Million)
Table 93 China: Market, By Vertical, 2017–2025 (USD Million)
Table 94 China: Market, By Component, 2017–2025 (USD Million)
Table 95 Japan: Market, By Vertical, 2017–2025 (USD Million)
Table 96 Japan: Market, By Component, 2017–2025 (USD Million)
Table 97 South Korea: Market, By Vertical, 2017–2025 (USD Million)
Table 98 India: Market, By Vertical, 2017–2025 (USD Million)
Table 99 RoAPAC: Market, By Vertical, 2017–2025 (USD Million)
Table 100 Optoelectronic Components Market in RoW, By Region, 2017–2025 (USD Million)
Table 101 RoW: Market, By Component, 2017–2025 (USD Million)
Table 102 RoW: Market, By Application, 2017–2025 (USD Million)
Table 103 RoW: Market, By Material, 2017–2025 (USD Million)
Table 104 RoW: Market, By Vertical, 2017–2025 (USD Million)
Table 105 MEA: Market, By Vertical, 2017–2025 (USD Million)
Table 106 South America: Market, By Vertical, 2017–2025 (USD Million)
Table 107 Expansions, 2016–2019
Table 108 Product Launches, 2016–2019
Table 109 Mergers & Acquisitions, 2016–2019
Table 110 Partnerships, Collaborations, Joint Ventures, Strategic Alliances, Contracts, 2016–2019
List of Figures (74 Figures)
Figure 1 Optoelectronic Components Market: Research Design
Figure 2 Market Size Estimation Methodology: Bottom-Up Approach
Figure 3 Market Size Estimation Methodology: Top-Down Approach
Figure 4 Data Triangulation
Figure 5 Assumptions for the Research Study
Figure 6 Optoelectronic Components Market, 2017–2025 (USD Million)
Figure 7 Consumer Electronics Vertical Accounted for Largest Share of Market in 2019
Figure 8 Measurement Application Held Largest Market Share in 2019
Figure 9 Gallium Nitride Accounted for Largest Market Share in 2019
Figure 10 Sensors Held Largest Share of Market, By Component, in 2019
Figure 11 Market, By Region, 2019
Figure 12 Increased use of Infrared Components in Consumer Electronics and Automobiles Drives Growth of Market
Figure 13 China and Consumer Electronics Held Largest Share of APAC Market in 2019
Figure 14 Gallium Nitride to Account for Largest Share of Market Based on Material During 2020–2025
Figure 15 Measurement Segment Expected to Exhibit Highest CAGR in Market, 2020–2025
Figure 16 Sensors Expected to Capture Largest Share of Market By 2025, By Component
Figure 17 Consumer Electronics Expected to Hold Largest Share of Market By 2025
Figure 18 China Accounted for Largest Share of Market in 2019
Figure 19 Impact of Drivers on the Market
Figure 20 Impact of Opportunities on the Market
Figure 21 Impact of Challenges and Restraints on Market
Figure 22 Smartphone Units Sold, By Region, Million Units (FY 2017)
Figure 23 Number of Visually Impaired Across the Globe, Million (FY 2010)
Figure 24 Value Chain Analysis: Major Value Added During Manufacturing and Assembly Phase
Figure 25 Optoelectronic Components Market, By Component
Figure 26 Market for Sensors to Grow at Highest CAGR During Forecast Period
Figure 27 Market for Sensors to Grow at Highest CAGR in North America During Forecast Period
Figure 28 Global LED Shipment, 2017–2025 (Million Units)
Figure 29 Market, By Material
Figure 30 Market for Silicon Carbide to Grow at Highest CAGR During Forecast Period
Figure 31 Gallium Nitride Market in North America to Grow at Highest CAGR During Forecast Period
Figure 32 Silicon Germanium Market in North America to Grow at Highest CAGR During Forecast Period
Figure 33 Optoelectronic Components, By Application
Figure 34 Optoelectronic Components Market for Measurement to Grow at Highest CAGR During Forecast Period
Figure 35 Measurement Market in North America to Grow at Highest CAGR During Forecast Period
Figure 36 Security & Surveillance Market in North America to Grow at Highest CAGR During Forecast Period
Figure 37 Market, By Vertical
Figure 38 Market for Automotive to Grow at Highest CAGR During Forecast Period
Figure 39 Market for Consumer Electronics in North America to Grow at Highest CAGR During Forecast Period
Figure 40 Residential Market in North America to Grow at Highest CAGR During Forecast Period
Figure 41 Commercial Market in North America to Grow at Highest CAGR During Forecast Period
Figure 42 Industrial Market in North America to Grow at Highest CAGR During Forecast Period
Figure 43 Automotive Market in North America to Grow at Highest CAGR During Forecast Period
Figure 44 Telecommunication Market in North America to Grow at Highest CAGR During Forecast Period
Figure 45 Military & Aerospace Market in North America to Grow at Highest CAGR During Forecast Period
Figure 46 Medical Market in North America to Grow at Highest CAGR During Forecast Period
Figure 47 Optoelectronic Components Market for Other Verticals in North America to Grow at Highest CAGR During Forecast Period
Figure 48 Geographic Snapshot: Market in Mexico to Grow at Highest CAGR During Forecast Period
Figure 49 North America to Witness Highest CAGR in Market During Forecast Period
Figure 50 Snapshot of Market in North America
Figure 51 Market in Mexico to Witness Highest CAGR in North America During Forecast Period
Figure 52 US Market for Automotive to Witness Highest CAGR During Forecast Period
Figure 53 Snapshot of Market in Europe
Figure 54 Market in Germany to Hold Largest Share in Europe During the Forecast Period
Figure 55 Germany Market for Automotive to Witness Highest CAGR During Forecast Period
Figure 56 Snapshot of Market in APAC
Figure 57 Market in India to Witness Highest CAGR During Forecast Period
Figure 58 China Market for Automotive to Witness Highest CAGR During Forecast Period
Figure 59 Market in South America to Witness Highest CAGR During Forecast Period
Figure 60 Major Players in Market Adopted Product Launches as Key Growth Strategy From 2016 to 2019
Figure 61 Top 5 Companies in Optoelectronic Components Market
Figure 62 Market (Global) Competitive Leadership Mapping, 2019
Figure 63 Market Evolution Framework: Product Launches, Followed By Expansions, Fueled Market Growth (2016–2018)
Figure 64 Hamamatsu: Company Snapshot
Figure 65 Osram: Company Snapshot
Figure 66 TT Electronics: Company Snapshot
Figure 67 Vishay: Company Snapshot
Figure 68 ON Semiconductor: Company Snapshot
Figure 69 Cree: Business Overview
Figure 70 Trumpf: Company Snapshot
Figure 71 SICK AG: Company Snapshot
Figure 72 Samsung: Company Snapshot
Figure 73 Sony Corporation: Company Snapshot
Figure 74 Broadcom: Company Snapshot
The study involved four major activities in estimating the current size of the optoelectronic components market. Exhaustive secondary research was done to collect information on the market, the peer market, and the parent market. The next step was to validate these findings, assumptions, and sizing with industry experts from across the value chain through primary research. Both top-down and bottom-up approaches were employed to estimate the complete market size. After that, market breakdown and data triangulation methods were used to estimate the market sizes of segments and subsegments.
Secondary Research
The research methodology used to estimate and forecast the optoelectronic components market begins with capturing data on the revenues of key vendors in the market through secondary research. This study involves the use of extensive secondary sources, directories, and databases such as Hoovers, Bloomberg Businessweek, Factiva, and OneSource to identify and collect information useful for the technical, market-oriented, and commercial study of market. Vendor offerings were also taken into consideration to determine the market segmentation. This entire research methodology includes studying annual and financial reports of top players, presentations, press releases, journals, paid databases, trade directories, regulatory bodies, and safety standard organizations.
Primary Research
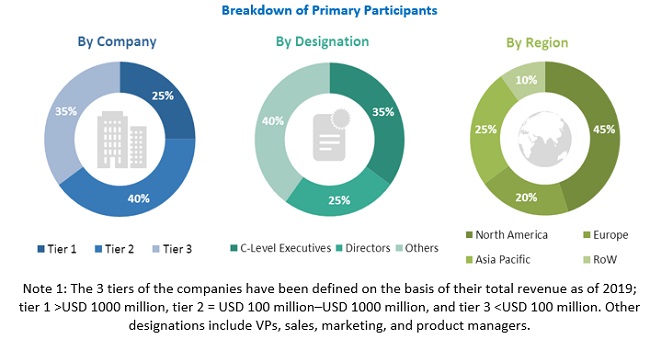
The supply chain in the optoelectronic components market comprises several stakeholders, such as suppliers of standard components, original equipment manufacturers (OEMs), component providers, solutions providers, and system integrators. The supply side is characterized by advancements in optoelectronic components and their applications in diverse end-user industries. Various primary sources from both the supply and demand sides of the market were interviewed to obtain qualitative and quantitative information. The breakdown of primary respondents is as follows.
Market Size Estimation
Both, the top-down and bottom-up approaches were used to estimate and validate the size of the optoelectronic components market and various market subsegments. The research methodology used to estimate the market sizes includes the following.
- Key players providing optoelectronic components to different verticals were identified through extensive secondary research.
- The industry’s supply chain and market size, in terms of value, were determined through primary and secondary research processes.
- All percentage shares, splits, and breakdowns were determined using secondary sources and verified through primary sources.
Data Triangulation
After arriving at the overall market size—using the estimation processes as explained above—the market was split into several segments and subsegments. To complete the overall market engineering process and arrive at the exact statistics of each market segment and subsegment, data triangulation, and market breakdown procedures were employed, wherever applicable. The data was triangulated by studying various factors and trends from both, the demand and supply sides of the optoelectronic components.
Research Objective
- To define and forecast the optoelectronic components market, by component, application, material, and vertical, in terms of value
- To define and forecast the LED market, in terms of volume
- To forecast the market size for various segments with regard to four main regions—North America, Europe, Asia Pacific (APAC), and the Rest of the World (RoW)
- To provide detailed information regarding major factors (drivers, restraints, opportunities, and challenges) influencing the growth of market
- To provide a detailed overview of the optoelectronic components value chain
- To strategically analyze the micromarkets with respect to individual growth trends, prospects, and contribution to the market
- To analyze opportunities in market for stakeholders by identifying high-growth segments
- To strategically profile key players, comprehensively analyze their market rankings and core competencies, and provide a detailed competitive landscape of market leaders
- To analyze competitive developments, such as contracts, mergers & acquisitions, product launches, and research & development (R&D) activities in market
Available Customizations:
Along with the market data, MarketsandMarkets offers customizations according to a company’s specific needs. The following customization options are available for the report:
Company Information
- Detailed analysis and profiling of additional market players (Up to 5)
Critical Questions:
- What will be the new end-user industries in which optoelectronic components can be used?
- Who are the key players in the market, and how intense is the competition?


Growth opportunities and latent adjacency in Optoelectronic Components Market
We're working about an assessment concerning the optoelectronics market, so we needed your report to improve the accuracy of our data.