Operational Analytics Market by Type (Software, Services), Business Function (IT, Marketing, Sales, Finance, HR), Deployment Models (On-Premises, On-Demand), Application, Industry Vertical, and Region - Global Forecast to 2021


[150 Pages Report] Operational Analytics is a type of business intelligence that enables business users to access operational data and analyze them to generate insights. The operational analytics market size is estimated to grow from USD 4.65 Billion in 2016 to USD 10.93 Billion by 2021, at a Compound Annual Growth Rate (CAGR) of 18.6%. The year 2015 is considered to be the base year, while the forecast period is 2016�2021.
Request for Customization to get Operational Analytics Market forecasts to 2024
Following are the objectives of the report:
- To define, describe, and forecast the operational analytics market on the basis of types, services, business functions, applications, deployment models, industry verticals, and regions
- To provide a detailed information regarding the major factors influencing the growth of the market (drivers, restraints, opportunities, and challenges)
- To strategically analyze the subsegments with respect to individual growth trends, future prospects, and contribution to the total market
- To analyze the opportunities in the market for stakeholders and to provide the details of a competitive landscape for major players
- To forecast the revenue of market segments with respect to all the major regions, namely, North America, Europe, Asia-Pacific (APAC), Middle East and Africa (MEA), and Latin America
- To strategically profile key players and comprehensively analyze their recent developments and positioning
- To analyze competitive developments such as mergers and acquisitions, new product developments, and Research and Development (R&D) activities in the market
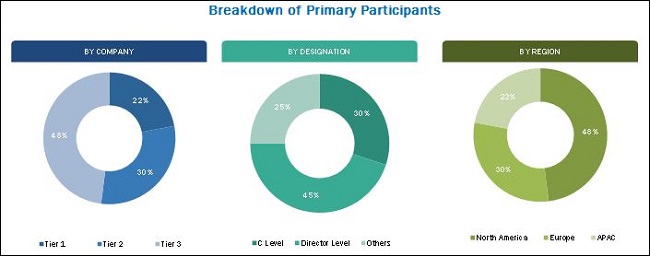
The research methodology used to estimate and forecast the operational analytics market begins with capturing data on key vendor�s revenues through secondary research sources such as companies� websites, Factiva, and Hoovers, among others. Other secondary sources include annual reports, press releases, and investor presentations of companies; white papers and certified publications; and articles from recognized authors, directories, and databases. The vendor offerings are also taken into consideration to determine the market segmentation. The bottom-up procedure was employed to arrive at the overall market size of the global operational analytics market from the revenue of the key players in the market. After arriving at the overall market size, the total market was split into several segments and subsegments, which were then verified through primary research by conducting extensive interviews with key people, such as CEOs, VPs, directors, and executives. The data triangulation and market breakdown procedures were employed to complete the overall market engineering process and to arrive at the exact statistics for all segments and subsegments. The breakdown of profiles of primary participants is depicted in the below figure.
To know about the assumptions considered for the study, download the pdf brochure
The operational analytics ecosystem comprises vendors, such as IBM Corporation (U.S.), Oracle Corporation (U.S.), Microsoft Corporation (U.S.), SAS Institute (U.S.), HPE (U.S.), SAP SE (Germany), Alteryx (U.S.), Cloudera (U.S.), Bentley Systems (U.S.), and Splunk (U.S.). Other stakeholders of the operational analytics market include analytics service providers, consulting service providers, IT service providers, resellers, enterprise users, and technology providers.
The target audiences of the operational analytics market report are given below:
- Solution vendors
- Original Equipment Manufacturers (OEMs)
- System integrators
- Advisory firms
- National regulatory authorities
- Venture capitalists
- Private equity groups
- Investment houses
- Equity research firms
�The study answers several questions for the stakeholders, primarily which market segments to focus in the next two to five years for prioritizing the efforts and investments.�
Scope of the Report
The research report categorizes the operational analytics market to forecast the revenues and analyze the trends in each of the following subsegments:
By Type
- Software
- Service
By Service
- Managed services
- Professional services
- Consulting services
- Deployment and integration
- Support and maintenance
By Business Function
- Information Technology (IT)
- Marketing
- Sales
- Finance
- Human Resources (HR)
- Others
By Application
- Predictive asset maintenance
- Risk management
- Fraud detection
- Supply chain management
- Customer management
- Workforce management
- Sales and marketing management
- Others
By Deployment Model
- On-premises
- Hosted/on-cloud
By Industry Vertical
- Telecommunication
- Retail and consumer goods
- Manufacturing
- Government and defense
- Energy and utilities
- Transportation and logistics
- Others
By Region
- North America
- Europe
- MEA
- APAC
- Latin America
Available Customizations
With the given market data, MarketsandMarkets offers customizations as per the company�s specific needs. The following customization options are available for the report:
Geographic Analysis
- Further breakdown of the North American market
- Further breakdown of the European market
- Further breakdown of the APAC market
- Further breakdown of the MEA market
- Further breakdown of the Latin American market
Company Information
- Detailed analysis and profiling of additional market players
The operational analytics market size is expected to grow from USD 4.65 Billion in 2016 to USD 10.93 Billion by 2021, at a Compound Annual Growth Rate (CAGR) of 18.6% during the forecast period. The major growth drivers of the market include data explosion due to emergence of IoT-enabled devices, increasing need for process & operations optimization & control, adoption of advanced data management strategies, and increasing focus on market & competitive intelligence.
The operational analytics market is segmented by software and service. The services segment is expected to grow at the highest CAGR during the forecast period. Among all the services, consulting services in the professional services segment is projected to witness the highest demand due to the growing need of operational analytics software solutions across organizations.
Manufacturing holds the largest share of the operational analytics market in 2016. The benefits of using operational analytics in the manufacturing sector are to create a competitive advantage by improving the efficiency across the product life-cycle and providing a relationship between decision-making and Return on Investment (ROI). The energy and utilities vertical is expected to grow at the highest CAGR during the forecast period due to the increasing need to store and manage data coming from oil wells, utility grids, gas grids, smart grids, and other sensors.
The major business functions for which the operational analytics is deployed are Information Technology (IT), marketing, sales, finance, Human Resources (HR). The adoption of operational analytics for marketing is expected to increase significantly in the coming years owing to the increasing need to measure the performance of key metrics such as market attribution, ROI, and ad-campaign effectiveness across industries.
Organizations are deploying operational analytics solutions either on their premises or on demand. The demand for on-demand or cloud-based operational analytics solutions is increasing due to its cost-effective and time-efficient features; its growth is specifically high in Small and Medium Enterprises (SMEs), where low- cost solutions are greatly required.
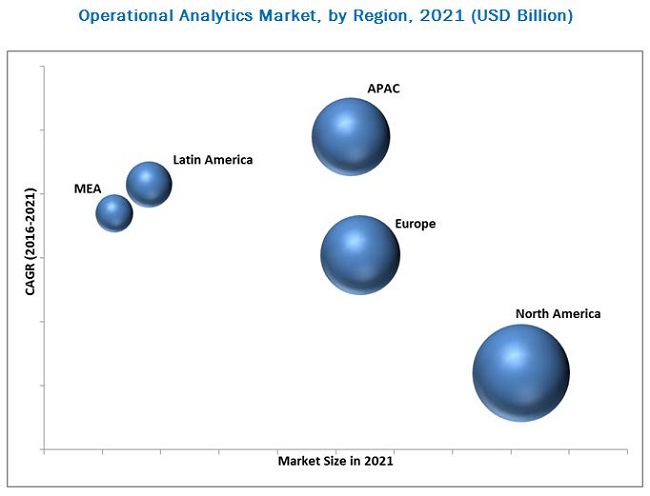
The global market has been segmented on the basis of regions into North America, Asia-Pacific (APAC), Europe, Middle East and Africa (MEA), and Latin America to provide a region-specific analysis in the report. The North American region, followed by Europe, is expected to continue being the largest revenue generating region for operational analytics vendors for the next five years. This is mainly because in the developed economies of the U.S. and Canada, there is a high focus on innovations obtained from research and development and technology. The APAC region is expected to be the fastest growing region in the operational analytics market because of the increasing adoption of Internet of Things (IoT) and smart technologies and various government initiatives such as smart cities across APAC countries including China and India.
Managing data quality & security and lack of sufficiently skilled staff are some of the challenges for the operational analytics market. Factors such as organizational change and complex analytical process are expected to limit the market growth.
Major vendors that offer operational analytics software and services globally are IBM Corporation (U.S.), Oracle Corporation (U.S.), Microsoft Corporation (U.S.), SAS Institute (U.S.), HPE (U.S.), SAP SE (Germany), Alteryx (U.S.), Cloudera (U.S.), Bentley Systems (U.S.), and Splunk (U.S.). These vendors have adopted different types of organic and inorganic growth strategies such as new product launches, partnerships & collaborations, and acquisitions to expand their offerings in the operational analytics market.
To speak to our analyst for a discussion on the above findings, click Speak to Analyst
 Exclusive indicates content/data unique to MarketsandMarkets and not available with any competitors.
Table of Contents
1 Introduction (Page No. - 14)
1.1 Objectives of the Study
1.2 Market Definition
1.3 Market Scope
1.3.1 Markets Covered
1.3.2 Years Considered in the Report
1.4 Currency
1.5 Limitations
1.6 Stakeholders
2 Research Methodology (Page No. - 18)
2.1 Research Data
2.1.1 Secondary Data
2.1.1.1 Key Data From Secondary Sources
2.1.2 Primary Data
2.1.2.1 Key Data From Primary Sources
2.1.2.2 Key Industry Insights
2.1.2.3 Breakdown of Primaries
2.2 Market Size Estimation
2.3 Market Breakdown and Data Triangulation
2.4 Research Assumptions
3 Executive Summary (Page No. - 26)
4 Premium Insights (Page No. - 32)
4.1 Attractive Market Opportunities in the Operational Analytics Market
4.2 Market Share Across Various Regions
4.3 Market Industry Vertical and Region Segment
4.4 Life Cycle Analysis, By Region, 2016
5 Market Overview (Page No. - 34)
5.1 Introduction
5.2 Market Evolution
5.3 Market Segmentation
5.3.1 By Type
5.3.2 By Service
5.3.3 By Professional Service
5.3.4 By Business Function
5.3.5 By Application
5.3.6 By Deployment Model
5.3.7 By Industry Vertical
5.3.8 By Region
5.4 Market Dynamics
5.4.1 Drivers
5.4.1.1 Data Explosion Due to Emergence of Iot-Enabled Technologies
5.4.1.2 Increasing Need for Process and Operations Optimization and Control
5.4.1.3 Adoption of Advanced Data Management Strategies
5.4.1.4 Increasing Focus on Market and Competitive Intelligence
5.4.2 Restraints
5.4.2.1 Organizational Change
5.4.2.2 Complex Analytical Process
5.4.3 Opportunities
5.4.3.1 Positive Roi
5.4.3.2 Changing Customer Experience
5.4.3.3 Increasing Adoption of Cloud
5.4.3.4 Higher Adoption By Smes
5.4.4 Challenges
5.4.4.1 Managing Data Quality and Security
5.4.4.2 Lack of Sufficiently Skilled Staff
6 Industry Trends (Page No. - 44)
6.1 Introduction
6.2 Value Chain Analysis
6.3 Data Governance for Operational Analytics
6.4 Strategic Benchmarking
7 Operational Analytics Market Analysis, By Type (Page No. - 47)
7.1 Introduction
7.2 Software
7.3 Services
7.3.1 Managed Services
7.3.2 Professional Services
7.3.2.1 System Deployment and Integration
7.3.2.2 Support and Maintenance
7.3.2.3 Consulting Services
8 Operational Analytics Market Analysis, By Business Function (Page No. - 56)
8.1 Introduction
8.2 Information Technology
8.3 Finance
8.4 Marketing
8.5 Sales
8.6 Human Resource
8.7 Others
9 Operational Analytics Market Analysis, By Application (Page No. - 63)
9.1 Introduction
9.2 Predictive Asset Maintenance
9.3 Risk Management
9.4 Fraud Detection
9.5 Supply Chain Management
9.6 Customer Management
9.7 Workforce Management
9.8 Sales and Marketing Management
9.9 Others
10 Operational Analytics Market Analysis, By Deployment Model (Page No. - 72)
10.1 Introduction
10.2 On-Premises
10.3 On-Demand
11 Operational Analytics Market Analysis, By Industry Vertical (Page No. - 76)
11.1 Introduction
11.2 Telecommunications
11.3 Retail and Consumer Goods
11.4 Manufacturing
11.5 Government and Defense
11.6 Energy and Utilities
11.7 Transportation and Logistics
11.8 Others
12 Geographic Analysis (Page No. - 84)
12.1 Introduction
12.2 North America
12.3 Europe
12.4 Asia-Pacific
12.5 Middle East and Africa
12.6 Latin America
13 Competitive Landscape (Page No. - 106)
13.1 Overview
13.2 Competitive Situations and Trends
13.2.1 New Product Launches and Developments
13.2.2 Partnerships, Collaborations, Strategic Alliances, and Agreements
13.2.3 Acquisitions
13.2.4 Venture Capital Funding
14 Company Profiles (Page No. - 113)
14.1 Introduction
(Overview, Financials, Products & Services, Strategy, and Developments)*
14.2 IBM Corporation
14.3 Oracle Corporation
14.4 Microsoft Corporation
14.5 SAS Institute, Inc.
14.6 Hewlett-Packard Enterprise
14.7 SAP SE
14.8 Alteryx, Inc.
14.9 Cloudera, Inc.
14.10 Bentley Systems, Inc.
14.11 Splunk, Inc.
*Details on Overview, Financials, Product & Services, Strategy, and Developments Might Not Be Captured in Case of Unlisted Companies.
15 Key Innovators (Page No. - 140)
15.1 Evolven Software
15.2 Continuity Software
15.3 Gavs Technologies
16 Appendix (Page No. - 143)
16.1 Insights of Industry Experts
16.2 Discussion Guide
16.3 Knowledge Store: Marketsandmarkets� Subscription Portal
16.4 Available Customization
16.5 Related Reports
16.6 Author Details
List of Tables (76 Tables)
Table 1 Operational Analytics Market Size, By Type, 2014�2021 (USD Million)
Table 2 Software: Market Size, By Region, 2014�2021 (USD Million)
Table 3 Services: Market Size, By Type, 2014�2021 (USD Million)
Table 4 Services: Market Size, By Region, 2014�2021 (USD Million)
Table 5 Managed Services: Market Size, By Region, 2014�2021 (USD Million)
Table 6 Professional Services: Market Size, By Region, 2014�2021 (USD Million)
Table 7 System Deployment and Integration: Market Size, By Region, 2014�2021 (USD Million)
Table 8 Support and Mantainance: Market Size, By Region, 2014�2021 (USD Million)
Table 9 Consulting Services: Market Size, By Region, 2014�2021 (USD Million)
Table 10 Operational Analytics Market Size, By Business Function, 2014�2021 (USD Million)
Table 11 Information Technology: Market Size, By Region, 2014�2021 (USD Million)
Table 12 Finance: Market Size, By Region, 2014�2021 (USD Million)
Table 13 Marketing: Market Size, By Region, 2014�2021 (USD Million)
Table 14 Sales: Market Size, By Region, 2014�2021 (USD Million)
Table 15 Human Resource: Market Size, By Region, 2014�2021 (USD Million)
Table 16 Others: Market Size, By Region, 2014�2021 (USD Million)
Table 17 Operational Analytics Market Size, By Application, 2014�2021 (USD Million)
Table 18 Predictive Asset Maintenance: Market Size, By Region, 2014�2021 (USD Million)
Table 19 Risk Management: Market Size, By Region, 2014�2021 (USD Million)
Table 20 Fraud Detection: Market Size, By Region, 2014�2021 (USD Million)
Table 21 Supply Chain Management: Market Size, By Region, 2014�2021 (USD Million)
Table 22 Customer Management: Market Size, By Region, 2014�2021 (USD Million)
Table 23 Workforce Manangement: Market Size, By Region, 2014�2021 (USD Million)
Table 24 Sales and Marketing Management: Market Size, By Region, 2014�2021 (USD Million)
Table 25 Others: Market Size, By Region, 2014�2021 (USD Million)
Table 26 Operational Analytics Market Size, By Deployment Model, 2014�2021 (USD Million)
Table 27 On-Premises: Market Size, By Region, 2014�2021 (USD Million)
Table 28 On-Demand: Market Size, By Region, 2014�2021 (USD Million)
Table 29 Operational Analytics Market Size, By Industry Vertical, 2014�2021 (USD Million)
Table 30 Telecommunications: Market Size, By Region, 2014�2021 (USD Million)
Table 31 Retail and Consumer Goods: Market Size, By Region, 2014�2021 (USD Million)
Table 32 Manufacturing: Operational Analytics Market Size, By Region, 2014�2021 (USD Million)
Table 33 Government and Defense: Market Size, By Region, 2014�2021 (USD Million)
Table 34 Energy and Utilities: Market Size, By Region, 2014�2021 (USD Million)
Table 35 Transportation and Logistics: Market Size, By Region, 2014�2021 (USD Million)
Table 36 Others: Market Size, By Region, 2014�2021 (USD Million)
Table 37 Operational Analytics Market Size, By Region, 2014�2021 (USD Million)
Table 38 North America: Market Size, By Type, 2014�2021 (USD Million)
Table 39 North America: Market Size, By Service, 2014�2021 (USD Million)
Table 40 North America: Market Size, By Professional Service, 2014�2021 (USD Million)
Table 41 North America: Market Size, By Deployment Model, 2014�2021 (USD Million)
Table 42 North America: Market Size, By Business Function, 2014�2021 (USD Million)
Table 43 North America: Market Size, By Application, 2014�2021 (USD Million)
Table 44 North America: Market Size, By Industry Vertical, 2014�2021 (USD Million)
Table 45 Europe: Market Size, By Type, 2014�2021 (USD Million)
Table 46 Europe: Market Size, By Service, 2014�2021 (USD Million)
Table 47 Europe: Market Size, By Professional Service, 2014�2021 (USD Million)
Table 48 Europe: Market Size, By Business Function, 2014�2021 (USD Million)
Table 49 Europe: Market Size, By Application, 2014�2021 (USD Million)
Table 50 Europe: Market Size, By Deployment Model, 2014�2021 (USD Million)
Table 51 Europe: Market Size, By Industry Vertical, 2014�2021 (USD Million)
Table 52 Asia-Pacific: Market Size, By Type, 2014�2021 (USD Million)
Table 53 Asia-Pacific: Market Size, By Service, 2014�2021 (USD Million)
Table 54 Asia-Pacific: Market Size, By Professional Service, 2014�2021 (USD Million)
Table 55 Asia-Pacific: Market Size, By Business Function, 2014�2021 (USD Million)
Table 56 Asia-Pacific: Market Size, By Application, 2014�2021 (USD Million)
Table 57 Asia-Pacific: Market Size, By Deployment Model, 2014�2021 (USD Million)
Table 58 Asia-Pacific: Market Size, By Industry Vertical, 2014�2021 (USD Million)
Table 59 Middle East and Africa: Operational Analytics Market Size, By Type, 2014�2021 (USD Million)
Table 60 Middle East and Africa: Market Size, By Service, 2014�2021 (USD Million)
Table 61 Middle East and Africa: Market Size, By Professional Service, 2014�2021 (USD Million)
Table 62 Middle East and Africa: Market Size, By Business Function, 2014�2021 (USD Million)
Table 63 Middle East and Africa: Market Size, By Application, 2014�2021 (USD Million)
Table 64 Middle East and Africa: Market Size, By Deployment Model, 2014�2021 (USD Million)
Table 65 Middle East and Africa: Market Size, By Industry Vertical, 2014�2021 (USD Million)
Table 66 Latin America: Operational Analytics Market Size, By Type, 2014�2021 (USD Million)
Table 67 Latin America: Market Size, By Service, 2014�2021 (USD Million)
Table 68 Latin America: Market Size, By Professional Service, 2014�2021 (USD Million)
Table 69 Latin America: Market Size, By Business Function, 2014�2021 (USD Million)
Table 70 Latin America: Market Size, By Application, 2014�2021 (USD Million)
Table 71 Latin America: Market Size, By Deployment Model, 2014�2021 (USD Million)
Table 72 Latin America: Market Size, By Industry Vertical, 2014�2021 (USD Million)
Table 73 New Product Launches and Developments, 2013�2016
Table 74 Partnerships, Collaborations, Strategic Alliances, and Agreements, 2013�2016
Table 75 Acquisitions, 2013�2016
Table 76 Venture Capital Funding, 2013�2016
List of Figures (54 Figures)
Figure 1 Operational Analytics Market: Research Design
Figure 2 Market Size Estimation Methodology: Bottom-Up Approach
Figure 3 Market Size Estimation Methodology: Top-Down Approach
Figure 4 Data Triangulation
Figure 5 Operational Analytics Market is Expected to Grow in the Global Market During the Forecast Period 2016�2021
Figure 6 Market Snapshot on the Basis of Type (2016 vs 2021)
Figure 7 Market Snapshot on the Basis of Service (2016� 2021)
Figure 8 Market Snapshot on the Basis of Professional Service (2016�2021)
Figure 9 Market Snapshot on the Basis of Business Function (2016�2021)
Figure 10 Market Snapshot on the Basis of Application (2016� 2021)
Figure 11 Market Snapshot on the Basis of Deployment Model (2016�2021)
Figure 12 Market Snapshot on the Basis of Industry Vertical (2016 vs 2021)
Figure 13 Lucrative Market Prospects in the Market
Figure 14 North America Commands Over the Operational Analytics Market By Covering the Largest Market Size in 2016
Figure 15 Manufacturing, Government & Defense, and Telecommunications in Industry Vertical, and North America in the Region Segment is Expected to Gain the Largest Market Size in 2016
Figure 16 Asia-Pacific Soon to Enter Exponential Growth Phase During the Period, 2016�2021
Figure 17 Evolution of Operational Analytics
Figure 18 Operational Analytics Market Segmentation: By Type
Figure 19 Market Segmentation: By Service
Figure 20 Market Segmentation: By Professional Service
Figure 21 Market Segmentation: By Business Function
Figure 22 Market Segmentation: By Application
Figure 23 Market Segmentation: By Deployment Model
Figure 24 Market Segmentation: By Industry Vertical
Figure 25 Market Segmentation: By Region
Figure 26 Data Explosion Due to Emergence of IoT and Increasing Need for Process & Operations and Optimization & Control are the Major Driving Factors for the Operational Analytics Market
Figure 27 Operational Analytics Market: Value Chain Analysis
Figure 28 Operational Analytics Market: Strategic Benchmarking
Figure 29 Services Segment is Expected to Have the Highest CAGR During the Forecast Period
Figure 30 Managed Services Segment is Expected to Grow at the Highest CAGR During the Forecast Period
Figure 31 Support and Maintenance Services Segment is Expected to Have the Highest CAGR During the Forecast Period
Figure 32 Marketing Segment is Expected to Grow at the Highest CAGR During the Forecast Period
Figure 33 Sales and Marketing Management Segment is Expected to Grow at the Highest CAGR During the Forecast Period
Figure 34 On-Demand Deployment Model is Expected to Grow at the Higher CAGR During the Forecast Period
Figure 35 Energy and Utilities Vertical is Expected to Grow at the Highest CAGR During the Forecast Period
Figure 36 Asia-Pacific is Expected to Grow at the Highest CAGR During the Forecast Period
Figure 37 North America is Projected to Have the Largest Market Size in the Operational Analytics Market During the Forecast Period
Figure 38 North America Market Snapshot
Figure 39 Asia-Pacific Market Snapshot
Figure 40 Companies Adopted the Strategy of New Product Launch and Development as the Key Growth Strategy From 2013 to 2016
Figure 41 Market Evaluation Framework, 2014-2016
Figure 42 Battle for Market Share: New Product Launch and Development Was the Key Strategy Adopted By Top Players in the Operational Analytics Market During the Period 2013�2016
Figure 43 Geographic Revenue Mix of Top Four Market Players
Figure 44 IBM Corporation: Company Snapshot
Figure 45 IBM Corporation: SWOT Analysis
Figure 46 Oracle Corporation: Company Snapshot
Figure 47 Oracle Corporation: SWOT Analysis
Figure 48 Microsoft Corporation: SWOT Analysis
Figure 49 SAS Institute, Inc.: Company Snapshot
Figure 50 SAS Institute, Inc.: SWOT Analysis
Figure 51 Hewlett-Packard Enterprise: Company Snapshot
Figure 52 Hewlett-Packard Enterprise: SWOT Analysis
Figure 53 SAP SE: Company Snapshot
Figure 54 Splunk, Inc.: Company Snapshot


Growth opportunities and latent adjacency in Operational Analytics Market