Operating Room Management Market

Operating Room Management Market by Solution (OR Supply, Data Management, Communication, Anesthesia Information Management, Performance Management), Delivery Mode (On-premise, Cloud-based), End User, Region - Global Forecast to 2025

Report Code: HIT 2862 Sep, 2020, by marketsandmarkets.com

The global Operating Room Management Market in terms of revenue was estimated to be worth $2.4 billion in 2020 and is poised to reach $4.4 billion by 2025, growing at a CAGR of 12.4% from 2020 to 2025.The new research study consists of an industry trend analysis of the market. The new research study consists of industry trends, pricing analysis, patent analysis, conference and webinar materials, key stakeholders, and buying behaviour in the market.

Growth in this market can be attributed to factors such as the emphasis on cost control and efficiency improvement in hospitals, growing adoption of EHRs and other HCIT solutions, favorable government support, redevelopment projects, and the availability of funding to promote OR infrastructure. However, a dearth of skilled surgeons in integrated operating rooms and the high prices and maintenance costs of ORM software are expected to hinder the market growth.

Operating Room Management Market

To know about the assumptions considered for the study, Request for Free Sample Report

Operating Room Management Market Growth Dynamics

Drivers: Increasing emphasis on cost control and efficiency improvement in hospitals

The overall cost of healthcare delivery has grown significantly over the last few decades, mainly due to increasing health insurance premiums, the rising demand for quality healthcare services, rising geriatric population, and the increasing incidence of chronic disorders. Another important factor attributing to rising healthcare costs is the high dependency on traditional and outdated methods such as paper-based patient records, which leads to an increase in readmission rates, medical errors, and administration costs.

Different governments and healthcare systems worldwide are now focusing on controlling rising healthcare costs by minimizing patient readmissions, medical errors, and administration costs with the effective utilization of various healthcare IT solutions. Operating rooms or ORs account for 40% of the total hospital expenses and constitute ~70% of the total revenue generated. Thus, the effective management of operating rooms by consolidating and organizing all patient data for the surgical staff during a procedure and streamlining information across multiple platforms is regarded as one of the key areas for reducing healthcare costs. As a result, the growing emphasis on cost control and efficiency improvement in hospitals is expected to support the growth of this market in the coming year.

Restrains: High pricing and maintenance costs of ORM software

The adoption of ORM solutions has been particularly affected by its high installation and maintenance costs. ORM software, when once installed, also requires to be regularly updated as per the user’s requirement and software enhancements, thereby presenting recurring expenditure. Additionally, the maintenance of high-end IT-enabled systems typically costs more than the software itself. The annual maintenance cost is estimated to be 20-25% of the initial cost of the software licenses. Subsequently, it can be expected that the high costs incurred from the purchase, installation, maintenance, and upgrade of ORM software and solutions may negatively affect their overall adoption among end-users, thus restraining market growth to a certain extent.

Opportunities: Emerging markets and growing medical tourism

Brazil, Russia, India, China, and South Africa (BRICS) are among the fastest-growing economies in the world. According to the World Economic Forum, these emerging economies will account for around one-third of the global healthcare expenditure by 2020. More than half of the world’s population resides in India and China, owing to which these countries are home to a large patient base.

The increasing burden of cancer, improvements in healthcare infrastructure, a less-stringent regulatory environment, and growing medical tourism are encouraging players in the operating room management market to increase their presence in emerging countries. Owing to the expansion of the patient population base, the number of hospitals and surgical centers is also expected to increase in emerging countries in the coming years. Also, currently, governments in these countries are undertaking initiatives to expand and modernize their respective healthcare infrastructures.

Challenges: Consolidation of healthcare providers

One of the major challenges for operating room management solutions is the consolidation of healthcare providers. The number of independent health care providers has been decreasing as most healthcare providers are turning to mergers, acquisitions, and partnerships and are functioning under a health system rather than operating independently. On a 15-year basis, the percentage of hospitals functioning under a health system has increased from approximately 50% to approximately 65%. Today, over 70% of hospitals are operating as part of a health system rather than independently. This has led to few buyers in the market and may create an oligopsony condition, thus giving the buyers greater bargaining power, which may lead to an erosion of profit margins for operating room management solutions providers.

The software segment to hold the largest market share

Based on the component, the operating room management market is segmented into software and services. The software segment is expected to account for the largest share of the market. This segment is also expected to grow at the highest CAGR during the forecast period. The large share and high growth can be attributed to the growing installation of ORM software.

The data management and communication solutions segment to hold the largest market share

The solution segment is further segmented by data management & communication solutions, anesthesia information management systems, operating room supply management solutions, operating room scheduling solutions, performance management solutions, and other solutions. Data management & communication solutions accounted for the largest share of the operating room management market owing to the benefits such as easy sharing of patient status in perioperative care phases, tracking of the schedule compliance, and sharing of the media and information related to cases within different operating rooms or external hospital departments.

The cloud-based delivery mode to account for the highest growth rate during the forecast period

By delivery mode, the market is segmented into on-premise solutions, web-based solutions, and cloud-based solutions. The cloud-based solutions segment is expected to register the highest CAGR in this market during the forecast period. The high growth of this segment can primarily be attributed to advantages such as scalable data storage, scalable computing power, machine-learning capabilities, and faster data transfer between organizations of cloud platforms.

The hospitals end user segment to hold the largest market share

Based on end-users, the market is divided into hospitals and ambulatory surgery centers. Hospitals are accounted  for the largest share of the global operating room management market owing to the  rising demand for effective disease management, growing surgical procedural volumes in hospitals, and the increasing number of hospitals being set up in developing countries

Asia Pacific to witness significant growth

Geographically, the operating room management market is segmented into North America, Europe, Asia Pacific (APAC), and the Rest of the World. The market in the APAC is expected to grow at the highest CAGR over the next five years. The need to reduce healthcare costs, growing patient volume, and the rising need for accurate disease diagnosis and treatment drive market growth in the region.

Operating Room Management Market by Region

To know about the assumptions considered for the study, download the pdf brochure

Epic Systems Corporation (US), Cerner Corporation (US), MEDITECH (US), McKesson Corporation (US), GE Healthcare (US), Surgical Information Systems (US), Picis Clinical Solutions (US) are some of the leading players of the operating room management market.

Report Metric

Details

Base year considered

2019

Forecast period

2020–2025

Forecast units

Value (USD Billion)

Segments covered

By Component, By Solutions, By Delivery Mode, By End Users &  by region

Geographies covered

North America, Europe, Asia Pacific, ROW

Companies covered

The major market players include Epic Systems Corporation (US), Cerner Corporation (US), MEDITEC (US), McKesson Corporation (US), GE Healthcare (US), Surgical Information Systems (US), Picis Clinical Solutions (US) (Total 22 companies)

The study categorizes the operating room management market based on components, solutions, delivery mode, end-users at the regional and global levels.

By Component

  • Software
  • Services

By Solutions

  • Data management and communication solutions
  • Anesthesia information management systems
  • Operating room supply management solutions
  • Operating room scheduling solutions
  • Performance management solutions
  • Other solutions

By Delivery Mode

  • On-premise solutions
  • Cloud-based solutions

By End User

  • Hospitals
  • Ambulatory surgery centers

By Region

  • North America
    • US
    • Canada
  • Europe
    • Germany
    • UK
    • France
    • Italy
    • Spain
    • Switzerland
    • Netherlands
    • Sweden
    • Denmark
    • Rest of Europe (RoE)
  • Asia Pacific
    • Japan
    • China
    • India
    • Rest of APAC (RoAPAC)
  • RoW
    • Latin America
      • Brazil
      • Mexico
      • Colombia
      • Rest of Latin America
    • Middle East & Africa

Recent Developments

  • In 2020, MEDITECH (US) partnered with Steward Health Care System (US). The partnership will focus on implementing MEDITECH’s EHR in 18 sites located across Arizona, Texas, Utah, Arkansas, and Louisiana. This decision is a part of Steward’s “One Platform” strategy to bring all 35 hospitals under a single EHR.
  • In 2019, Surgical Information Systems LLC (US) launched a complete cloud-based software for ASCs, an all-in-one case management solution.
  • In 2019, Cerner Corporation (US) named AWS its preferred cloud provider. The agreement also focuses on accelerating Artificial Intelligence (AI), Machine Learning (ML), and other cutting-edge innovations in healthcare.
  • In 2019, Cerner acquired AbleVets (US). The acquisition will provide Cerner with greater scale and technical expertise in designing and implementing modernization solutions, particularly in the federal space.
  • In 2018, Epic Systems Corporation (US) partnered with DaVita, Inc. (US). This partnership aimed to support interoperability and discrete data collection. It is also focused on meeting the necessary documentation demands of users and their patients. DaVita will now be able to take advantage of the suite of tools and technologies that Epic EHR offers.

Frequently Asked Questions (FAQ):

To speak to our analyst for a discussion on the above findings, click Speak to Analyst


TABLE OF CONTENTS

1 INTRODUCTION (Page No. - 19)
    1.1 OBJECTIVES OF THE STUDY
    1.2 MARKET DEFINITION
    1.3 MARKET DEFINITION
           1.3.1 MARKETS COVERED
           1.3.2 YEARS CONSIDERED FOR THE REPORT
    1.4 CURRENCY
    1.5 LIMITATIONS
    1.6 STAKEHOLDERS
    1.7 SUMMARY OF CHANGES

2 RESEARCH METHODOLOGY (Page No. - 23)
    2.1 RESEARCH DATA
    2.2 RESEARCH METHODOLOGY STEPS
           2.2.1 SECONDARY DATA
                    2.2.1.1 Key data from secondary sources
           2.2.2 PRIMARY DATA
                    2.2.2.1 Key data from primary sources
    2.3 MARKET SIZE ESTIMATION METHODOLOGY
    2.4 MARKET DATA ESTIMATION AND TRIANGULATION
    2.5 ASSUMPTIONS FOR THE STUDY
    2.6 COVID-19-SPECIFIC ASSUMPTIONS
    2.7 RISK ASSESSMENT

3 EXECUTIVE SUMMARY (Page No. - 34)

4 PREMIUM INSIGHTS (Page No. - 38)
    4.1 GLOBAL OPERATING ROOM MANAGEMENT MARKET OVERVIEW
    4.2 NORTH AMERICA: OPERATING ROOM MANAGEMENT  MARKET, 2019
    4.3 OPERATING ROOM MANAGEMENT MARKET, BY DELIVERY MODE
    4.4 OPERATING ROOM MANAGEMENT MARKET:  GEOGRAPHIC GROWTH OPPORTUNITIES

5 MARKET OVERVIEW (Page No. - 41)
    5.1 INTRODUCTION
    5.2 MARKET DYNAMICS
           5.2.1 DRIVERS
                    5.2.1.1 Increasing emphasis on cost control and efficiency improvement in hospitals
                    5.2.1.2 Growing adoption of EHRs and other HCIT solutions
                    5.2.1.3 Favorable government support and initiatives for healthcare
                    5.2.1.4 Redevelopment projects and availability of funding to promote OR infrastructure
           5.2.2 RESTRAINTS
                    5.2.2.1 High pricing and maintenance costs of ORM software
                    5.2.2.1 Interoperability issues
           5.2.3 OPPORTUNITIES
                    5.2.3.1 Emerging markets and growing medical tourism
                    5.2.3.2 Technological advancements in hospitals
           5.2.4 CHALLENGES
                    5.2.4.1 Dearth of skilled surgeons in integrated operating rooms
                    5.2.4.2 Consolidation of healthcare providers
    5.3 IMPACT OF COVID-19 ON THE OPERATING ROOM MANAGEMENT MARKET
    5.4 VALUE CHAIN
    5.5 ECOSYSTEM
    5.6 TECHNOLOGY ANALYSIS

6 OPERATING ROOM MANAGEMENT MARKET, BY COMPONENT (Page No. - 50)
    6.1 INTRODUCTION
    6.2 SOFTWARE
           6.2.1 THE SOFTWARE SEGMENT COMMANDED THE LARGEST SHARE OF THE OPERATING ROOM MANAGEMENT MARKET
    6.3 SERVICES
           6.3.1 INCREASING ADOPTION OF ORM SOFTWARE AND THE INDISPENSABLE & RECURRING NATURE OF SERVICES TO DRIVE MARKET GROWTH

7 OPERATING ROOM MANAGEMENT MARKET, BY SOLUTION (Page No. - 53)
    7.1 INTRODUCTION
    7.2 DATA MANAGEMENT AND COMMUNICATION SOLUTIONS
           7.2.1 DATA MANAGEMENT AND COMMUNICATION SOLUTIONS TO ACCOUNT FOR THE LARGEST SHARE OF THE MARKET DURING THE FORECAST PERIOD
    7.3 ANESTHESIA INFORMATION MANAGEMENT SYSTEMS
           7.3.1 INCREASING ADOPTION OF AIMS SYSTEMS FOR CLINICAL DECISION MAKING TO SUPPORT MARKET GROWTH
    7.4 OPERATING ROOM SUPPLY MANAGEMENT SOLUTIONS
           7.4.1 FOCUS ON REDUCING HIGH EXPENDITURE INCURRED ON OPERATING ROOM SUPPLIES DRIVES MARKET GROWTH
    7.5 OPERATING ROOM SCHEDULING SOLUTIONS
           7.5.1 OR SCHEDULING SOLUTIONS HELPS REDUCE LABOR COSTS
    7.6 PERFORMANCE MANAGEMENT SOLUTIONS
           7.6.1 BENEFITS OF INCREASED EFFICIENCY AND PRODUCTIVITY TO SUPPORT THE GROWTH OF THIS SEGMENT
    7.7 OTHER SOLUTIONS

8 OPERATING ROOM MANAGEMENT MARKET, BY DELIVERY MODE (Page No. - 59)
    8.1 INTRODUCTION
    8.2 ON-PREMISE SOLUTIONS
           8.2.1 ENHANCED CONTROL AND COST BENEFITS OFFERED BY ON-PREMISE SOLUTIONS ARE MAJOR FACTORS SUPPORTING MARKET GROWTH
    8.3 CLOUD-BASED SOLUTIONS
           8.3.1 INCREASING NUMBER OF HEALTHCARE ORGANIZATIONS ARE SHIFTING FROM ON-PREMISE MODELS TO CLOUD-BASED MODELS THUS DRIVING MARKET GROWTH

9 OPERATING ROOM MANAGEMENT MARKET, BY END USER (Page No. - 63)
    9.1 INTRODUCTION
    9.2 HOSPITALS
           9.2.1 HOSPITALS TO DOMINATE THE OPERATING ROOM MANAGEMENT MARKET DURING THE FORECAST PERIOD
    9.3 AMBULATORY SURGERY CENTERS
           9.3.1 THE COST-EFFECTIVENESS OF AMBULATORY SURGERY CENTERS TO DRIVE MARKET GROWTH

10 OPERATING ROOM MANAGEMENT MARKET, BY REGION (Page No. - 67)
     10.1 INTRODUCTION
     10.2 NORTH AMERICA
             10.2.1 US
                        10.2.1.1 The US dominates the North American market during the forecast period
             10.2.2 CANADA
                        10.2.2.1 Government initiatives to support the adoption of integrated ORs
     10.3 EUROPE
             10.3.1 GERMANY
                        10.3.1.1 Germany dominates the European operating room management market
             10.3.2 UK
                        10.3.2.1 Growing patient volume to drive market growth in the UK
             10.3.3 FRANCE
                        10.3.3.1 Favorable health insurance system to drive the market for OR integration in the coming years
             10.3.4 ITALY
                        10.3.4.1 Growth in Italy’s medical tourism sector is expected to contribute to the demand for OR management solutions
             10.3.5 SPAIN
                        10.3.5.1 Healthcare expenditure has decreased in Spain, while overall waiting times have increased, thus driving demand for OR management solutions
             10.3.6 NETHERLANDS
                        10.3.6.1 High healthcare expenditure to drive the growth of the operating room management market in this region
             10.3.7 SWITZERLAND
                        10.3.7.1 Growing HCIT infrastructure to drive the growth of the operating room management market in this region
             10.3.8 DENMARK
                        10.3.8.1 Growing adoption of EHR to drive the growth of the operating room management market in this region
             10.3.9 SWEDEN
                        10.3.9.1 High spending on HCIT is a key driver of market growth in Sweden
             10.3.10 REST OF EUROPE
     10.4 ASIA PACIFIC
             10.4.1 JAPAN
                        10.4.1.1 Japan is the largest healthcare IT market in the APAC region
             10.4.2 CHINA
                        10.4.2.1 Large patient population and healthcare infrastructure improvements to drive market growth in China
             10.4.3 INDIA
                        10.4.3.1 The rising need for cost-effective technologies has increased  the demand for healthcare IT integration solutions in India
             10.4.4 ROAPAC
     10.5 REST OF THE WORLD
             10.5.1 LATIN AMERICA
                        10.5.1.1 Brazil
                                     10.5.1.1.1 Favorable universal health insurance system and government initiatives are expected to drive market growth
                        10.5.1.2 Mexico
                                     10.5.1.2.1 Initiatives for infrastructural improvement will support the growth of the Mexican market
                        10.5.1.3 Colombia
                                     10.5.1.3.1 Rising medical tourism and growing healthcare access indicate favorable growth prospects
                        10.5.1.4 Rest of Latin America
             10.5.2 MIDDLE EAST & AFRICA
                        10.5.2.1 UAE offers significant growth opportunities in the region

11 COMPETITIVE LANDSCAPE (Page No. - 119)
     11.1 INTRODUCTION
     11.2 MARKET EVALUATION FRAMEWORK
     11.3 MARKET RANKING/SHARE ANALYSIS
     11.4 KEY MARKET DEVELOPMENTS
             11.4.1 NEW PRODUCT LAUNCHES
             11.4.2 PARTNERSHIPS
             11.4.3 AGREEMENTS

12 COMPANY EVALUATION MATRIX AND PROFILES (Page No. - 124)
     12.1 INTRODUCTION
     12.2 COMPANY EVALUATION MATRIX DEFINITIONS AND METHODOLOGY
             12.2.1 STARS
             12.2.2 EMERGING LEADERS
             12.2.3 PERVASIVE PLAYERS
             12.2.4 EMERGING COMPANIES
     12.3 EPIC SYSTEMS CORPORATION
             12.3.1 BUSINESS OVERVIEW
             12.3.2 PRODUCTS OFFERED
             12.3.3 RECENT DEVELOPMENTS
             12.3.4 MNM VIEW
     12.4 CERNER CORPORATION
             12.4.1 BUSINESS OVERVIEW
             12.4.2 PRODUCTS OFFERED
             12.4.3 RECENT DEVELOPMENTS
             12.4.4 MNM VIEW
     12.5 MEDICAL INFORMATION TECHNOLOGY, INC.
             12.5.1 BUSINESS OVERVIEW
             12.5.2 PRODUCTS OFFERED
             12.5.3 RECENT DEVELOPMENTS
             12.5.4 MNM VIEW
     12.6 MCKESSON CORPORATION
             12.6.1 BUSINESS OVERVIEW
             12.6.2 PRODUCTS OFFERED
             12.6.3 RECENT DEVELOPMENTS
             12.6.4 MNM VIEW
     12.7 GE HEALTHCARE
             12.7.1 BUSINESS OVERVIEW
             12.7.2 PRODUCTS OFFERED
             12.7.3 MNM VIEW
     12.8 SURGICAL INFORMATION SYSTEMS LLC
             12.8.1 BUSINESS OVERVIEW
             12.8.2 PRODUCTS OFFERED
             12.8.3 RECENT DEVELOPMENTS
     12.9 PICIS CLINICAL SOLUTIONS INC
             12.9.1 BUSINESS OVERVIEW
             12.9.2 PRODUCTS OFFERED
             12.9.3 RECENT DEVELOPMENTS
     12.10 ALLSCRIPTS HEALTHCARE SOLUTIONS, INC.
             12.10.1 BUSINESS OVERVIEW
             12.10.2 PRODUCTS OFFERED
             12.10.3 RECENT DEVELOPMENTS
     12.11 BECTON, DICKINSON AND COMPANY
             12.11.1 BUSINESS OVERVIEW
             12.11.2 PRODUCTS OFFERED
             12.11.3 RECENT DEVELOPMENTS
     12.12 STERIS CORPORATION
             12.12.1 BUSINESS OVERVIEW
             12.12.2 PRODUCTS OFFERED
             12.12.3 RECENT DEVELOPMENTS
     12.13 DXC TECHNOLOGY
             12.13.1 BUSINESS OVERVIEW
             12.13.2 PRODUCTS OFFERED
             12.13.3 RECENT DEVELOPMENTS
     12.14 OMNICELL, INC.
             12.14.1 BUSINESS OVERVIEW
             12.14.2 PRODUCTS OFFERED
     12.15 UNITED HEALTH GROUP
             12.15.1 BUSINESS OVERVIEW
             12.15.2 PRODUCTS OFFERED
             12.15.3 RECENT DEVELOPMENTS
     12.16 NEXUS AG
             12.16.1 BUSINESS OVERVIEW
             12.16.2 PRODUCTS OFFERED
             12.16.3 RECENT DEVELOPMENTS
     12.17 GETINGE AB
             12.17.1 BUSINESS OVERVIEW
             12.17.2 PRODUCTS OFFERED
             12.17.3 RECENT DEVELOPMENTS
     12.18 BRAINLAB AG
             12.18.1 BUSINESS OVERVIEW
             12.18.2 PRODUCTS OFFERED
             12.18.3 RECENT DEVELOPMENTS
     12.19 RICHARD WOLF GMBH
             12.19.1 BUSINESS OVERVIEW
             12.19.2 PRODUCTS OFFERED
             12.19.3 RECENT DEVELOPMENTS
     12.20 KARL STORZ SE & CO. KG
             12.20.1 BUSINESS OVERVIEW
             12.20.2 PRODUCTS OFFERED
             12.20.3 RECENT DEVELOPMENTS
     12.21 CENSIS TECHNOLOGIES INC.
             12.21.1 BUSINESS OVERVIEW
             12.21.2 PRODUCTS OFFERED
     12.22 ANESTECH INNOVATION RISING
             12.22.1 BUSINESS OVERVIEW
             12.22.2 PRODUCTS OFFERED
     12.23 ALERT LIFE SCIENCES COMPUTING
             12.23.1 BUSINESS OVERVIEW
             12.23.2 PRODUCTS OFFERED
     12.24 GTPLAN SUPPLY CHAIN 4.0
             12.24.1 BUSINESS OVERVIEW
             12.24.2 PRODUCTS OFFERED

13 APPENDIX (Page No. - 170)
     13.1 DISCUSSION GUIDE
     13.2 KNOWLEDGE STORE: MARKETSANDMARKETS’ SUBSCRIPTION PORTAL
     13.3 AVAILABLE CUSTOMIZATIONS
     13.4 RELATED REPORTS
     13.5 AUTHOR DETAILS


LIST OF TABLES (138 TABLES)

TABLE 1 LIMITATIONS & ASSOCIATED RISKS
TABLE 2 DIGITAL TECHNOLOGY ENABLERS, THEIR BENEFITS, AND EXAMPLES IN THE OPERATING ROOM MANAGEMENT MARKET
TABLE 3 GLOBAL OPERATING ROOM MANAGEMENT MARKET, BY COMPONENT,  2020–2025 (USD MILLION)
TABLE 4 GLOBAL ORM SOFTWARE MARKET, BY REGION, 2020–2025 (USD MILLION)
TABLE 5 GLOBAL ORM SERVICES MARKET, BY REGION, 2020–2025 (USD MILLION)
TABLE 6 GLOBAL ORM MARKET, BY SOLUTION,  2020–2025 (USD MILLION)
TABLE 7 DATA MANAGEMENT AND COMMUNICATION SOLUTIONS MARKET, BY REGION,  2020–2025 (USD MILLION)
TABLE 8 ANESTHESIA INFORMATION MANAGEMENT SYSTEMS MARKET, BY REGION,  2020–2025 (USD MILLION)
TABLE 9 OPERATING ROOM SUPPLY MANAGEMENT SOLUTIONS MARKET, BY REGION,  2020–2025 (USD MILLION)
TABLE 10 OPERATING ROOM SCHEDULING SOLUTIONS MARKET, BY REGION,  2020–2025 (USD MILLION)
TABLE 11 PERFORMANCE MANAGEMENT SOLUTIONS MARKET, BY REGION,  2020–2025 (USD MILLION)
TABLE 12 OTHER ORM SOLUTIONS MARKET, BY REGION, 2020–2025 (USD MILLION)
TABLE 13 GLOBAL OPERATING ROOM MANAGEMENT MARKET, BY DELIVERY MODE,  2020–2025 (USD MILLION)
TABLE 14 ON-PREMISE DELIVERY MODE: PROS AND CONS
TABLE 15 ON-PREMISE ORM SOLUTIONS MARKET, BY REGION, 2020–2025 (USD MILLION)
TABLE 16 CLOUD-BASED DELIVERY MODE: PROS AND CONS
TABLE 17 CLOUD-BASED ORM SOLUTIONS MARKET, BY REGION, 2020–2025 (USD MILLION)
TABLE 18 GLOBAL OPERATING ROOM MANAGEMENT MARKET, BY END USER,  2020–2025 (USD MILLION)
TABLE 19 PERCENTAGE INCREASE IN THE NUMBER OF SURGICAL PROCEDURES PERFORMED IN THE US
TABLE 20 GLOBAL OPERATING ROOM MANAGEMENT MARKET FOR HOSPITALS, BY REGION,  2020–2025 (USD MILLION)
TABLE 21 GLOBAL OPERATING ROOM MANAGEMENT MARKET FOR AMBULATORY SURGERY CENTERS, BY REGION, 2020–2025 (USD MILLION)
TABLE 22 OPERATING ROOM MANAGEMENT MARKET, BY REGION, 2018–2025 (USD MILLION)
TABLE 23 NORTH AMERICA: OPERATING ROOM MANAGEMENT MARKET, BY COUNTRY,  2018–2025 (USD MILLION)
TABLE 24 NORTH AMERICA: OPERATING ROOM MANAGEMENT MARKET, BY COMPONENT,  2018–2025 (USD MILLION)
TABLE 25 NORTH AMERICA: OPERATING ROOM MANAGEMENT MARKET, BY SOLUTION,  2018–2025 (USD MILLION)
TABLE 26 NORTH AMERICA: OPERATING ROOM MANAGEMENT MARKET, BY DELIVERY MODE, 2018–2025 (USD MILLION)
TABLE 27 NORTH AMERICA: OPERATING ROOM MANAGEMENT MARKET, BY END USER,  2018–2025 (USD MILLION)
TABLE 28 US: OPERATING ROOM MANAGEMENT MARKET, BY COMPONENT,  2018–2025 (USD MILLION)
TABLE 29 US: OPERATING ROOM MANAGEMENT MARKET, BY SOLUTION,  2018–2025 (USD MILLION)
TABLE 30 US: OPERATING ROOM MANAGEMENT MARKET, BY DELIVERY MODE,  2018–2025 (USD MILLION)
TABLE 31 US: OPERATING ROOM MANAGEMENT MARKET, BY END USER,  2018–2025 (USD MILLION)
TABLE 32 CANADA: OPERATING ROOM MANAGEMENT MARKET, BY COMPONENT,  2018–2025 (USD MILLION)
TABLE 33 CANADA: OPERATING ROOM MANAGEMENT MARKET, BY SOLUTION,  2018–2025 (USD MILLION)
TABLE 34 CANADA: OPERATING ROOM MANAGEMENT MARKET, BY DELIVERY MODE,  2018–2025 (USD MILLION)
TABLE 35 CANADA: OPERATING ROOM MANAGEMENT MARKET, BY END USER,  2018–2025 (USD MILLION)
TABLE 36 EUROPE: OPERATING ROOM MANAGEMENT MARKET, BY COUNTRY,  2018–2025 (USD MILLION)
TABLE 37 EUROPE: OPERATING ROOM MANAGEMENT MARKET, BY COMPONENT,  2018–2025 (USD MILLION)
TABLE 38 EUROPE: OPERATING ROOM MANAGEMENT MARKET, BY SOLUTION,  2018–2025 (USD MILLION)
TABLE 39 EUROPE: OPERATING ROOM MANAGEMENT MARKET, BY DELIVERY MODE,  2018–2025 (USD MILLION)
TABLE 40 EUROPE: OPERATING ROOM MANAGEMENT MARKET, BY END USER,  2018–2025 (USD MILLION)
TABLE 41 GERMANY: OPERATING ROOM MANAGEMENT MARKET, BY COMPONENT,  2018–2025 (USD MILLION)
TABLE 42 GERMANY: OPERATING ROOM MANAGEMENT MARKET, BY SOLUTION,  2018–2025 (USD MILLION)
TABLE 43 GERMANY: OPERATING ROOM MANAGEMENT MARKET, BY DELIVERY MODE,  2018–2025 (USD MILLION)
TABLE 44 GERMANY: OPERATING ROOM MANAGEMENT MARKET, BY END USER,  2018–2025 (USD MILLION)
TABLE 45 UK: OPERATING ROOM MANAGEMENT MARKET, BY COMPONENT,  2018–2025 (USD MILLION)
TABLE 46 UK: OPERATING ROOM MANAGEMENT MARKET, BY SOLUTION,  2018–2025 (USD MILLION)
TABLE 47 UK: OPERATING ROOM MANAGEMENT MARKET, BY DELIVERY MODE,  2018–2025 (USD MILLION)
TABLE 48 UK: OPERATING ROOM MANAGEMENT MARKET, BY END USER,  2018–2025 (USD MILLION)
TABLE 49 FRANCE: OPERATING ROOM MANAGEMENT MARKET, BY COMPONENT,  2018–2025 (USD MILLION)
TABLE 50 FRANCE: OPERATING ROOM MANAGEMENT MARKET, BY SOLUTION,  2018–2025 (USD MILLION)
TABLE 51 FRANCE: OPERATING ROOM MANAGEMENT MARKET, BY DELIVERY MODE,  2018–2025 (USD MILLION)
TABLE 52 FRANCE: OPERATING ROOM MANAGEMENT MARKET, BY END USER,  2018–2025 (USD MILLION)
TABLE 53 ITALY: OPERATING ROOM MANAGEMENT MARKET, BY COMPONENT,  2018–2025 (USD MILLION)
TABLE 54 ITALY: OPERATING ROOM MANAGEMENT MARKET, BY SOLUTION,  2018–2025 (USD MILLION)
TABLE 55 ITALY: OPERATING ROOM MANAGEMENT MARKET, BY DELIVERY MODE,  2018–2025 (USD MILLION)
TABLE 56 ITALY: OPERATING ROOM MANAGEMENT MARKET, BY END USER,  2018–2025 (USD MILLION)
TABLE 57 SPAIN: OPERATING ROOM MANAGEMENT MARKET, BY COMPONENT,  2018–2025 (USD MILLION)
TABLE 58 SPAIN: OPERATING ROOM MANAGEMENT MARKET, BY SOLUTION,  2018–2025 (USD MILLION)
TABLE 59 SPAIN: OPERATING ROOM MANAGEMENT MARKET, BY DELIVERY MODE,  2018–2025 (USD MILLION)
TABLE 60 SPAIN: OPERATING ROOM MANAGEMENT MARKET, BY END USER,  2018–2025 (USD MILLION)
TABLE 61 NETHERLANDS: OPERATING ROOM MANAGEMENT MARKET, BY COMPONENT,  2018–2025 (USD MILLION)
TABLE 62 NETHERLANDS: OPERATING ROOM MANAGEMENT MARKET, BY SOLUTION,  2018–2025 (USD MILLION)
TABLE 63 NETHERLANDS: OPERATING ROOM MANAGEMENT MARKET, BY DELIVERY MODE,  2018–2025 (USD MILLION)
TABLE 64 NETHERLANDS: OPERATING ROOM MANAGEMENT MARKET, BY END USER,  2018–2025 (USD MILLION)
TABLE 65 SWITZERLAND: OPERATING ROOM MANAGEMENT MARKET, BY COMPONENT,  2018–2025 (USD MILLION)
TABLE 66 SWITZERLAND: OPERATING ROOM MANAGEMENT MARKET, BY SOLUTION,  2018–2025 (USD MILLION)
TABLE 67 SWITZERLAND: OPERATING ROOM MANAGEMENT MARKET, BY DELIVERY MODE,  2018–2025 (USD MILLION)
TABLE 68 SWITZERLAND: OPERATING ROOM MANAGEMENT MARKET, BY END USER,  2018–2025 (USD MILLION)
TABLE 69 DENMARK: OPERATING ROOM MANAGEMENT MARKET, BY COMPONENT,  2018–2025 (USD MILLION)
TABLE 70 DENMARK: OPERATING ROOM MANAGEMENT MARKET, BY SOLUTION,  2018–2025 (USD MILLION)
TABLE 71 DENMARK: OPERATING ROOM MANAGEMENT MARKET, BY DELIVERY MODE,  2018–2025 (USD MILLION)
TABLE 72 DENMARK: OPERATING ROOM MANAGEMENT MARKET, BY END USER,  2018–2025 (USD MILLION)
TABLE 73 SWEDEN: OPERATING ROOM MANAGEMENT MARKET, BY COMPONENT,  2018–2025 (USD MILLION)
TABLE 74 SWEDEN: OPERATING ROOM MANAGEMENT MARKET, BY SOLUTION,  2018–2025 (USD MILLION)
TABLE 75 SWEDEN: OPERATING ROOM MANAGEMENT MARKET, BY DELIVERY MODE,  2018–2025 (USD MILLION)
TABLE 76 SWEDEN: OPERATING ROOM MANAGEMENT MARKET, BY END USER,  2018–2025 (USD MILLION)
TABLE 77 REST OF EUROPE: OPERATING ROOM MANAGEMENT MARKET, BY COMPONENT,  2018–2025 (USD MILLION)
TABLE 78 REST OF EUROPE: OPERATING ROOM MANAGEMENT MARKET, BY SOLUTION,  2018–2025 (USD MILLION)
TABLE 79 REST OF EUROPE: OPERATING ROOM MANAGEMENT MARKET, BY DELIVERY MODE,  2018–2025 (USD MILLION)
TABLE 80 REST OF EUROPE: OPERATING ROOM MANAGEMENT MARKET, BY END USER,  2018–2025 (USD MILLION)
TABLE 81 ASIA PACIFIC: OPERATING ROOM MANAGEMENT MARKET, BY COUNTRY,  2018–2025 (USD MILLION)
TABLE 82 ASIA PACIFIC: OPERATING ROOM MANAGEMENT MARKET, BY COMPONENT,  2018–2025 (USD MILLION)
TABLE 83 ASIA PACIFIC: OPERATING ROOM MANAGEMENT MARKET, BY SOLUTION,  2018–2025 (USD MILLION)
TABLE 84 ASIA PACIFIC: OPERATING ROOM MANAGEMENT MARKET, BY DELIVERY MODE,  2018–2025 (USD MILLION)
TABLE 85 ASIA PACIFIC: OPERATING ROOM MANAGEMENT MARKET, BY END USER,  2018–2025 (USD MILLION)
TABLE 86 JAPAN: OPERATING ROOM MANAGEMENT MARKET, BY COMPONENT,  2018–2025 (USD MILLION)
TABLE 87 JAPAN: OPERATING ROOM MANAGEMENT MARKET, BY SOLUTION,  2018–2025 (USD MILLION)
TABLE 88 JAPAN: OPERATING ROOM MANAGEMENT MARKET, BY DELIVERY MODE,  2018–2025 (USD MILLION)
TABLE 89 JAPAN: OPERATING ROOM MANAGEMENT MARKET, BY END USER,  2018–2025 (USD MILLION)
TABLE 90 CHINA: OPERATING ROOM MANAGEMENT MARKET, BY COMPONENT,  2018–2025 (USD MILLION)
TABLE 91 CHINA: OPERATING ROOM MANAGEMENT MARKET, BY SOLUTION,  2018–2025 (USD MILLION)
TABLE 92 CHINA: OPERATING ROOM MANAGEMENT MARKET, BY DELIVERY MODE,  2018–2025 (USD MILLION)
TABLE 93 CHINA: OPERATING ROOM MANAGEMENT MARKET, BY END USER,  2018–2025 (USD MILLION)
TABLE 94 INDIA: OPERATING ROOM MANAGEMENT MARKET, BY COMPONENT,  2018–2025 (USD MILLION)
TABLE 95 INDIA: OPERATING ROOM MANAGEMENT MARKET, BY SOLUTION,  2018–2025 (USD MILLION)
TABLE 96 INDIA: OPERATING ROOM MANAGEMENT MARKET, BY DELIVERY MODE,  2018–2025 (USD MILLION)
TABLE 97 INDIA: OPERATING ROOM MANAGEMENT MARKET, BY END USER,  2018–2025 (USD MILLION)
TABLE 98 REST OF ASIA PACIFIC: OPERATING ROOM MANAGEMENT MARKET, BY COMPONENT,  2018–2025 (USD MILLION)
TABLE 99 REST OF ASIA PACIFIC: OPERATING ROOM MANAGEMENT MARKET, BY SOLUTION,  2018–2025 (USD MILLION)
TABLE 100 REST OF ASIA PACIFIC: OPERATING ROOM MANAGEMENT MARKET, BY DELIVERY MODE, 2018–2025 (USD MILLION)
TABLE 101 REST OF ASIA PACIFIC: OPERATING ROOM MANAGEMENT MARKET, BY END USER,  2018–2025 (USD MILLION)
TABLE 102 REST OF THE WORLD: OPERATING ROOM MANAGEMENT MARKET, BY COUNTRY,  2018–2025 (USD MILLION)
TABLE 103 REST OF THE WORLD: OPERATING ROOM MANAGEMENT MARKET, BY COMPONENT,  2018–2025 (USD MILLION)
TABLE 104 REST OF THE WORLD: OPERATING ROOM MANAGEMENT MARKET, BY SOLUTION,  2018–2025 (USD MILLION)
TABLE 105 REST OF THE WORLD: OPERATING ROOM MANAGEMENT MARKET, BY DELIVERY MODE,  2018–2025 (USD MILLION)
TABLE 106 REST OF THE WORLD: OPERATING ROOM MANAGEMENT MARKET, BY END USER,  2018–2025 (USD MILLION)
TABLE 107 LATIN AMERICA: OPERATING ROOM MANAGEMENT MARKET, BY COUNTRY,  2018–2025 (USD MILLION)
TABLE 108 LATIN AMERICA: OPERATING ROOM MANAGEMENT MARKET, BY COMPONENT,  2018–2025 (USD MILLION)
TABLE 109 LATIN AMERICA: OPERATING ROOM MANAGEMENT MARKET, BY SOLUTION,  2018–2025 (USD MILLION)
TABLE 110 LATIN AMERICA: OPERATING ROOM MANAGEMENT MARKET, BY DELIVERY MODE,  2018–2025 (USD MILLION)
TABLE 111 LATIN AMERICA: OPERATING ROOM MANAGEMENT MARKET, BY END USER,  2018–2025 (USD MILLION)
TABLE 112 BRAZIL: OPERATING ROOM MANAGEMENT MARKET, BY COMPONENT,  2018–2025 (USD MILLION)
TABLE 113 BRAZIL: OPERATING ROOM MANAGEMENT MARKET, BY SOLUTION,  2018–2025 (USD MILLION)
TABLE 114 BRAZIL: OPERATING ROOM MANAGEMENT MARKET, BY DELIVERY MODE,  2018–2025 (USD MILLION)
TABLE 115 BRAZIL: OPERATING ROOM MANAGEMENT MARKET, BY END USER,  2018–2025 (USD MILLION)
TABLE 116 MEXICO: OPERATING ROOM MANAGEMENT MARKET, BY COMPONENT,  2018–2025 (USD MILLION)
TABLE 117 MEXICO: OPERATING ROOM MANAGEMENT MARKET, BY SOLUTION,  2018–2025 (USD MILLION)
TABLE 118 MEXICO: OPERATING ROOM MANAGEMENT MARKET, BY DELIVERY MODE,  2018–2025 (USD MILLION)
TABLE 119 MEXICO: OPERATING ROOM MANAGEMENT MARKET, BY END USER,  2018–2025 (USD MILLION)
TABLE 120 COLOMBIA: OPERATING ROOM MANAGEMENT MARKET, BY COMPONENT,  2018–2025 (USD MILLION)
TABLE 121 COLOMBIA: OPERATING ROOM MANAGEMENT MARKET, BY SOLUTION,  2018–2025 (USD MILLION)
TABLE 122 COLOMBIA: OPERATING ROOM MANAGEMENT MARKET, BY DELIVERY MODE,  2018–2025 (USD MILLION)
TABLE 123 COLOMBIA: OPERATING ROOM MANAGEMENT MARKET, BY END USER,  2018–2025 (USD MILLION)
TABLE 124 REST OF LATIN AMERICA: OPERATING ROOM MANAGEMENT MARKET, BY COMPONENT, 2018–2025 (USD MILLION)
TABLE 125 REST OF LATIN AMERICA: OPERATING ROOM MANAGEMENT MARKET, BY SOLUTION,  2018–2025 (USD MILLION)
TABLE 126 REST OF LATIN AMERICA: OPERATING ROOM MANAGEMENT MARKET, BY DELIVERY MODE, 2018–2025 (USD MILLION)
TABLE 127 REST OF LATIN AMERICA: OPERATING ROOM MANAGEMENT MARKET, BY END USER,  2018–2025 (USD MILLION)
TABLE 128 MIDDLE EAST & AFRICA: OPERATING ROOM MANAGEMENT MARKET, BY COMPONENT, 2018–2025 (USD MILLION)
TABLE 129 MIDDLE EAST & AFRICA: OPERATING ROOM MANAGEMENT MARKET, BY SOLUTION,  2018–2025 (USD MILLION)
TABLE 130 MIDDLE EAST & AFRICA: OPERATING ROOM MANAGEMENT MARKET, BY DELIVERY MODE, 2018–2025 (USD MILLION)
TABLE 131 MIDDLE EAST & AFRICA: OPERATING ROOM MANAGEMENT MARKET, BY END USER,  2018–2025 (USD MILLION)
TABLE 132 OPERATING ROOM MANAGEMENT MARKET RANKING ANALYSIS, BY PLAYER, 2019
TABLE 133 NEW PRODUCT LAUNCHES, 2018–2020
TABLE 134 ACQUISITIONS, 2017–2020
TABLE 135 PARTNERSHIPS, 2018–2020
TABLE 136 AGREEMENTS, 2018–2020
TABLE 137 COLLABORATIONS, 2017–2020
TABLE 138 COMPANY EVALUATION MATRIX: CRITERIA


LIST OF FIGURES (40 FIGURE)

FIGURE 1 OPERATING ROOM MANAGEMENT MARKET SEGMENTATION
FIGURE 2 RESEARCH METHODOLOGY: OPERATING ROOM MANAGEMENT MARKET
FIGURE 3 RESEARCH DESIGN
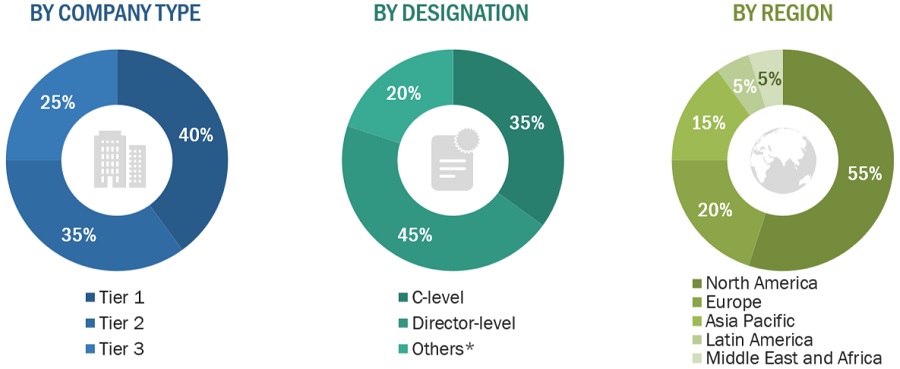
FIGURE 4 BREAKDOWN OF PRIMARY INTERVIEWS: BY COMPANY TYPE, DESIGNATION,  AND REGION
FIGURE 5 PRIMARY SOURCES
FIGURE 6 RESEARCH METHODOLOGY: HYPOTHESIS BUILDING
FIGURE 7 MARKET SIZE ESTIMATION: REVENUE SHARE ANALYSIS
FIGURE 8 ADOPTION-BASED MARKET SIZE ESTIMATION: OPERATING ROOM MANAGEMENT MARKET
FIGURE 9 ADOPTION-BASED MARKET SIZE ESTIMATION: ANAESTHESIA INFORMATION MANAGEMENT SYSTEM
FIGURE 10 DATA TRIANGULATION METHODOLOGY
FIGURE 11 OPERATING ROOM MANAGEMENT MARKET, BY COMPONENT, 2020 VS. 2025
FIGURE 12 OPERATING ROOM MANAGEMENT MARKET, BY SOLUTION, 2020 VS. 2025
FIGURE 13 OPERATING ROOM MANAGEMENT MARKET, BY DELIVERY MODE, 2020 VS. 2025
FIGURE 14 OPERATING ROOM MANAGEMENT MARKET, BY END USER, 2020 VS. 2025
FIGURE 15 GEOGRAPHICAL SNAPSHOT OF THE OPERATING ROOM MANAGEMENT MARKET
FIGURE 16 EMPHASIS ON COST CONTROL IS EXPECTED TO DRIVE THE OPERATING ROOM MANAGEMENT MARKET
FIGURE 17 CLOUD-BASED DELIVERY MODE ACCOUNTED FOR THE LARGEST SHARE OF THE NORTH AMERICAN OPERATING ROOM MANAGEMENT MARKET IN 2019
FIGURE 18 ON-PREMISE SEGMENT IS ESTIMATED TO ACCOUNT FOR THE LARGEST MARKET SHARE IN 2020
FIGURE 19 ASIA PACIFIC MARKET TO WITNESS THE HIGHEST GROWTH DURING  THE FORECAST PERIOD
FIGURE 20 OPERATING ROOM MANAGEMENT MARKET: DRIVERS, RESTRAINTS, OPPORTUNITIES, AND CHALLENGES
FIGURE 21 IMPACT OF COVID-19 ON THE OPERATING ROOM MANAGEMENT MARKET
FIGURE 22 OPERATING ROOM MANAGEMENT MARKET: VALUE CHAIN
FIGURE 23 OPERATING ROOM MANAGEMENT MARKET: ECOSYSTEM
FIGURE 24 NORTH AMERICA WILL CONTINUE TO DOMINATE THE OPERATING ROOM MANAGEMENT MARKET DURING THE FORECAST PERIOD
FIGURE 25 NORTH AMERICA: OPERATING ROOM MANAGEMENT MARKET SNAPSHOT
FIGURE 26 ASIA PACIFIC: OPERATING ROOM MANAGEMENT MARKET SNAPSHOT
FIGURE 27 MARKET EVALUATION FRAMEWORK
FIGURE 28 OPERATING ROOM MANAGEMENT MARKET COMPANY EVALUATION MATRIX, 2019
FIGURE 29 CERNER CORPORATION: COMPANY SNAPSHOT (2019)
FIGURE 30 MEDITECH: COMPANY SNAPSHOT (2019)
FIGURE 31 MCKESSON CORPORATION: COMPANY SNAPSHOT (2019)
FIGURE 32 GE HEALTHCARE: COMPANY SNAPSHOT (2019)
FIGURE 33 ALLSCRIPTS HEALTHCARE SOLUTIONS, INC.: COMPANY SNAPSHOT (2019)
FIGURE 34 BECTON, DICKINSON AND COMPANY: COMPANY SNAPSHOT (2019)
FIGURE 35 STERIS CORPORATION: COMPANY SNAPSHOT (2019)
FIGURE 36 DXC TECHNOLOGY COMPANY: COMPANY SNAPSHOT (2019)
FIGURE 37 OMNICELL, INC.: COMPANY SNAPSHOT (2019)
FIGURE 38 UNITED HEALTH GROUP: COMPANY SNAPSHOT (2019)
FIGURE 39 NEXUS AG: COMPANY SNAPSHOT (2019)
FIGURE 40 GETINGE AB: COMPANY SNAPSHOT (2019)

This study involved four major activities in estimating the size of the operating room management market. Exhaustive secondary research was done to collect information on the market, peer market, and parent market. The next step was to validate these findings, assumptions, and sizing with industry experts across value chains through primary research. The bottom-up approach was employed to estimate the overall market size. After that, market breakdown and data triangulation were used to estimate the market size of segments and sub-segments.

Secondary Research

The secondary research process involved the widespread use of secondary sources, directories, databases (such as Bloomberg Businessweek, Factiva, and D&B Hoovers), white papers, annual reports, company house documents, investor presentations, and SEC filings of companies. Some non-exclusive secondary sources include the Dubai Health Authority (DHA), American Association of Healthcare Administrative Management (AAHAM), Institute for Health Technology Transformation (iHT2 ), World Health Organization (WHO), Centers for Disease Control and Prevention (CDC), Organisation for Economic Co-operation and Development (OECD), Office of the National Coordinator for Health Information Technology (ONC), Healthcare Information and Management Systems Society (HIMSS), American Medical Group Association (AMGA), American Hospital Association (AHA), Expert Interviews, and MarketsandMarkets Analysis.

Secondary research was used to identify and collect information useful for the extensive, technical, market-oriented, and commercial study of the operating room management market. It was also used to obtain important information about the key players and market classification and segmentation according to industry trends to the bottom-most level, and key developments related to market and technology perspectives. A database of the key industry leaders was also prepared using secondary research.

Primary Research

In the primary research process, various sources from both the supply and demand sides were interviewed to obtain qualitative and quantitative information for this report. The primary sources from the supply side include industry experts such as CEOs, vice presidents, marketing and sales directors, technology & innovation directors, and related key executives from various key companies and organizations operating in the operating room management market. The primary sources from the demand side included industry experts, consultants, healthcare providers, healthcare payers, hospital administration, and government bodies. Primary research was conducted to validate the market segmentation, identify key players in the market, and gather insights on key industry trends and key market dynamics.

Operating Room Management Market Size, and Share

To know about the assumptions considered for the study, download the pdf brochure

Market Size Estimation

For the calculation of the market value, the revenue from providers was arrived at, based on the adoption rate and average expenditure on software and services in the operating room management market. This process involved the following steps:

  • Generating a list of providers (hospitals, ambulatory surgery centers) adopting operating room management solutions in the given year.
  • Understanding the yearly average of expenditure undertaken by the various types of providers for these solutions.
  • Totaling the yearly revenue to arrive at the overall market size.

Data Triangulation

After arriving at the overall market size—using the market size estimation processes as explained above—the market was split into several segments and sub-segments. To complete the overall market engineering process and arrive at the exact statistics of each market segment and subsegment, the data triangulation, and market breakdown procedures were employed, wherever applicable. The data was triangulated by studying various factors and trends from both the demand and supply sides, in the provider, payer, and other industries.

Report Objectives

  • To define, describe, and forecast the global operating room management market by product, service model, deployment model, pricing model, component, and region
  • To provide detailed information regarding the major factors influencing the market growth (such as drivers, restraints, opportunities, and challenges)
  • To analyze the micromarkets with respect to individual growth trends, prospects, and contributions to the overall operating room management market
  • To analyze the opportunities for stakeholders and provide details of the competitive landscape for market leaders
  • To forecast the size of the market segments with respect to four main regions, namely,
  • North America, Europe, the Asia Pacific, and the Rest of the World
  • To profile the key players and analyze their market shares and core competencies
  • To track and analyze competitive developments such as product launches, partnerships, agreements, collaborations, expansions, and acquisitions in the overall operating room management market

Available Customizations

MarketsandMarkets offers the following customizations for this market report:

  • Additional country-level analysis of healthcare cloud computing market
  • Profiling of additional market players (up to 3)
Custom Market Research Services

We will customize the research for you, in case the report listed above does not meet with your exact requirements. Our custom research will comprehensively cover the business information you require to help you arrive at strategic and profitable business decisions.

Request Customization

Instant Answers with GPT - Ask Now!

Ask real questions. Get complete answers !
Report Code
HIT 2862
Published ON
Sep, 2020
Choose License Type
BUY NOW
  • SHARE
X
Request Customization
Speak to Analyst
Speak to Analyst
OR FACE-TO-FACE MEETING
PERSONALIZE THIS RESEARCH
  • Triangulate with your Own Data
  • Get Data as per your Format and Definition
  • Gain a Deeper Dive on a Specific Application, Geography, Customer or Competitor
  • Any level of Personalization
REQUEST A FREE CUSTOMIZATION
LET US HELP YOU!
  • What are the Known and Unknown Adjacencies Impacting the Operating Room Management Market
  • What will your New Revenue Sources be?
  • Who will be your Top Customer; what will make them switch?
  • Defend your Market Share or Win Competitors
  • Get a Scorecard for Target Partners
CUSTOMIZED WORKSHOP REQUEST
+1-888-600-6441
  • Call Us
  • +1-888-600-6441 (Corporate office hours)
  • +1-888-600-6441 (US/Can toll free)
  • +44-800-368-9399 (UK office hours)
CONNECT WITH US
ABOUT TRUST ONLINE
©2024 MarketsandMarkets Research Private Ltd. All rights reserved
DMCA.com Protection Status Website Feedback