OEM Coatings Market by Formulation (Powder Coatings, Water-borne Coatings, Solvent-borne Coatings, and Radiation Curable Coatings), End-use Industry (Transportation, Consumer Products, and Heavy Equipment & Machinery), and Region - Global Forecasts to 2022


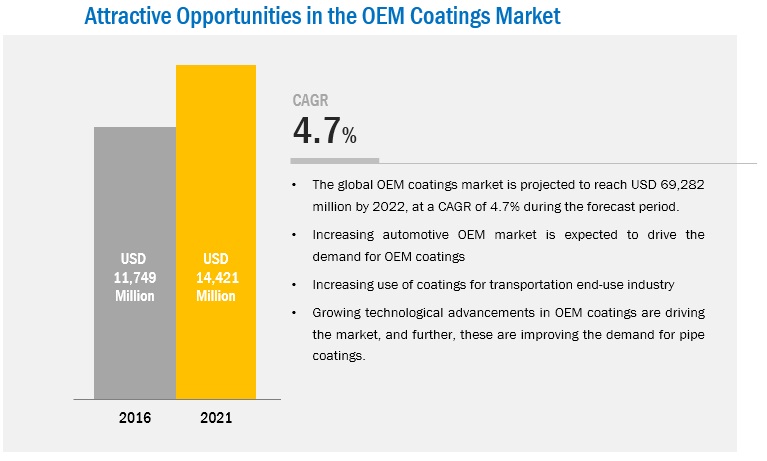
[172 Pages Report] on OEM Coatings Market is projected to reach USD 69.28 Billion by 2022, at a CAGR of 4.7% from 2017 to 2022. In this study, 2016 has been considered as the base year and 2017 to 2022 as the forecast period for estimating the market size for OEM coatings.
Objectives of the Study
- To estimate and forecast the size of the OEM coatings market, in terms of value and volume
- To define and segment the OEM coatings market on the basis of formulation, end-use industry, and region
- To analyze significant region-specific trends of the market in North America, Western Europe, Central & Eastern Europe, Asia-Pacific, South America, and the Middle East & Africa
- To estimate and forecast the OEM coatings market at the country-level in each of the above-mentioned regions
- To identify and analyze the key drivers, restraints, challenges, and opportunities influencing the OEM coatings market
- To strategically identify and profile the key players in the OEM coatings market and analyze their core competencies1 in each formulation and end-use industry
- To analyze the market opportunities and competitive landscape of the stakeholders and market leaders in the OEM coatings market
- To analyze the recent market developments and competitive strategies, such as expansions, new product launches, agreements, and mergers & acquisitions to draw the competitive landscape of the OEM coatings market
This research study involves extensive use of secondary sources, directories, and databases, such as Hoovers, Bloomberg, BusinessWeek, and Factiva to identify and collect information useful for this technical, market-oriented, and commercial study of the OEM coatings market. The primary sources are mainly industry experts from the core and related industries and preferred suppliers, manufacturers, distributors, service providers, and organizations related to different segments of the industry�s supply chain. The bottom-up approach has been used to estimate the size of OEM coatings market on the basis of the formulation, end-use industry, and region in terms of volume and value. The top-down approach has been implemented to validate the market size in terms of volume and value. With the data triangulation procedure and validation of the data through primary interviews, the exact values of the overall parent market size and individual market sizes have been determined and confirmed in this study.
To know about the assumptions considered for the study, download the pdf brochure
Major Players
The OEM coatings market is led by major players, such as PPG Industries, Inc. (U.S.), Akzo Nobel N.V. (Netherlands), The Sherwin-Williams Company (U.S.), The Valspar Corporation (U.S.), and Axalta Coating Systems Ltd. (U.S.), among others. These key players have adopted various organic and inorganic strategies to maintain their shares in the OEM coatings market. These players are also focusing on the development of eco-friendly coatings for OEM parts.
Target Audience:
- Manufacturers of OEM coatings
- Traders, distributors, and suppliers of OEM coatings
- End-use market participants of different segments of the OEM coatings market
- Government and research organizations
- Associations and industrial bodies
- Research and consulting firms
- R&D institutions
- Environment support agencies
- Investment banks and private equity firms
�This study answers several questions for the stakeholders, primarily which market segments they need to focus upon in the next two to five years to prioritize their efforts and investments.�
Scope of the Report:
This research report categorizes the OEM coatings market on the basis of the formulation, end-use industry, and region. It forecasts revenue growth and analyzes the trends in each of the submarkets.
OEM Coatings Market, by Formulation:
- Powder Coatings
- Water-borne Coatings
- Solvent-borne Coatings
- Radiation Curable Coatings
OEM Coatings Market, by End-use Industry:
- Transportation
- Automotive
- Marine
- Other Transportation
- Consumer Products
- Heavy Equipment & Machinery
- Others
OEM Coatings Market, by Region:
- Asia-Pacific
- China
- India
- Japan
- South Korea
- Rest of Asia-Pacific
- North America
- U.S.
- Canada
- Mexico
- Western Europe
- Germany
- France
- U.K.
- Spain
- Italy
- Rest of Western Europe
- Central & Eastern Europe
- Russia
- Turkey
- Rest of Central & Eastern Europe
- South America
- Brazil
- Argentina
- Rest of South America
- Middle East & Africa
- Saudi Arabia
- UAE
- Rest of Middle East & Africa
These segments are further described in detail with their subsegments in the report. The value and volume forecasts for these segments and subsegments have also been provided till 2022.
Available Customizations: The following customization options are available in the report:
- Company Information
Analysis and profiles of additional global as well as regional market players (up to three).
The OEM coatings market is projected to reach USD 69.28 Billion by 2022, at a CAGR of 4.7% from 2017 to 2022. With the growing transportation industry across the globe, the demand for OEM coatings is expected to increase as OEM manufacturers are opting for these coatings to protect their OEM parts from corrosion and improve their durability. Moreover, the demand for OEM coatings is also driven by the technological advancements taking place in the field of OEM coatings.
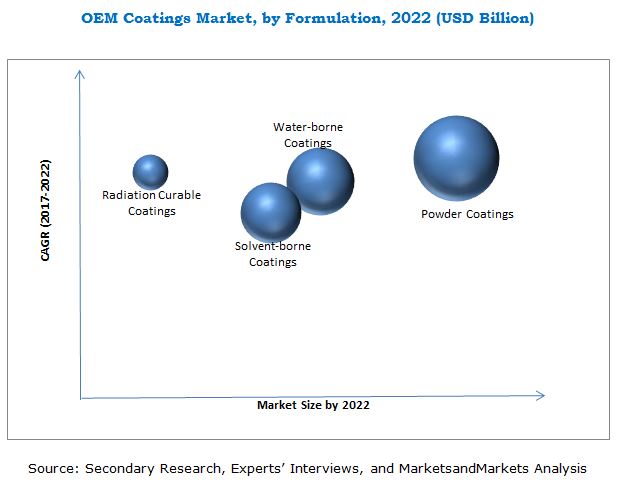
Powder coatings are the most widely used formulation of the OEM coatings. Powder coatings are cost-effective. They are eco-friendly as they have a low content of volatile organic compounds (VOCs) present in them. Due to these properties, powder coatings are preferred in various end-use industries, such as transportation, consumer products, and heavy equipment & machinery, among others.
The transportation end-use industry segment of the OEM coatings market is projected to grow at the highest CAGR from 2017 to 2022. The growth of the transportation end-use industry segment of the market can be attributed to the increasing demand for OEM coatings for automotive applications. Factors, such as improvement in the lifestyle of the masses and increased need for comfortable travel are also contributing to the growth of the automotive industry across the globe, which, in turn, is expected to fuel the growth of the transportation end-use industry segment of the OEM coatings market during the forecast period.
The Asia-Pacific region is the global forerunner in the OEM coatings market in terms of both, value as well as volume, and this trend is expected to continue till 2022. Factors, such as advancements in the lifestyle of masses, increase in their purchasing power, and improvement in the economic conditions of the region are expected to contribute towards the growth of the automotive industry of the region. This, in turn, is expected to drive the growth of the Asia-Pacific OEM coatings market during the forecast period.
Though the OEM coatings market is growing at a fast pace across the globe, there are a few factors that are expected to hamper its growth between 2017 and 2022. These factors include the presence of volatile organic compounds (VOCs) in the coatings, which when emitted into the environment pose a threat to it. Hence, governments across the globe are encouraging the use of powder coatings as these contain little to negligible content of volatile organic compounds (VOCs) present in them.
PPG Industries, Inc. (U.S.), Akzo Nobel N.V. (Netherlands), The Sherwin-Williams Company (U.S.), The Valspar Corporation (U.S.), Axalta Coating Systems Ltd. (U.S.), Jotun (Norway), BASF SE (Germany), Nippon Paints Holdings Co., Ltd. (Japan), 3M Company (U.S.), and Kansai Paints Co., Ltd. (Japan), among others are the leading players in the OEM coatings market. These companies have adopted various organic and inorganic growth strategies, such as expansions, mergers & acquisitions, collaborations/partnerships/agreements, and new product launches to enhance their shares in the OEM coatings market.
To speak to our analyst for a discussion on the above findings, click Speak to Analyst
 Exclusive indicates content/data unique to MarketsandMarkets and not available with any competitors.
Table of Contents
1 Introduction (Page No. - 17)
1.1 Objectives of the Study
1.2 Market Definition
1.3 Market Scope
1.3.1 Markets Covered
1.3.2 Years Considered for the Study
1.3.3 Currency
1.4 Limitations
1.5 Assumption
1.6 Stakeholders
2 Research Methodology (Page No. - 20)
2.1 Research Data
2.1.1 Secondary Data
2.1.1.1 Key Data From Secondary Sources
2.1.2 Primary Data
2.1.2.1 Key Data From Primary Sources
2.1.2.2 Key Industry Insights
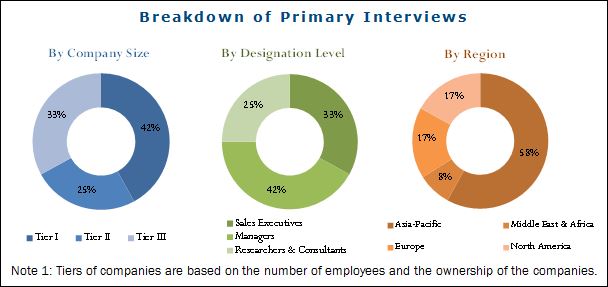
2.1.2.3 Breakdown of Primary Interviews
2.2 Market Size Estimation
2.3 Data Triangulation
2.3.1 Research Assumptions
3 Executive Summary (Page No. - 28)
4 Premium Insights (Page No. - 31)
4.1 Attractive Opportunities in OEM Coatings Market
4.2 OEM Coatings Market, By End-Use Industry (2017�2022)
4.3 OEM Coatings Market in Asia-Pacific, By End-Use Industry and Country, 2016
4.4 OEM Coatings Market: Emerging vs Mature Countries
5 Market Overview (Page No. - 33)
5.1 Introduction
5.2 Market Dynamics
5.2.1 Drivers
5.2.1.1 High Growth in Automotive OEM Market
5.2.1.2 Technological Advancements in OEM Coatings
5.2.2 Restraints
5.2.2.1 High VOC Content in OEM Coatings
5.2.3 Opportunities
5.2.3.1 Development of Faster Curing and Low VOC Emitting Coatings
5.2.4 Challenges
5.2.4.1 Development of Coating-Free Surfaces
5.3 Porter�s Five Forces Analysis
5.3.1 Bargaining Power of Suppliers
5.3.2 Threat of New Entrants
5.3.3 Threat of Substitutes
5.3.4 Bargaining Power of Buyers
5.3.5 Intensity of Competitive Rivalry
5.4 Macroeconomic Indicators
5.4.1 Trends and Forecast of GDP
5.4.2 Trends and Sales of Automotive Industry
6 OEM Coatings Market, By Formulation (Page No. - 43)
6.1 Introduction
6.2 Powder and High Solid Coatings
6.3 Water-Borne Coatings
6.4 Solvent-Borne Coatings
6.5 Radiation Curable Coatings
7 OEM Coatings Market, By End-Use Industry (Page No. - 51)
7.1 Introduction
7.2 Transporation
7.2.1 Automotive
7.2.1.1 Acrylic Coatings
7.2.1.2 Polyurethane Coatings
7.2.1.3 Epoxy Coatings
7.2.1.4 Alkyd Coating
7.2.1.5 Polyester Coatings
7.2.2 Marine
7.2.2.1 Epoxy Coatings
7.2.2.2 Polyurethane Coatings
7.2.2.3 Other Coatings
7.2.3 Other Transportation Industry
7.3 Consumer Products
7.3.1 Epoxy Coatings
7.3.2 Polyester Coatings
7.3.3 Acrylic Coatings
7.3.4 Polyurethane Coatings
7.4 Heavy Equipment and Machinery
7.4.1 Epoxy Coatings
7.4.2 Alkyd Coatings
7.4.3 Acrylic Coatings
7.4.4 Polyurethane Coatings
7.5 Others
8 OEM Coatings Market, By Region (Page No. - 62)
8.1 Introduction
8.2 Asia-Pacific
8.2.1 China
8.2.2 Japan
8.2.3 India
8.2.4 South Korea
8.2.5 Rest of Asia-Pacific
8.3 North America
8.3.1 U.S.
8.3.2 Canada
8.3.3 Mexico
8.4 Western Europe
8.4.1 Germany
8.4.2 France
8.4.3 U.K.
8.4.4 Spain
8.4.5 Italy
8.4.6 Rest of Western Europe
8.5 Central & Eastern Europe
8.5.1 Russia
8.5.2 Turkey
8.5.3 Rest of Central & Eastern Europe
8.6 South America
8.6.1 Brazil
8.6.2 Argentina
8.6.3 Rest of South America
8.7 Middle East & Africa
8.7.1 Saudi Arabia
8.7.2 UAE
8.7.3 Rest of Middle East & Africa
9 Competitive Landscape (Page No. - 120)
9.1 Introduction
9.1.1 Dynamic Diffrentiators
9.1.2 Innovators
9.1.3 Visionary Leaders
9.1.4 Emerging Companies
9.2 Competitive Benchmarking
9.2.1 Products Offered
9.2.2 Business Strategy
9.3 Market Ranking of Key Players
10 Company Profiles (Page No. - 126)
(Business Overview, Product Offerings Scorecard, Products Offered, Business Strategy Scorecard, Recent Developments)*
10.1 PPG Industries, Inc.
10.2 Akzo Nobel N.V.
10.3 Axalta Coatings Systems Ltd.
10.4 The Sherwin-Williams Company
10.5 The Valspar Corporation
10.6 Jotun
10.7 3M Company
10.8 BASF SE
10.9 Nippon Paint Holdings Co., Ltd.
10.10 Kansai Paint Co., Ltd.
10.11 Additional Company Profiles
*Details on Business Overview, Product Offerings Scorecard, Products Offered, Business Strategy Scorecard, Recent Developments might not be captured in case of unlisted companies.
10.11 Additional Company Profiles
10.11.1 Henkel Corporation
10.11.2 Berger Paints India Ltd.
10.11.3 Sika Ag
10.11.4 Helios Group Holding S.A.
10.11.5 Shanghai Coatings Co. Ltd.
10.11.6 National Paints Factories
10.11.7 Hempel A/S
10.11.8 Daw
10.11.9 Korea Chemical Co., Ltd.
10.11.10 Chugoku Marine Paints
10.11.11 Beckers Group
10.11.12 Carboline Company
10.11.13 Duluxgroup
10.11.14 Sk Kaken
10.11.15 Shawcor Ltd.
11 Appendix (Page No. - 165)
11.1 Insights From Industry Experts
11.2 Discussion Guide
11.3 Knowledge Store: Marketsandmarkets Subscription Portal
11.4 Introducing RT: Real Time Market Intelligence
11.5 Available Customizations
11.6 Related Reports
11.7 Author Details
List of Tables (154 Tables)
Table 1 Trends and Forecast of GDP, 2016�2022 (USD Million)
Table 2 Trends and Sales of Automotive, USD Million (2015 and 2016)
Table 3 OEM Coatings Market Size, By Formulation, 2015�2022 (USD Million)
Table 4 OEM Coatings Market Size, By Formulation, 2015�2022 (Kiloton)
Table 5 Radiation Curable OEM Coatings Market Size, 2015�2022
Table 6 Powder & High Solid Coating Market Size, By Region, 2015�2022 (USD Million)
Table 7 Powder & High Solid Coating Market Size, By Region, 2015�2022 (Kiloton)
Table 8 Water-Borne Coatings Market Size, By Region, 2015�2022 (USD Million)
Table 9 Water-Borne Coatings Market Size, By Region, 2015�2022 (Kiloton)
Table 10 Solvent-Borne Coatings Market Size, By Region, 2015�2022 (USD Million)
Table 11 Solvent-Borne Coatings Market Size, By Region, 2015�2022 (Kiloton)
Table 12 Radiation Curable Coatings Market Size, By Region, 2015�2022 (USD Million)
Table 13 Radiation Curable Coatings Market Size, By Region, 2015�2022 (Kiloton)
Table 14 OEM Coatings Market Size, By End-Use Industry, 2015�2022(USD Million)
Table 15 OEM Coatings Market Size in Automotive Industry, By Region, 2015�2022 (USD Million)
Table 16 OEM Coatings Market Size Marine Industry, By Region, 2015�2022 (USD Million)
Table 17 OEM Coatings Market Size in Other Transportation Industry, By Region, 2015�2022 (USD Million)
Table 18 OEM Coatings Market Size in Consumer Products, By Region, 2015�2022 (USD Million)
Table 19 OEM Coatings Market Size in Heavy Equipment & Machinery Industry, By Region, 2015�2022 (USD Million)
Table 20 OEM Coatings Market Size in Other End-Use Industries, By Region, 2014�2021 (USD Million)
Table 21 OEM Coatings Market Size, By Region, 2015�2022 (USD Million)
Table 22 OEM Coatings Market Size, By Region, 2015�2022 (Kiloton)
Table 23 OEM Coatings Market Size, By Formulation, 2015�2022 (USD Million)
Table 24 OEM Coatings Market Size, By Formulation, 2015�2022 (Kiloton)
Table 25 Radiation Curable OEM Coatings Market Size, 2015�2022
Table 26 OEM Coatings Market Size, By End-Use Industry, 2015�2022 (USD Million)
Table 27 Asia-Pacific: OEM Coatings Market Size, By Country, 2015�2022 (USD Million)
Table 28 Asia-Pacific: OEM Coatings Market Size, By Country, 2015�2022 (Kiloton)
Table 29 Asia-Pacific: OEM Coatings Market Size, By Formulation, 2015�2022 (USD Million)
Table 30 Asia-Pacific: OEM Coatings Market Size, By Formulation, 2015�2022 (Kiloton)
Table 31 Asia-Pacific: Radiation Curable OEM Coatings Market Size, 2015�2022
Table 32 Asia-Pacific: OEM Coatings Market Size, By End-Use Industry, 2015�2022 (USD Million)
Table 33 China: OEM Coatings Market Size, By Formulation, 2015�2022 (USD Million)
Table 34 China: OEM Coatings Market Size, By Formulation, 2015�2022 (Kiloton)
Table 35 China: Radiation Curable OEM Coatings Market Size, 2015�2022
Table 36 China: OEM Coatings Market Size, By End-Use Industry, 2015�2022 (USD Million)
Table 37 Japan: OEM Coatings Market Size, By Formulation, 2015�2022 (USD Million)
Table 38 Japan: OEM Coatings Market Size, By Formulation, 2015�2022 (Kiloton)
Table 39 Japan: Radiation Curable OEM Coatings Market Size, 2015�2022
Table 40 Japan: OEM Coatings Market Size, By End-Use Industry, 2015�2022 (USD Million)
Table 41 India: OEM Coatings Market Size, By Formulation, 2015�2022 (USD Million)
Table 42 India: OEM Coatings Market Size, By Formulation, 2015�2022 (Kiloton)
Table 43 India: Radiation Curable OEM Coatings Market Size, 2015�2022
Table 44 India: OEM Coatings Market Size, By End-Use Industry, 2015�2022 (USD Million)
Table 45 South Korea: OEM Coatings Market Size, By Formulation, 2015�2022 (USD Million)
Table 46 South Korea: OEM Coatings Market Size, By Formulation, 2015�2022 (Kiloton)
Table 47 South Korea: Radiation Curable OEM Coatings Market Size, 2015�2022
Table 48 South Korea: OEM Coatings Market Size, By End-Use Industry, 2015�2022 (USD Million)
Table 49 Rest of Asia-Pacific: OEM Coatings Market Size, By Formulation, 2015�2022 (USD Million)
Table 50 Rest of Asia-Pacific: OEM Coatings Market Size, Formulation, 2015�2022 (Kiloton)
Table 51 Rest of Asia-Pacific: Radiation Curable OEM Coatings Market Size, 2015�2022
Table 52 Rest of Asia-Pacific: OEM Coatings Market Size, By End-Use Industry, 2015�2022 (USD Million)
Table 53 North America: OEM Coatings Market Size, By Country, 2015�2022 (USD Million)
Table 54 North America: OEM Coatings Market Size, By Country, 2015�2022 (Kiloton)
Table 55 North America: OEM Coatings Market Size, By Formulation, 2015�2022 (USD Million)
Table 56 North America: OEM Coatings Market Size, By Formulation, 2015�2022 (Kiloton)
Table 57 North America: Radiation Curable OEM Coatings Market Size, 2015�2022
Table 58 North America: OEM Coatings Market Size, By End-Use Industry, 2015�2022 (USD Million)
Table 59 U.S.: OEM Coatings Market Size, By Formulation, 2015�2022 (USD Million)
Table 60 U.S.: OEM Coatings Market Size, By Formulation, 2015�2022 (Kiloton)
Table 61 U.S.: Radiation Curable OEM Coatings Market Size, 2015�2022
Table 62 U.S.: OEM Coatings Market Size, By End-Use Industry, 2015�2022 (USD Million)
Table 63 Canada: OEM Coatings Market Size, By Formulation, 2015�2022 (USD Million)
Table 64 Canada: OEM Coatings Market Size, By Formulation, 2015�2022 (Kiloton)
Table 65 Canada: Radiation Curable OEM Coatings Market Size, 2015�2022
Table 66 Canada: OEM Coatings Market Size, By End-Use Industry, 2015�2022 (USD Million)
Table 67 Mexico: OEM Coatings Market Size, By Formulation, 2015�2022 (USD Million)
Table 68 Mexico: OEM Coatings Market Size, By Formulation, 2015�2022 (Kiloton)
Table 69 Mexico: Radiation Curable OEM Coatings Market Size, 2015�2022
Table 70 Mexico: OEM Coatings Market Size, By End-Use Industry, 2015�2022 (USD Million)
Table 71 Western Europe: OEM Coatings Market Size, By Country, 2015�2022 (USD Million)
Table 72 Western Europe: OEM Coatings Market Size, By Country, 2015�2022 (Kiloton)
Table 73 Western Europe: OEM Coatings Market Size, By Formulation, 2015�2022 (USD Million)
Table 74 Western Europe: OEM Coatings Market Size, By Formulation, 2015�2022 (Kiloton)
Table 75 Western Europe: Radiation Curable OEM Coatings Market Size, 2015�2022
Table 76 Western Europe: OEM Coatings Market Size, By End-Use Industry, 2015�2022 (USD Million)
Table 77 Germany: OEM Coatings Market Size, By Formulation, 2015�2022 (USD Million)
Table 78 Germany: OEM Coatings Market Size, By Formulation, 2015�2022 (Kiloton)
Table 79 Germany: Radiation Curable OEM Coatings Market Size, 2015�2022
Table 80 Germany: OEM Coatings Market Size, By End-Use Industry, 2015�2022 (USD Million)
Table 81 France: OEM Coatings Market Size, By Formulation, 2015�2022 (USD Million)
Table 82 France: OEM Coatings Market Size, By Formulation, 2015�2022 (Kiloton)
Table 83 France: Radiation Curable OEM Coatings Market Size, 2015�2022
Table 84 France: OEM Coatings Market Size, By End-Use Industry, 2015�2022 (USD Million)
Table 85 U.K.: OEM Coatings Market Size, By Formulation, 2015�2022 (USD Million)
Table 86 U.K.: OEM Coatings Market Size, By Formulation, 2015�2022 (Kiloton)
Table 87 U.K.: Radiation Curable OEM Coatings Market Size, 2015�2022
Table 88 U.K.: OEM Coatings Market Size, By End-Use Industry, 2015�2022 (USD Million)
Table 89 Spain: OEM Coatings Market Size, By Formulation, 2015�2022 (USD Million)
Table 90 Spain: OEM Coatings Market Size, By Formulation, 2015�2022 (Kiloton)
Table 91 Spain: Radiation Curable OEM Coatings Market Size, 2015�2022
Table 92 Spain: OEM Coatings Market Size, By End-Use Industry, 2015�2022 (USD Million)
Table 93 Italy: OEM Coatings Market Size, By Formulation, 2015�2022 (USD Million)
Table 94 Italy: OEM Coatings Market Size, By Formulation, 2015�2022 (Kiloton)
Table 95 Italy: Radiation Curable OEM Coatings Market Size, 2015�2022
Table 96 Italy: OEM Coatings Market Size, By End-Use Industry, 2015�2022 (USD Million)
Table 97 Rest of Western Europe: OEM Coatings Market Size, By Formulation, 2015�2022 (USD Million)
Table 98 Rest of Western Europe: OEM Coatings Market Size, By Formulation, 2015�2022 (Kiloton)
Table 99 Rest of Western Europe: Radiation Curable OEM Coatings Market Size, 2015�2022
Table 100 Rest of Western Europe: OEM Coatings Market Size, By End-Use Industry, 2015�2022 (USD Million)
Table 101 Central & Eastern Europe: OEM Coatings Market Size, By Country, 2015�2022 (USD Million)
Table 102 Central & Eastern Europe: OEM Coatings Market Size, By Country, 2015�2022 (Kiloton)
Table 103 Central & Eastern Europe: OEM Coatings Market Size, By Formulation, 2015�2022(USD Million)
Table 104 Central & Eastern Europe: OEM Coatings Market Size, By Formulation, 2015�2022 (Kiloton)
Table 105 Central & Eastern Europe: Radiation Curable OEM Coatings Market Size, 2015�2022
Table 106 Central & Eastern Europe: OEM Coatings Market Size, By End-Use Industry, 2015�2022 (USD Million)
Table 107 Russia: OEM Coatings Market Size, By Formulation, 2015�2022 (USD Million)
Table 108 Russia: OEM Coatings Market Size, By Formulation, 2015�2022 (Kiloton)
Table 109 Russia: Radiation Curable OEM Coatings Market Size, 2015�2022
Table 110 Russia: OEM Coatings Market Size, By End-Use Industry, 2015�2022 (USD Million)
Table 111 Turkey: OEM Coatings Market Size, By Formulation, 2015�2022(USD Million)
Table 112 Turkey: OEM Coatings Market Size, By Formulation, 2015�2022(Kiloton)
Table 113 Turkey: Radiation Curable OEM Coatings Market Size, 2015�2022
Table 114 Turkey: OEM Coatings Market Size, By End-Use Industry, 2015�2022(USD Million)
Table 115 Rest of Central & Eastern Europe: OEM Coatings Market Size, By Formulation, 2015�2022 (USD Million)
Table 116 Rest of Central & Eastern Europe: OEM Coatings Market Size, By Formulation, 2015�2022(Kiloton)
Table 117 Rest of Central & Eastern Europe: Radiation Curable OEM Coatings Market Size, 2015�2022
Table 118 Rest of Central & Eastern Europe: OEM Coatings Market Size, By End-Use Industry, 2015�2022 (USD Million)
Table 119 South America: OEM Coatings Market Size, By Country, 2015�2022 (USD Million)
Table 120 South America: OEM Coatings Market Size, By Country, 2015�2022 (Kiloton)
Table 121 South America: OEM Coatings Market Size, By Formulation, 2015�2022 (USD Million)
Table 122 South America: OEM Coatingsmarket Size, By Formulation, 2015�2022 (Kiloton)
Table 123 South America: Radiation Curable OEM Coatings Market Size, 2015�2022
Table 124 South America: OEM Coatings Market Size, By End-Use Industry, 2015�2022 (USD Million)
Table 125 Brazil: OEM Coatings Market Size, By Formulation, 2015�2022 (USD Million)
Table 126 Brazil: OEM Coatingsmarket Size,By Formulation, 2015�2022 (Kiloton)
Table 127 Brazil: Radiation Curable OEM Coatings Market Size, 2015�2022
Table 128 Brazil: OEM Coatings Market Size, By End-Use Industry, 2015�2022 (USD Million)
Table 129 Argentina: OEM Coatings Market Size, By Formulation, 2015�2022 (USD Million)
Table 130 Argentina: OEM Coatings Market Size, By Formulation, 2015�2022 (Kiloton)
Table 131 Argentina: Radiation Curable OEM Coatings Market Size, 2015�2022
Table 132 Argentina: OEM Coatings Market Size, By End-Use Industry, 2015�2022 (USD Million)
Table 133 Rest of South America: OEM Coatings Market Size, By Formulation, 2015�2022 (USD Million)
Table 134 Rest of South America: OEM Coatings Market Size, By Formulation, 2015�2022 (Kiloton)
Table 135 Rest of South America: Radiation Curable OEM Coatings Market Size, 2015�2022
Table 136 Rest of South America: OEM Coatings Market Size, By End-Use Industry, 2015�2022 (USD Million)
Table 137 Middle East & Africa: OEM Coatings Market Size, By Country, 2015�2022 (USD Million)
Table 138 Middle East & Africa: OEM Coatings Market Size, By Country, 2015�2022 (Kiloton)
Table 139 Middle East & Africa: OEM Coatings Market Size, By Formulation, 2015�2022 (USD Million)
Table 140 Middle East & Africa: OEM Coatings Market Size, By Formulation, 2015�2022 (Kiloton)
Table 141 Middle East & Africa: Radiation Curable OEM Coatings Market Size, 2017�2022
Table 142 Middle East & Africa :OEM Coatings Market Size, By End-Use Industry, 2015�2022 (USD Million)
Table 143 Saudi Arabia: OEM Coatings Market Size, By Formulation, 2015�2022 (USD Million)
Table 144 Saudi Arabia: OEM Coatings Market Size, By Formulation, 2015�2022 (Kiloton)
Table 145 Saudi Arabia: Radiation Curable OEM Coatings Market Size, 2015�2022
Table 146 Saudi Arabia: OEM Coatings Market Size, By End-Use Industry, 2015�2022 (USD Million)
Table 147 UAE: OEM Coatings Market Size, By Formulation, 2015�2022 (USD Million)
Table 148 UAE: OEM Coatings Market Size, By Formulation, 2015�2022 (Kiloton)
Table 149 UAE: Radiation Curable OEM Coatings Market Size, 2015�2022
Table 150 UAE: OEM Coatings Market Size, By End-Use Industry, 2015�2022 (USD Million)
Table 151 Rest of Middle East & Africa: OEM Coatings Market Size, By Formulation, 2015�2022 (USD Million)
Table 152 Rest of Middle East & Africa: OEM Coatings Market Size, By Formulation, 2015�2022 (Kiloton)
Table 153 Rest of Middle East & Africa: Radiation Curable OEM Coatings Market Size, 2015�2022
Table 154 Rest of Middle East & Africa: OEM Coatings Market Size, By End-Use Industry, 2015�2022 (USD Million)
List of Figures (35 Figures)
Figure 1 OEM Coatings Market Segmentation
Figure 2 OEM Coatings Market: Research Methodology
Figure 3 Market Size Estimation: Top-Down Approach
Figure 4 Market Size Estimation: Bottom-Up Approach
Figure 5 OEM Coatings Market: Data Triangulation
Figure 6 Powder & High Solid Coatings to Be the Largest Formulation Segment of OEM Coatings Market
Figure 7 Transportation Industry to Dominate OEM Coatings Market During Forecast Period
Figure 8 Asia-Pacific Was Largest OEM Coatings Market in 2016
Figure 9 OEM Coatings Market Size, 2017�2022 (USD Billion)
Figure 10 Transportation to Be the Fastest-Growing Market During Forecast Period
Figure 11 Transportation Industry Was the Largest Consumer of OEM Coatings in Asia-Pacific
Figure 12 China to Emerge as the Most Lucrative Market Between 2017 and 2022
Figure 13 Drivers, Restraints, Opportunities, and Challenges in OEM Coatings Market
Figure 14 OEM Coatings Market ; Porter�s Five Forces Analysis
Figure 15 Trends and Forecast of GDP, 2016
Figure 16 Powder and High Solid Coatings to Drive the OEM Coatings Market During the Forecast Period
Figure 17 Transportation Industry to Dominate the OEM Coatings Market, 2017�2022
Figure 18 Global Snapshot: Asia-Pacific to Register the Highest Growth, 2017�2022
Figure 19 Asia-Pacific Snapshot: China to Register the Highest Growth, 2017�2022
Figure 20 North America Regional Snapshot: the U.S. to Lead the OEM Coatings Market, 2017�2022
Figure 21 Regional Snapshot: Germany to Lead the OEM Coatings Market in Western Europe, 2017�2022
Figure 22 South America Regional Snapshot: Brazil to Lead the OEM Coatings Market in the Region, 2016�2022
Figure 23 Middle East & Africa Regional Snapshot, 2017�2022
Figure 24 Competitive Leadership Mapping, 2016
Figure 25 OEM Coatings Market Ranking, 2016
Figure 26 PPG Industries, Inc.: Company Snapshot
Figure 27 Akzo Nobel N.V.: Company Snapshot
Figure 28 Axalta Coatings Systems Ltd.: Company Snapshot
Figure 29 The Sherwin-Williams Company: Company Snapshot
Figure 30 The Valspar Corporation: Company Snapshot
Figure 31 Jotun: Company Snapshot
Figure 32 3M Company: Company Snapshot
Figure 33 BASF SE: Company Snapshot
Figure 34 Nippon Paint Holdings Co., Ltd. : Company Snapshot
Figure 35 Kansai Paint Co., Ltd.: Company Snapshot


Growth opportunities and latent adjacency in OEM Coatings Market