Nuclear Decommissioning Services Market by Reactor Type (PWR, BWR, & GCR), Strategy (Immediate Dismantling, Deferred Dismantling, and Entombment), Capacity (Up to 800 MW, 801 MW-1,000 MW, and Above 1,000 MW), and Region - Global Forecast to 2021


[134 Pages report] The size of the global nuclear decommissioning services market is estimated to be USD 4.84 Billion in 2016, and is projected to grow at a CAGR of 12.1% from 2016 to 2021, to reach USD 8.55 Billion by 2021. Nuclear accidents, such as the Fukushima Daichii nuclear power plant accident in 2011, and rising political pressure for pre-closure of nuclear power plants, especially in the European countries, are expected to drive the market.
The years considered for the study are as follows:
- Base Year � 2015
- Estimated Year � 2016
- Projected Year � 2021
- Forecast Period � 2016 to 2021
2015 has been considered as the base year for company profiles in the report. Wherever information was unavailable for the base year, the prior year has been considered.
Objectives of the study
- To define, describe, analyze, and forecast the global nuclear decommissioning services market based on reactor type, capacity, strategy, and region
- To provide detailed information on major factors influencing the growth of the market (drivers, restraints, opportunities, and industry-specific challenges)
- To strategically analyze the market with respect to individual growth trends and future prospects
- To identify the major stakeholders in the market and draw a competitive landscape for market leaders
- To project the market size of the market and its segments in key regions, namely, North America, Asia-Pacific, and Europe
- To analyze market opportunities for stakeholders by identifying high-growth segments of the market
- To track and analyze recent developments such as expansions, new product launches, mergers & acquisitions, and contracts & agreements in the global market
Research Methodology
This research study involved the use of extensive secondary sources, directories, and databases such as Hoovers, Bloomberg Businessweek, Factiva, and OneSource to identify and collect information useful for a technical, market-oriented, and commercial study of the global nuclear decommissioning services market. Primary sources are mainly industry experts from core and related industries, preferred suppliers, manufacturers, distributors, service providers, technology developers, standard and certification organizations of companies, and organizations related to all the segments of this industry�s value chain. The points given below explain the research methodology.
- Analysis of key operational and upcoming nuclear decommissioning projects across the globe, along with the plant capacity
- Analysis of the age of nuclear power plants in every country for the past 30 years
- Analysis of various types of nuclear reactors operating in nuclear power plants in different countries
- Major regions have been identified along with countries contributing to the maximum share
- Secondary has been conducted to find out investments in R&D and strategies adopted for decommissioning of nuclear power plants across countries
- Revenue of the top companies (regional/global) and industry trends along with top-down, bottom-up, and MnM KNOW have been used to estimate the market size
- The overall market size has been finalized by triangulating the supply-side data, which include product development and supply chain. worldwide
After arriving at the overall market size, the total market has been split into several segments and subsegments. The figure below provides a breakdown of primaries conducted during the research study, based on company type, designation, and region.
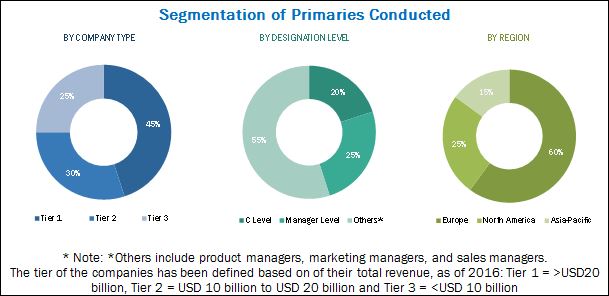
To know about the assumptions considered for the study, download the pdf brochure
Market Ecosystem:
The ecosystem of the global nuclear decommissioning services market starts with decommissioning service providers that include prominent global players as well as small and medium enterprises. Key contracting agencies include Areva Group (France), Babcock International Group PLC. (U.K.), Studsvik (Sweden), AECOM (U.S.), and Westinghouse Electric (U.S.). Global companies, given their wide geographical presence and extensive network, provide services themselves and through a larger network of third-party agencies. The end-users of decommissioning services include nuclear power plant operators and government bodies. These end-users offer contracts to service providers for decommissioning, such as Areva Group (France), Babcock International Group PLC. (U.K.), Studsvik (Sweden), AECOM (U.S.), and Westinghouse Electric (U.S.).

Target Audience:
- Nuclear decommissioning contractors
- Nuclear decommissioning equipment manufacturers
- Government and research organizations
- Consulting companies in the energy sector
- Nuclear decommissioning associations
- Environmental associations
- Investment banks
Scope of the Report:
- By Reactor Type
- Pressurized Water Reactor
- Boiling Water Reactor
- Gas-Cooled Reactor
- Other Reactors (which include pressurized heavy water reactor, fast breeder reactor, and light water graphite reactor)
- By Strategy
- Immediate Dismantling
- Deferred Dismantling
- Entombment
- By Capacity
- Up to 800 MW
- 801 MW-1,000 MW
- Above 1,000 MW
- By Region
- Europe
- North America
- Asia-Pacific
Available Customizations:
With the given market data, MarketsandMarkets offers customizations as per the company�s specific needs. The following customization options are available for this report:
- Detailed analysis and profiling of additional market players (Up to 5).
- Further breakdown of regional markets
- Detailed country analysis
Regional Analysis
Further breakdown of region/country-specific analysis
Company Information
Detailed analysis and profiling of additional market players (Up to 5)
The global nuclear decommissioning services market is projected to reach USD 8.55 Billion by 2021, at a CAGR of 12.1% from 2016 to 2021. This growth can be attributed to nuclear accidents and rising political pressure for pre-closure of nuclear power plants.
The report segments the nuclear decommissioning services market based on reactor type into water cooled and gas-cooled reactors. Water cooled reactor has been further segmented into Pressurized Water Reactor (PWR), Boiling Water Reactor (BWR), Pressurized Heavy Water Reactor (PHWR), and other reactors. The BWR segment held the largest market size in 2015, as it is used in majority of the nuclear power plants.
The nuclear decommissioning services market has also been categorized based on capacity into up to 800 MW, 801 MW�1,000 MW, and above 1,000 MW. The nuclear power reactors up to 800 MW are expected to occupy the largest market size during the forecast period, due to pre-closure of nuclear power plants, whose capacities were below 800 MW, in the European region.
The nuclear decommissioning services market has also been segmented based on strategy into immediate dismantling, deferred dismantling, and entombment. The immediate dismantling segment is expected to occupy the largest market size during the forecast period, due to early phase-out of nuclear power plants in the European region, especially in Germany and Italy.
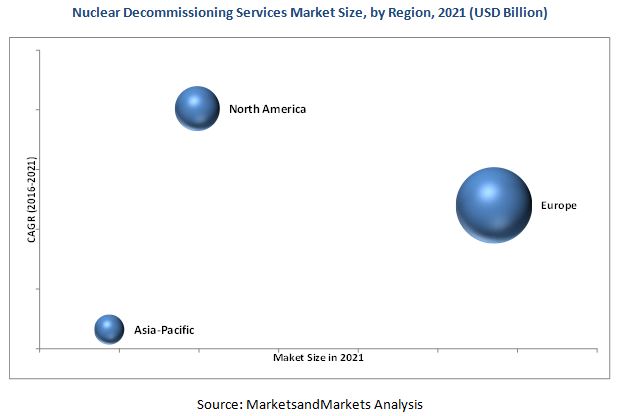
Europe held the largest market share, followed by North America and Asia-Pacific. In 2015, Germany dominated the European nuclear decommissioning services market. This can be attributed to government support, followed by public concern for pre-closure of nuclear power plants. Meanwhile, the market is estimated to grow the fastest in Asia-Pacific, owing to more number of nuclear power plants in Japan and South Korea. The figure given below indicates the market size of various regions by 2021, with their respective CAGRs.
The decommissioning cost on an average ranges in between USD 600 Million to USD 750 Million. However, the actual cost incurred can be more than the average estimated cost since many factors are involved in decommissioning a nuclear power plant. These factors are restraining the growth of the market.
Some of the leading players in the nuclear decommissioning services market include Areva Group (France), Babcock International Group PLC. (U.K.), Studsvik AB (Sweden), AECOM (U.S.), and Westinghouse Electric (U.S.), among others. Contracts & agreements was the most commonly adopted strategy by the top players in the market, followed by expansions and other developments.
To speak to our analyst for a discussion on the above findings, click Speak to Analyst
 Exclusive indicates content/data unique to MarketsandMarkets and not available with any competitors.
Table of Contents
1 Introduction (Page No. - 13)
1.1 Objectives of the Study
1.2 Market Definition
1.3 Market Scope
1.3.1 Markets Covered
1.3.2 Years Considered for the Study
1.4 Currency
1.5 Limitations
1.6 Stakeholders
2 Research Methodology (Page No. - 16)
2.1 Research Data
2.1.1 Secondary Data
2.1.1.1 Key Data From Secondary Sources
2.1.2 Primary Data
2.1.2.1 Key Data From Primary Sources
2.1.2.2 Key Industry Insights
2.1.2.3 Breakdown of Primaries
2.2 Market Size Estimation
2.2.1 Bottom-Up Approach
2.2.2 Top-Down Approach
2.3 Data Triangulation
2.4 Research Assumptions & Limitations
2.4.1 Limitations
3 Executive Summary (Page No. - 25)
3.1 Introduction
3.1.1 Historical Backdrop
3.2 Current Scenario
3.3 Future Outlook
3.4 Conclusion
4 Premium Insights (Page No. - 29)
4.1 Nuclear Decommissioning Services Market Outlook, 2016�2021
4.2 Europe Held the Largest Share in the Market in 2015
4.3 North America: Fastest Growing Market During the Forecast Period
4.4 Market, By Capacity
5 Market Overview (Page No. - 34)
5.1 Introduction
5.2 Market Segmentation
5.2.1 By Reactor Type
5.2.2 By Capacity
5.2.3 By Decommissioning Strategy
5.2.4 By Region
5.3 Market Dynamics
5.3.1 Drivers
5.3.1.1 Accidents and Rising Political Pressure for Pre-Closure
5.3.2 Restraints
5.3.2.1 High Cost of Decommissioning
5.3.3 Nuclear Decommissioning Services Market Opportunities
5.3.3.1 Aging Nuclear Power Plants
5.3.4 Nuclear Decommissioning Services Market Challenges
5.3.4.1 Selection of Decommissioning Technology
5.3.4.2 Nuclear Waste Disposal
6 Nuclear Decommissioning Services Marketindustry Trends (Page No. - 41)
6.1 Introduction
6.2 Supply Chain Analysis
6.3 Porter�s Five Forces Analysis
6.3.1 Threat of New Entrants
6.3.2 Threat of Substitutes
6.3.3 Bargaining Power of Suppliers
6.3.4 Bargaining Power of Buyers
6.3.5 Intensity of Competitive Rivalry
7 Nuclear Decommissioning Services Market, By Reactor Type (Page No. - 46)
7.1 Introduction
7.1.1 Pressurized Water Reactor
7.1.2 Boiling Water Reactor
7.1.3 Other Reactors
7.2 Gas-Cooled Reactor
8 Nuclear Decommissioning Services Market, By Decommissioning Strategy (Page No. - 50)
8.1 Introduction
8.2 Immediate Dismantling
8.3 Deferred Dismantling
8.4 Entombment
9 Nuclear Decommissioning Services Market, By Capacity (Page No. - 53)
9.1 Introduction
9.2 Up to 800 MW
9.3 801 MW�1,000 MW
9.4 Above 1,000 MW
10 Nuclear Decommissioning Services Market, By Region (Page No. - 57)
10.1 Introduction
10.2 an Overview of the Market in North America
10.2.1 U.S.
10.2.2 Canada
10.3 an Overview of the Market in Europe
10.3.1 Germany
10.3.2 France
10.3.3 U.K.
10.3.4 Lithuania
10.3.5 Italy
10.3.6 Russia
10.3.7 Rest of Europe
10.4 Asia-Pacific
10.4.1 Japan
10.4.2 Rest of Asia-Pacific
11 Competitive Landscape (Page No. - 85)
11.1 Overview
11.2 Competitive Situation & Trends
11.3 Contracts & Agreements
11.4 New Product/Technology Developments
11.5 Mergers & Acquisitions
11.6 Expansions
11.7 Joint Ventures / Collaborations
12 Company Profile (Page No. - 93)
(Company at A Glance, Recent Financials, Products & Services, Strategies & Insights, & Recent Developments)*
12.1 Introduction
12.2 Aecom
12.3 Areva Group
12.4 Babcock International Group PLC.
12.5 Studsvik AB
12.6 Westinghouse Electric Company
12.7 Ansaldo Nes (Nuclear Engineering Services Limited)
12.8 Enercon Services, Inc.
12.9 Energysolutions
12.10 GD Energy Services-Nuclear
12.11 KDC Contractors Limited
12.12 Nuvia Group
12.13 Onet Technologies
12.14 Sogin S.P.A (Societ� Gestione Impianti Nucleari)
*Details on Company at A Glance, Recent Financials, Products & Services, Strategies & Insights, & Recent Developments Might Not Be Captured in Case of Unlisted Companies.
13 Appendix (Page No. - 126)
13.1 Insights of Industry Experts
13.2 Discussion Guide
13.3 Knowledge Store: Marketsandmarkets� Subscription Portal
13.4 Introducing RT: Real-Time Market Intelligence
13.5 Available Customizations
13.6 Related Reports
List of Tables (65 Tables)
Table 1 Nuclear Decommissioning Services Market Size, By Reactor Type, 2014�2021 (USD Million)
Table 2 Pressurized Water Reactor: By Market Size, By Region, 2014�2021 (USD Million)
Table 3 Boiling Water Reactor: By Market Size, By Region, 2014�2021 (USD Million)
Table 4 Other Reactors: By Market Size, By Region, 2014�2021 (USD Million)
Table 5 Gas-Cooled Reactor: By Market Size, By Region, 2014�2021 (USD Million)
Table 6 Market Size, By Decommissioning Strategy, 2014�2021 (USD Million)
Table 7 Immediate Dismantling: By Market Size, By Region, 2014�2021 (USD Million)
Table 8 Deferred Dismantling: By Market Size, By Region, 2014�2021 (USD Million)
Table 9 Entombment: By Market Size, By Region, 2014�2021 (USD Million)
Table 10 Market Size, By Capacity, 2014�2021 (USD Million)
Table 11 Up to 800 MW: By Market Size, By Region, 2014�2021 (USD Million)
Table 12 801 MW�1,000 MW: By Market Size, By Region, 2014�2021 (USD Million)
Table 13 Above 1,000 MW: By Market Size, By Region, 2014�2021 (USD Million)
Table 14 Market Size, By Region, 2014�2021 (USD Million)
Table 15 North America: Market Size, By Country, 2014�2021 (USD Million)
Table 16 North America: By Market Size, By Decommissioning Strategy, 2014�2021 (USD Million)
Table 17 North America: By Market Size, By Reactor Type, 2014�2021 (USD Million)
Table 18 North America: By Market Size, By Capacity, 2014�2021 (USD Million)
Table 19 U.S.: Market Size, By Decommissioning Strategy, 2014�2021 (USD Million)
Table 20 U.S.: By Market Size, By Reactor Type, 2014�2021 (USD Million)
Table 21 U.S.: By Market Size, By Capacity, 2014�2021 (USD Million)
Table 22 Canada: Market Size, By Decommissioning Strategy, 2014�2021 (USD Million)
Table 23 Canada: By Market Size, By Reactor Type, 2014�2021 (USD Million)
Table 24 Canada: By Market Size, By Capacity, 2014�2021 (USD Million)
Table 25 Europe: Nuclear Decommissioning Services Market Size, By Country, 2014�2021 (USD Million)
Table 26 Europe: By Market Size, By Decommissioning Strategy, 2014�2021 (USD Million)
Table 27 Europe: By Market Size, By Reactor Type, 2014�2021 (USD Million)
Table 28 Europe: By Market Size, By Capacity, 2014�2021 (USD Million)
Table 29 Germany: Nuclear Decommissioning Services Market Size, By Decommissioning Strategy, 2014�2021 (USD Million)
Table 30 Germany: By Market Size, By Reactor Type, 2014�2021 (USD Million)
Table 31 Germany: By Market Size, By Capacity, 2014�2021 (USD Million)
Table 32 France: Nuclear Decommissioning Services Market Size, By Decommissioning Strategy, 2014�2021 (USD Million)
Table 33 France: By Market Size, By Reactor Type, 2014�2021 (USD Million)
Table 34 France: By Market Size, By Capacity, 2014�2021 (USD Million)
Table 35 U.K.: Nuclear Decommissioning Services Market Size, By Decommissioning Strategy, 2014�2021 (USD Million)
Table 36 U.K.: By Market Size, By Reactor Type, 2014�2021 (USD Million)
Table 37 U.K.: By Market Size, By Capacity, 2014�2021 (USD Million)
Table 38 Lithuania: Nuclear Decommissioning Services Market Size, By Decommissioning Strategy, 2014�2021 (USD Million)
Table 39 Lithuania: By Market Size, By Reactor Type, 2014�2021 (USD Million)
Table 40 Lithuania: By Market Size, By Capacity, 2014�2021 (USD Million)
Table 41 Italy: Nuclear Decommissioning Services Market Size, By Decommissioning Strategy, 2014�2021 (USD Million)
Table 42 Italy: By Market Size, By Reactor Type, 2014�2021 (USD Million)
Table 43 Italy: By Market Size, By Capacity, 2014�2021 (USD Million)
Table 44 Russia: Nuclear Decommissioning Services Market Size, By Decommissioning Strategy, 2014�2021 (USD Million)
Table 45 Russia: By Market Size, By Reactor Type, 2014�2021 (USD Million)
Table 46 Russia: By Market Size, By Capacity, 2014�2021 (USD Million)
Table 47 Rest of Europe: Nuclear Decommissioning Services Market Size, By Decommissioning Strategy, 2014�2021 (USD Million)
Table 48 Rest of Europe: By Market Size, By Reactor Type, 2014�2021 (USD Million)
Table 49 Rest of Europe: By Market Size, By Capacity, 2014�2021 (USD Million)
Table 50 Asia-Pacific: Nuclear Decommissioning Services Market Size, By Country, 2014�2021 (USD Million)
Table 51 Asia-Pacific: By Market Size, By Decommissioning Strategy, 2014�2021 (USD Million)
Table 52 Asia-Pacific: By Market Size, By Reactor Type, 2014�2021 (USD Million)
Table 53 Asia-Pacific: By Market Size, By Capacity, 2014�2021 (USD Million)
Table 54 Japan: Nuclear Decommissioning Services Market Size, By Decommissioning Strategy, 2014�2021 (USD Million)
Table 55 Japan: By Market Size, By Reactor Type, 2014�2021 (USD Million)
Table 56 Japan: By Market Size, By Capacity, 2014�2021 (USD Million)
Table 57 Kanupp Nuclear Power Plant Decommissioning Phases
Table 58 Rest of Asia-Pacific: Nuclear Decommissioning Services Market Size, By Decommissioning Strategy, 2014�2021 (USD Million)
Table 59 Rest of Asia-Pacific :By Market Size, By Reactor Type, 2014�2021 (USD Million)
Table 60 Rest of Asia-Pacific: By Market Size, By Capacity, 2014�2021 (USD Million)
Table 61 Contracts & Agreements, 2015�2016
Table 62 New Product/Technology Developments, 2013�2016
Table 63 Mergers & Acquisitions, 2014�2016
Table 64 Expansions, 2015
Table 65 Joint Ventures/Collaborations, 2015�2016
List of Figures (41 Figures)
Figure 1 Nuclear Decommissioning Services: Market Segmentation
Figure 2 Nuclear Decommissioning Services Market: Research Design
Figure 3 Bottom-Up Approach
Figure 4 Top-Down Approach
Figure 5 Assumptions of the Research Study
Figure 6 Limitations of the Research Study
Figure 7 Europe Dominated the Market in 2015
Figure 8 BWR Segment to Occupy the Largest Market Share (Value) During the Forecast Period
Figure 9 Market Size, By Capacity, 2016 & 2021 (USD Million)
Figure 10 Immediate Dismantling Segment is Expected to Generate the Highest Demand From 2016 to 2021
Figure 11 Attractive Market Opportunities
Figure 12 Boiling Water Reactor Segment is Estimated to Dominate the Market During the Forecast Period
Figure 13 BWR Reactor Type Segment Accounted for the Largest Share in the European Market, 2015
Figure 14 North America is Expected to Grow at the Highest CAGR in the Market , 2016�2021
Figure 15 Europe is Expected to Account for the Largest Share of Up to 800 MW Within the Market During the Forecast Period
Figure 16 Nuclear Decommissioning Services Market: Market Segmentation
Figure 17 By Reactor Type
Figure 18 By Capacity
Figure 19 By Decommissioning Strategy
Figure 20 By Region
Figure 21 Compatibility to Explosive and Hazardous Environments and Compact Nature of Nuclear Decommissioning Services to Drive the Market
Figure 22 Operational Nuclear Reactors By Age
Figure 23 Supply Chain Analysis: Market
Figure 24 Porter�s Five Forces Analysis: Market
Figure 25 Market Share (Value), By Capacity, 2016�2021
Figure 26 Country-Wise Snapshot of the Nuclear Decommissioning Services Market, in Terms of CAGR, During the Forecast Period
Figure 27 Market Share (Value), By Region, 2015
Figure 28 North America & Europe are Projected to Dominate the Market, in Terms of CAGR, During the Forecast Period
Figure 29 Companies Adopted Contracts & Agreements and New Product/Service/Technology Developments to Capture the Market
Figure 30 Battle for Market Share: Contracts & Agreements Was the Key Strategy, 2013�2016
Figure 31 Market Evaluation Framework: Contracts & Agreements, Expansions, and New Product Launches Fueled the Growth of Companies From 2012-2016
Figure 32 Region-Wise Revenue Mix of the Top 4 Market Players
Figure 33 Aecom: Company Snapshot
Figure 34 Aecom: SWOT Analysis
Figure 35 Areva Group: Company Snapshot
Figure 36 Areva Group.: SWOT Analysis
Figure 37 Babcock International Group PLC.: Company Snapshot
Figure 38 Babcock International Group PLC.: SWOT Analysis
Figure 39 Studsvik AB: Company Snapshot
Figure 40 Studsvik AB: SWOT Analysis
Figure 41 Westinghouse Electric Company: SWOT Analysis


Growth opportunities and latent adjacency in Nuclear Decommissioning Services Market