Non-Lethal Weapons Market by End User (Military, Law Enforcement), Product Type (Direct Contact Weapons, Directed Energy Weapons), Technology (Electromagnetic, Mechanical & Kinetic, Chemical & Others) & Region - Global Forecast to 2020


The non-lethal weapons market is projected to grow from USD 5.65 billion in 2015 to USD 8.37 billion by 2020, at a CAGR of 8.2% during the forecast period of 2015 to 2020. Non-lethal weapons also known as less lethal weapons and this report covers forecasts of the non-lethal weapons market and its dynamics over the next five years, while also recognizing market application gaps, evolving technologies, recent developments in the market, and high potential geographic regions and countries. The non-lethal weapons market has been analyzed on the basis of end user (including military and law enforcement), product type (direct contact weapons, directed energy weapons), and technology (electromagnetic, mechanical & kinetic, chemical, others), considering 2014 as the base year and forecast period of 2015 to 2020. The report provides in-depth market intelligence regarding the non-lethal weapon market and major factors, including drivers, restraints, opportunities, and challenges that may influence the growth of the market. It also provides an analysis of micromarkets with respect to individual growth trends, growth prospects, and their contribution to the overall market.
Market Dynamics
Drivers
- Increasing political disputes and civil unrest
- Militarization of law enforcement agencies
Restraints
- Stringent environment and governmental regulations
- Declining defense budgets of advanced economies
Opportunities
- Increasing research and development
- Increasing defense expenditures of emerging economies
Challenges
- Trafficking and indiscriminate use of non-lethal weapons
- Apprehensions among end users
Increasing political disputes and civil unrest drives the global non-lethal weapons market
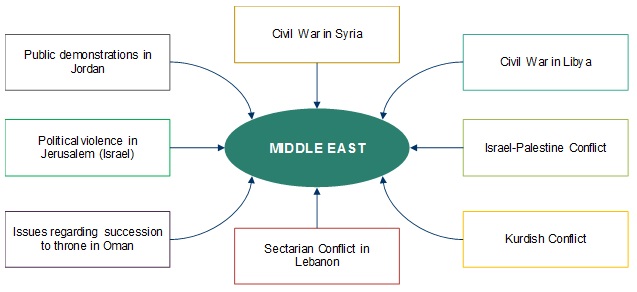
Political disputes, violence, and civil unrest have been on the rise globally, in the recent years, driven by domestic as well as geopolitical situations and policies. The adverse geopolitical conditions in Eastern Europe, the Middle East, and East Asia have contributed highly to this global trend. Sub-Saharan Africa is home to 16 high to severe risk countries, barring a few others, driven by the increasing political violence and insurgency in the region. In terms of concentration of risk of political violence and civil unrest, the major affected regions have been identified to be the Middle East, South Asia, and North Africa. Rising political violence, terrorism, insurgency, and civil unrest in the Middle East is expected to render the region the highest growing in the market for non-lethal weapons in the coming years. The intensification of political violence in Iraq, Yemen, Syria, and Saudi Arabia can be regarded as one of the major factors for this trend. Some of the key conflicts or instances of conflict/civil unrest in the Middle East have been represented below:
The following are the major objectives of the study.
- To analyze the overall report, along with market projections from 2015 to 2020
- To define, describe and forecast the global non-lethal weapons market based on end user, product type, and technology, along with country-level analysis
- To understand the market structure by identifying various subsegments of the report
- To provide in-depth market intelligence regarding market dynamics and major factors that influence the growth of report (drivers, restraints, opportunities and industry-specific challenges)
- To strategically analyze micromarkets1 with respect to individual growth trends, future prospects, and their contribution to the overall report
- To analyze the opportunities in the market for stakeholders by identifying key market trends
- To forecast the market size of segments with respect to major countries, namely the US, Canada, the UK, Germany, France, Russia, Turkey, China, India, Japan, South Korea, Australia, Saudi Arabia, Israel, UAE, and Brazil, among others
- To analyze competitive developments such as long-term contracts, joint ventures, mergers and acquisitions, new product launches and developments, and research and development in the report
- To provide a detailed competitive landscape of the report, along with analysis of the business and corporate strategies adopted by the key market players
- To strategically profile key market players and comprehensively analyze their core competencies2
The non-lethal weapons market is projected to grow from USD 5.65 billion in 2015 to USD 8.37 billion by 2020, at a CAGR of 8.2% during the forecast period. Factors such as militarization of law enforcement agencies, polarization of civilians and driving maximum efficacy and minimum liability, among others are directly influencing the non-lethal weapons market.
The non-lethal weapons is a highly dynamic and high-potential market for several reasons. The volatile dynamics of this market can be attributed to the changing geo-political dynamics of the global economy as well as the increasing incidences armed conflicts, violence, and terrorism, among others. For instance, the Middle East, North Africa, and South Asian regions have been identified to be high-potential markets for non-lethal weapons, owing to the exponential growth in demand from these regions in recent years. These rising trends of demand are the consequences of various instances of civil unrest and conflicts in these regions, such as the civil war in Syria, sectarian conflicts in Lebanon, political violence in Jerusalem, and so on. Such events call for highly enhanced response from law enforcement as well as military forces. As a result, the procurement of non-lethal weapons by law enforcement agencies is slated to increase significantly in the coming years.
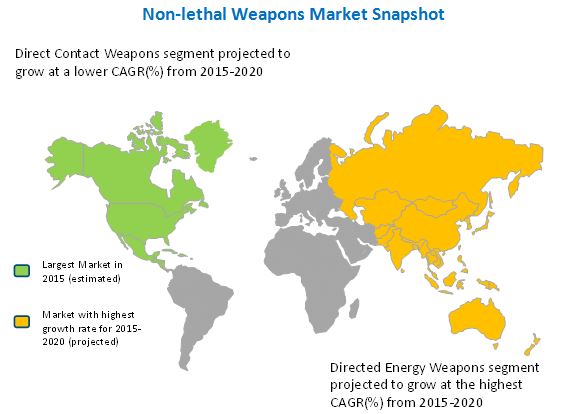
In this report, the market has been segmented by product type, by end-user and by technology. The product type is subcategorized as direct contact weapons and directed energy weapons, whereas the end–user is segmented into military and law enforcement. The directed energy weapons market is growing at a higher CAGR in comparison with direct contact weapons due to advancement in laser technologies and microwave-based weapons, such as active denial systems or ‘pain ray’ weapons.
The Asia-Pacific region is expected to exhibit the highest growth rate in the non-lethal weapons market, and is projected to grow at the highest CAGR during the forecast period from 2015 to 2020. The Asia-Pacific market is expected to grow at the highest CAGR because several Asia-Pacific countries such as India, China, Australia, South Korea, and others have focused on production of non-lethal weapons for military and law enforcement application, such as border control, riot control, and de-escalations use in one-on-one conflict, among others.
The growth of the non-lethal weapons market may, however, be affected by certain major restraints in the coming years. These factors include stringent environmental and governmental regulations, and declining defense budgets of advanced economies, among others.
Several key players operating in the global non-lethal weapons market have been identified to be Taser International Manufacturing Company (US), Combined Systems Inc. (US), The Safariland Group (US), and Amtec Less Lethal Systems Inc. (US) and Condor Non-lethal technologies (Brazil), among others. Long-term contracts, and mergers and acquisitions are the major growth strategies adopted by the major players to strengthen their position in the non-lethal weapons market, while also enhancing their product offerings.
non-lethal weapon market industry analysis
|
Qualitative Market Analysis |
Quantitative Market Analysis |
|
|
|
|
|
|
|
|
|
|
Law enforcement segment of non-lethal weapon market is projected to grow at the highest CAGR during the forecast period
The non-lethal weapon market has been segmented based on end user into military and law enforcement. The overall industry is dominated by the law enforcement segment, primarily because law enforcement agencies are deployed for riot control, and military personnel are deployed only when the riot situation is out of control of the police forces or Special Forces.
End User, 2016 (%)
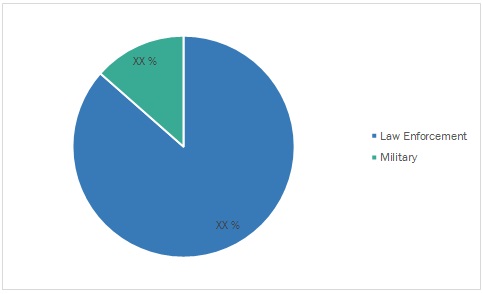
Law Enforcement
The law enforcement segment, in this context, is constituted by three sub-segments, namely, first responder, police forces, and Special Forces. Among these agencies, the police forces segment dominates the non-lethal weapons market, as of 2015. Special Forces have primarily resulted from the increasing militarization of police forces worldwide; for instance, the SWAT (Special Weapons & Tactics) team in the US.
Law Enforcement, By type 2016 (%)
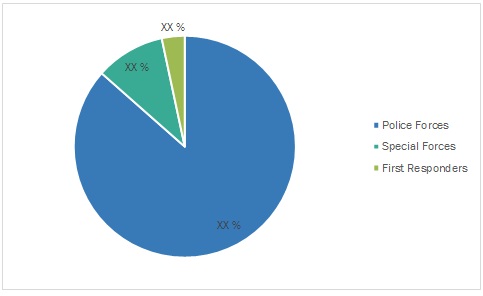
Police forces are deployed in large numbers during disasters, accidents, terrorist attacks, riots, and many such incidents that may affect citizens or public assets. To neutralize such threats, police forces are instructed to first use non-lethal weapons, as per the rules of engagement. The following figure represents the market projections for the law enforcement non-lethal weapons during the period of 2014 to 2020.
To speak to our analyst for a discussion on the above findings, click Speak to Analyst
 Exclusive indicates content/data unique to MarketsandMarkets and not available with any competitors.
Table of Contents
1 Introduction (Page No. - 17)
1.1 Objectives of the Study
1.2 Market Definition
1.3 Study Scope
1.3.1 Markets Covered
1.3.2 Years Considered for the Study
1.4 Currency & Pricing
1.5 Distribution Channel Participants
1.6 Limitations
1.7 Market Stakeholders
2 Research Methodology (Page No. - 21)
2.1 Research Data
2.1.1 Secondary Data
2.1.1.1 Key Data From Secondary Sources
2.1.2 Primary Data
2.1.2.1 Key Data From Primary Sources
2.1.2.2 Key Industry Insights
2.1.2.3 Breakdown of Primaries
2.2 Factor Analysis
2.2.1 Introduction
2.2.2 Demand-Side Analysis
2.2.2.1 Militarization of Law Enforcement Agencies
2.2.2.2 Polarization of Civilians
2.2.3 Supply-Side Analysis
2.2.3.1 Drive to Maximize Efficacy and Minimize Liability
2.3 Market Size Estimation
2.3.1 Bottom-Up Approach
2.3.2 Top-Down Approach
2.4 Market Breakdown & Data Triangulation
2.5 Research Assumptions
3 Executive Summary (Page No. - 35)
4 Premium Insights (Page No. - 39)
4.1 Attractive Market Opportunities in Non-Lethal Weapons Market
4.2 Market, By End User
4.3 Market, By Product Type
4.4 Market, By Technology
4.5 Market Share Analysis, By Region
4.6 North America: Market, By Product Type
4.7 Life Cycle Analysis, By Region
5 Market Overview (Page No. - 43)
5.1 Introduction
5.2 Market Segmentation
5.2.1 By End User
5.2.2 By Product Type
5.2.3 By Technology
5.3 Market Dynamics
5.3.1 Drivers
5.3.1.1 Increasing Political Disputes and Civil Unrest
5.3.1.2 Militarization of Law Enforcement Agencies
5.3.2 Restraints
5.3.2.1 Stringent Environmental and Governmental Regulations
5.3.2.2 Declining Defense Budgets of Advanced Economies
5.3.3 Opportunities
5.3.3.1 Increasing Research and Development
5.3.3.2 Increasing Defense Expenditures of Emerging Economies
5.3.4 Challenges
5.3.4.1 Trafficking and Indiscriminate Use of Non-Lethal Weapons
5.3.4.2 Apprehensions Among End Users
6 Industry Trends (Page No. - 57)
6.1 Introduction
6.2 Supply-Chain Analysis
6.2.1 Prominent Companies
6.2.2 Small-Medium Enterprises (SMES)
6.2.3 End-Users
6.2.4 Regulatory Bodies
6.2.5 Key Influencers
6.3 Value-Chain Analysis
6.4 Industry Trends
6.5 Technology Trends
6.5.1 Increasing Demand for Directed Energy Weapon (Dazzlers)
6.5.2 Active Denial Technology
6.5.3 Chemical Oxygen Iodine Laser
6.5.4 High Power Microwave Weapons
6.5.5 Malodorants
6.5.6 Calmative Agents
6.6 Porter’s Five Forces Analysis
6.6.1 Threat of New Entrants
6.6.2 Threat of Substitutes
6.6.3 Bargaining Power of Suppliers
6.6.4 Bargaining Power of Buyers
6.6.5 Intensity of Competitive Rivalry
6.7 Innovation & Patent Registrations
6.8 Key Trend Analysis
7 Non-Lethal Weapons Market, By End User (Page No. - 71)
7.1 Introduction
7.2 Law Enforcement
7.2.1 First Responder
7.2.2 Police Forces
7.2.3 Special Forces
7.3 Military
8 Market, By Product Type (Page No. - 77)
8.1 Introduction
8.2 Direct Contact Non-Lethal Weapons
8.2.1 Gases & Sprays
8.2.1.1 Scent-Based Weapons
8.2.1.2 Pepper Spray
8.2.1.3 Tear Gas
8.2.2 Grenade Launchers
8.2.3 Water Weapons
8.3 Directed Energy Weapons (DEW)
8.3.1 Immobilizers
8.3.1.1 Taser Guns
8.3.1.2 Stun Guns
8.3.2 Crowd Control Weapons
9 Market, By Technology (Page No. - 88)
9.1 Introduction
9.2 Electromagnetic Non-Lethal Weapons
9.2.1 Electrical
9.2.2 Radio Frequency
9.2.3 Microwave Frequency
9.2.4 Infrared
9.2.5 Visible Light
9.2.6 Ultralight
9.3 Mechanical & Kinetic Non-Lethal Weapons
9.3.1 Blunt Impact Devices
9.3.2 Barriers
9.3.3 Entanglements
9.4 Chemical Non-Lethal Weapons
9.4.1 Foams
9.4.2 Malodorants
9.5 Others
10 Regional Analysis (Page No. - 98)
10.1 Introduction
10.2 North America
10.2.1 By End-User
10.2.2 By Product Type
10.2.3 By Technology
10.2.4 By Country
10.2.4.1 U.S.
10.2.4.1.1 By Technology
10.2.4.2 Canada
10.2.4.2.1 By Technology
10.3 Europe
10.3.1 By End User
10.3.2 By Product Type
10.3.3 By Technology
10.3.4 By Country
10.3.4.1 U.K.
10.3.4.1.1 By Technology
10.3.4.2 Germany
10.3.4.2.1 By Technology
10.3.4.3 Russia
10.3.4.3.1 By Technology
10.4 Asia-Pacific
10.4.1 By End User
10.4.2 By Product Type
10.4.3 By Technology
10.4.4 By Country
10.4.4.1 China
10.4.4.1.1 By Technology
10.4.4.2 India
10.4.4.2.1 By Technology
10.4.4.3 South Korea
10.4.4.3.1 By Technology
10.5 Middle East
10.5.1 By End User
10.5.2 By Product Type
10.5.3 By Technology
10.5.4 By Country
10.5.4.1 Saudi Arabia
10.5.4.1.1 By Technology
10.5.4.2 Israel
10.5.4.2.1 By Technology
10.6 Latin America
10.6.1 By End User
10.6.2 By Product Type
10.6.3 By Technology
10.6.4 By Country
10.6.4.1 Brazil
10.6.4.1.1 By Technology
10.6.4.2 Mexico
10.6.4.2.1 By Technology
10.7 Africa
10.7.1 By End User
10.7.2 By Product Type
10.7.3 By Technology
10.7.4 By Country
10.7.4.1 South Africa
10.7.4.1.1 By Technology
11 Competitive Landscape (Page No. - 148)
11.1 Introduction
11.2 Brand Analysis
11.3 Product Mapping
11.4 Rank Analysis
11.5 Market Share Analysis
11.6 Competitive Situations and Trends
11.6.1 Contracts
11.6.2 New Product Launches
11.6.3 Agreements, Acquisition Partnerships, Collaborations, and Joint Ventures
12 Company Profiles (Page No. - 158)
12.1 Introduction
12.1.1 Financial Highlights
12.2 Taser International, Inc.
12.2.1 Business Overview
12.2.2 Product Offerings
12.2.3 Recent Developments
12.2.4 SWOT Analysis
12.2.5 MnM View
12.3 Lrad Corporation
12.3.1 Business Overview
12.3.2 Product Offerings
12.3.3 Recent Developments
12.3.4 SWOT Analysis
12.3.5 MnM View
12.4 Combined Systems, Inc.
12.4.1 Business Overview
12.4.2 Products & Services
12.4.3 Recent Developments
12.5 The Safariland Group
12.5.1 Business Overview
12.5.2 Product Offerings
12.5.3 Recent Developments
12.6 Amtec Less Lethal Systems Inc
12.6.1 Business Overview
12.6.2 Product Offerings
12.6.3 Recent Developments
12.7 Nonlethal Technologies, Inc.
12.7.1 Bussiness Overview
12.7.2 Product Offerings
12.7.3 Recent Developments
12.8 BAE Systems, PLC.
12.8.1 Business Overview
12.8.2 Product Offerings
12.8.3 Recent Developments
12.9 Herstal SA
12.9.1 Business Overview
12.9.2 Product Offerings
12.9.3 Recent Developments
12.10 Armament Systems & Procedures Inc.
12.10.1 Business Overview
12.10.2 Product Offerings
12.10.3 Recent Developments
12.11 Raytheon Company
12.11.1 Business Overview
12.11.2 Product Offerings
12.11.3 Recent Developments
12.12 Lamperd Less Lethal Inc.
12.12.1 Business Overview
12.12.2 Product Offerings
12.12.3 Recent Developments
12.13 Mission Less Lethal Technologies
12.13.1 Business Overview
12.13.2 Product Offerings
12.14 Condor Non-Lethal Technologies
12.14.1 Business Overview
12.14.2 Product Offerings
12.15 Pepperball Technologies, Inc.
12.15.1 Business Overview
12.15.2 Product Offerings
12.15.3 Recent Developments
13 Appendix (Page No. - 194)
13.1 Discussion Guide
13.2 Introducing RT: Real Time Market Intelligence
13.3 Available Customization
13.3.1 Country-Level Analysis
13.3.2 Additional Company Profiles (Upto 5)
13.4 Related Reports
List of Tables (66 Tables)
Table 1 Incidents of Civil Unrest Across the Globe, 2010-2014
Table 2 Mapping Non-Lethal Weapons of the U.S. Dod and Dhs
Table 3 Market Drivers : Regional Analysis
Table 4 Geographic Analysis of Non-Lethal Weapons Market
Table 5 Weapons & Equipment Used By Swat Teams in the U.S.
Table 6 Market is Primarily Driven By the Militarization of Law Enforcement Agencies
Table 7 Factors Affecting Defense Expenditures of Advanced Economies, 2010-2014
Table 8 Stringent Environmental and Governmental Regulations Act as A Major Restraint for the Report Growth
Table 9 Increasing Research and Development is Expected to Offer Significant Growth Opportunities in the Market
Table 10 Trafficking and Indiscriminate Use of Non-Lethal Weapons is Posing Critical Challenges to the Industry
Table 11 Recent Industry Trends in Report
Table 12 Details of Active Denial Systems Technology for Non-Lethal Weapons
Table 13 Innovation & Patent Registrations
Table 14 Market, By End User, 2014-2020 (USD Million)
Table 15 Market in Law Enforcement, By Region, 2014-2020 (USD Million)
Table 16 Market in Law Enforcement, By Submarket, 2014-2020 (USD Million)
Table 17 Market in Military, By Region, 2014-2020 (USD Million)
Table 18 Market, By Product Type, 2014-2020 (USD Million)
Table 19 Direct Contact Non-Lethal Weapons, By Region, 2014-2020 (USD Million)
Table 20 Direct Contact Non-Lethal Weapons, By Submarket, 2014-2020 (USD Million)
Table 21 Gases & Sprays Market, By Subtype, 2014-2020
Table 22 Directed Energy Non-Lethal Weapons, By Region, 2014-2020 (USD Million)
Table 23 Directed Energy Non-Lethal Weapons, By Submarket, 2014-2020 (USD Million)
Table 24 Immobilizers Market, By Subtype, 2014-2020
Table 25 Report, By Technology, 2014-2020 (USD Million)
Table 26 Electromagnetic Non-Lethal Weapons, By Region, 2014-2020 (USD Million)
Table 27 Mechanical & Kinetic Non-Lethal Weapons, By Region, 2014-2020 (USD Million)
Table 28 Chemical Non-Lethal Weapons, By Region, 2014-2020 (USD Million)
Table 29 Other Non-Lethal Weapons, By Region, 2014-2020 (USD Million)
Table 30 Report, By End-User, 2014-2020 (USD Million)
Table 31 Report, By Product Type, 2014-2020 (USD Million)
Table 32 Report, By Technology, 2014-2020 (USD Million)
Table 33 North America Non-Lethal Weapons, By End-User, 2014-2020 (USD Million)
Table 34 North America Non-Lethal Weapons, By Product Type, 2014-2020 (USD Million)
Table 35 North America Non-Lethal Weapons, By Technology, 2014-2020 (USD Million)
Table 36 U.S. : Non-Lethal Weapons, By Technology, 2014-2020 (USD Million)
Table 37 Canada: Non-Lethal Weapons, By Technology, 2014-2020 (USD Million)
Table 38 Europe Non-Lethal Market, By End User, 2014-2020 (USD Million)
Table 39 Europe Non-Lethal Market, By Product Type, 2014-2020 (USD Million)
Table 40 Europe Non-Lethal Weapons, By Technology, 2014-2020 (USD Million)
Table 41 U.K. : Market, By Technology, 2014-2020 (USD Million)
Table 42 Germany : Market, By Technology, 2014-2020 (USD Million)
Table 43 Russia : Market, By Technology, 2014-2020 (USD Million)
Table 44 Asia-Pacific Non-Lethal Weapons, By End User, 2014-2020 (USD Million)
Table 45 Asia-Pacific Non-Lethal Weapons, By Product Type, 2014-2020 (USD Million)
Table 46 Asia-Pacific Non-Lethal Weapons, By Technology, 2014-2020 (USD Million)
Table 47 China : Market, By Technology, 2014-2020 (USD Million)
Table 48 India : Market, By Technology, 2014-2020 (USD Million)
Table 49 South Korea : Market, By Technology, 2014-2020 (USD Million)
Table 50 Middle East Non-Lethal Weapons, By End-User, 2014-2020 (USD Million)
Table 51 Middle East Non-Lethal Weapons, By Product Type, 2014-2020 (USD Million)
Table 52 Middle East Non-Lethal Weapons, By Technology, 2014-2020 (USD Million)
Table 53 Saudi Arabia : Market, By Technology, 2014-2020 (USD Million)
Table 54 Israel : Market, By Technology, 2014-2020 (USD Million)
Table 55 Latin America : Market, By End User, 2014-2020 (USD Million)
Table 56 Latin America : Market, By Product Type, 2014-2020 (USD Million)
Table 57 Latin America Non-Lethal Weapons Market, By Technology, 2014-2020 (USD Million)
Table 58 Brazil : Market, By Technology, 2014-2020 (USD Million)
Table 59 Mexico : Market, By Technology, 2014-2020 (USD Million)
Table 60 Africa Non-Lethal Weapons Market, By End User, 2014-2020 (USD Million)
Table 61 Africa : Market, By Product Type, 2014-2020 (USD Million)
Table 62 Africa : Market, By Technology, 2014-2020 (USD Million)
Table 63 South Africa : Market, By Technology, 2014-2020 (USD Million)
Table 64 Contracts, 2011–2016
Table 65 New Product Launches, 2012–2016
Table 66 Agreements, Partnerships, Collaborations, and Joint Ventures 2012–2016
List of Figures (101 Figures)
Figure 1 Markets Covered : Non-Lethal Weapons
Figure 2 Global Non-Lethal Weapons : Study Years
Figure 3 Research Flow
Figure 4 Research Design
Figure 5 Breakdown of Primary Interviews: By Company Type, Designation & Region
Figure 6 U.S. : State-Wise Allocation of Military-Grade Grenade Launchers to Law Enforcement Agencies
Figure 7 Market Size Estimation Methodology : Bottom-Up Approach
Figure 8 Market Size Estimation Methodology: Top-Down Approach
Figure 9 Data Triangulation
Figure 10 Assumptions of Research Study
Figure 11 Asia-Pacific Expected to Be the Game-Changer for Non-Lethal Weapons Market
Figure 12 Report, By End User, 2015 & 2020 (USD Million)
Figure 13 Agreements, Collaborations, Joint Ventures and Partnerships are the Key Growth Strategies Adopted By Non-Lethal Weapons Players
Figure 14 Attractive Market Opportunities in the Industry, 2015-2020
Figure 15 Law Enforcement Segment Dominates the Industry, as of 2015
Figure 16 Directed Energy Segment Expected to Witness Higher Growth Between 2015 & 2020
Figure 17 Chemical Agents Segment Dominates the Industry, as of 2015
Figure 18 North America Accounted for the Largest Share of the Industry in 2015
Figure 19 The U.S. is Expected to Dominate the North American Industry During the Forecast Period
Figure 20 Asia-Pacific Industry is Expected to Witness Highest Growth During the Forecast Period
Figure 21 Market Segmentation : By End User
Figure 22 Market Segmentation: By Product Type
Figure 23 Market Segmentation: By Technology
Figure 24 Militarization of Law Enforcement Agencies is Expected to Drive the Market in the Coming Years
Figure 25 Key Instances of Political Violence and Unrest in the Middle East
Figure 26 Defense Spending of Advanced Economies, 2010-2014 (USD Million)
Figure 27 Defense Spending of Emerging Economies, 2010-2014 (USD Million)
Figure 28 Supply-Chain : Police Forces is A Dominant End-User Segment for Non-Lethal Weapons
Figure 29 Value-Chain : Major Value is Added During R&D and Manufacturing Phases
Figure 30 Models of Dazzlers:
Figure 31 Porter’s Five Forces Analysis
Figure 32 Report in First Responder, 2014-2020 (USD Million)
Figure 33 Report in Police Forces, 2014-2020 (USD Million)
Figure 34 Report in Special Forces, 2014-2020 (USD Million)
Figure 35 Gases & Sprays Market, 2014-2020 (USD Million)
Figure 36 Grenade Launchers Market, 2014-2020 (USD Million)
Figure 37 Water Weapons Market, 2014-2020 (USD Million)
Figure 38 Immobilizers Market, 2014-2020
Figure 39 Crowd Control Weapons Market, 2014-2020
Figure 40 Regional Snapshot : Growth Rate Analysis, 2015-2020
Figure 41 Report, By End-User, 2014-2020 (USD Million)
Figure 42 Report, By Product Type, 2014-2020 (USD Million)
Figure 43 Report, By Technology, 2014-2020 (USD Million)
Figure 44 North America Snapshot : U.S. to Dominate Non-Lethal Weapons Between 2015 and 2020
Figure 45 North America Non-Lethal Weapons, By End-User, 2014-2020 (USD Million)
Figure 46 North America Non-Lethal Weapons, By Product Type, 2014-2020 (USD Million)
Figure 47 North America Non-Lethal Weapons, By Technology, 2014-2020 (USD Million)
Figure 48 U.S. : Market, By Technology, 2014-2020 (USD Million)
Figure 49 Canada : Market, By Technology, 2014-2020 (USD Million)
Figure 50 Europe Snapshot : U.K. to Dominate the Non-Lethal Weapons Between 2015 and 2020
Figure 51 Europe Non-Lethal Market, By End User, 2014-2020 (USD Million)
Figure 52 Europe Non-Lethal Market, By Product Type, 2014-2020 (USD Million)
Figure 53 Europe Non-Lethal Weapons, By Technology, 2014-2020 (USD Million)
Figure 54 U.K. : Market, By Technology, 2014-2020 (USD Million)
Figure 55 Germany : Market, By Technology, 2014-2020 (USD Million)
Figure 56 Russia : Non-Lethal Weapons, By Technology, 2014-2020 (USD Million)
Figure 57 Asia-Pacific Snapshot : China to Dominate Non-Lethal Weapons Between 2015 and 2020
Figure 58 Asia-Pacific Industry, By End User, 2014-2020 (USD Million)
Figure 59 Asia-Pacific Industry, By Product Type, 2014-2020 (USD Million)
Figure 60 Asia-Pacific Industry, By Technology, 2014-2020 (USD Million)
Figure 61 China : Market, By Technology, 2014-2020 (USD Million)
Figure 62 India : Market, By Technology, 2014-2020 (USD Million)
Figure 63 South Korea : Market, By Technology, 2014-2020 (USD Million)
Figure 64 Middle East Industry, By End-User, 2014-2020 (USD Million)
Figure 65 Middle East Industry, By Product Type, 2014-2020 (USD Million)
Figure 66 Middle East Industry, By Technology, 2014-2020 (USD Million)
Figure 67 Saudi Arabia : Market, By Technology, 2014-2020 (USD Million)
Figure 68 Israel : Market, By Technology, 2014-2020 (USD Million)
Figure 69 Latin America : Market, By End User, 2014-2020 (USD Million)
Figure 70 Latin America : Market, By Product Type, 2014-2020 (USD Million)
Figure 71 Latin America Industry, By Technology, 2014-2020 (USD Million)
Figure 72 Brazil : Market, By Technology, 2014-2020 (USD Million)
Figure 73 Mexico : Market, By Technology, 2014-2020 (USD Million)
Figure 74 Africa Industry, By End User, 2014-2020 (USD Million
Figure 75 Africa : Market, By Product Type, 2014-2020 (USD Million)
Figure 76 Africa : Market, By Technology, 2014-2020 (USD Million)
Figure 77 South Africa : Market, By Technology, 2014-2020 (USD Million)
Figure 78 Companies Adopted New Product Launches as Key Growth Strategy From 2011 to 2016
Figure 79 Brand Analysis of Top Non-Lethal Weapons Market Players
Figure 80 Product Mapping of Top Market Players
Figure 81 Revenue and Product-Based Rank Analysis of Top Market Players
Figure 82 Market Share Analysis for Market Players
Figure 83 Market Evolution Framework, 2013 to 2015
Figure 84 Long-Term Contracts and Agreements, Collaborations, Partnerships and Joint Ventures Were the Key Growth Strategies
Figure 85 Company Landscape, 2014
Figure 86 Financial Highlights of Major Players in Industry
Figure 87 Taser International, Inc. : Company Snapshot
Figure 88 Lard Corporation : Company Snapshot
Figure 89 SWOT Analysis
Figure 90 Combined Systems, Inc. : Company Snapshot
Figure 91 The Safariland Group : Company Snapshot
Figure 92 Amtec Less Lethal Systems Inc. : Company Snapshot
Figure 93 Nonlethal Technologies, Inc. : Company Snapshot
Figure 94 BAE Systems, PLC : Company Snapshot
Figure 95 Herstal SA : Company Snapshot
Figure 96 Armament Systems & Procedures Inc. : Company Snapshot
Figure 97 Raytheon Company : Company Snapshot
Figure 98 Lamperd Less Lethal Inc. : Company Snapshot
Figure 99 Mission Less Lethal Technologies : Company Snapshot
Figure 100 Condor Non- Lethal Technologies: Company Snapshot
Figure 101 Pepperball Technologies, Inc. : Company Snapshot
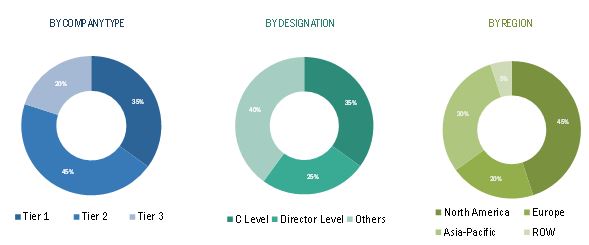
During this research study, major players operating in the non-lethal weapons market in various regions have been identified, and their offerings, regional presence, and distribution channels have been analyzed through in-depth discussions. Top-down and bottom-up approaches have been used to determine the overall market size. Sizes of the other individual markets have been estimated using the percentage splits obtained through secondary sources such as Hoovers, Bloomberg BusinessWeek, and Factiva, along with primary respondents. The entire procedure includes the study of the annual and financial reports of the top market players and extensive interviews with industry experts such as CEOs, VPs, directors, and marketing executives for key insights (both qualitative and quantitative) pertaining to the market. The figure below shows the breakdown of the primaries on the basis of the company type, designation, and region considered during the research study.
To know about the assumptions considered for the study, download the pdf brochure
The ecosystem of the non-lethal weapons market comprises of raw material suppliers, manufacturers, distributors, and end users. The key end users of the non-lethal weapons market are law enforcement sector, followed by military. Some of the key players include Taser International Manufacturing Company (US), Combined Systems Inc. (US), and The Safariland Group (US), among others.
Target Audience
- Non-lethal weapons manufacturers
- Non-lethal weapons dealers
- Sub-component manufacturers
- Technology support providers
Scope of the Report
This research report categorizes the global non-lethal weapons market into the following segments and subsegments:
Global Industry, By End User
- Law Enforcement
- Military
Global Industry, By Product Type
- Direct Contact Weapons
- Directed Energy Weapons
Global Industry, By Technology
- Electromagnetic
- Mechanical and Kinetic
- Chemical
- Others
Global Industry, By Region
- North America
- Europe
- Middle East
- Asia-Pacific
- Latin America
- Africa
Critical questions which the report answers
- How will the non-lethal weapons market drivers, restraints and future opportunities affect the market dynamics and subsequent market analysis of the associated trends?
- Which are the key players in the market and how intense is the competition?
Customizations available for the report
With the given market data, MarketsandMarkets offers customizations as per specific needs of a company. The following customization options are available for the report:
Geographic Analysis
- Further breakdown of the Rest of Asia-Pacific market into Australia, Malaysia, and New Zealand, among others
Company Information
- Detailed analysis and profiling of additional market players (Upto 5)


Growth opportunities and latent adjacency in Non-Lethal Weapons Market
I am looking for charts to demonstrate the anticipated market growth of non-lethal weapons. Currently available charts that show previous expectations are all under reporting current sales. As a manufacturer I am very familiar with the marketplace but do not have a good resource for charts unless I make them myself.