Narrowband IoT (NB-IoT) Enterprise Application Market by Application Software, Technology Service, Vertical, Smart Application (Smart Governance, Smart Metering, Smart Homes, Smart Asset Tracking), and Region- Global Forecast to 2022


[136 Pages Report] Narrowband IoT market size is expected to grow from USD 320.5 million in 2017 to USD 8221.3 million by 2022, at a Compound Annual Growth Rate (CAGR) of 91.3% from 2017 to 2022. The market does not have any base year or historical year, but has an estimated year as 2017 and forecast year as 2021.
The Narrowband IoT enterprise application report aims at estimating the market size and future growth potential of the market across different segments, such as application software, technology services, smart applications, verticals, and regions. The primary objectives of the report includes providing a detailed analysis of the major factors influencing the growth of this market (drivers, restraints, opportunities, industry specific challenges, and burning issues) and analyzing the opportunities in the market for stakeholders and details of a competitive landscape for market leaders.
Market Dynamics
Drivers
- Growing demand for LPWAN use cases across verticals
- High deployment flexibility with GSM, WCDMA, or L T E
- Extended Coverage and Long Battery Life
- Low Deployment Cost
Restraints
- Transformation Downtime During Up Gradation of Existing Base Stations
- Competition From Rival LPWAN Technologies
Opportunities
- Rising Need for Connectivity in IoT Applications
- Emerging Smart Cities and Smart Buildings
- Deployment of Intelligent Devices
Challenges
- Deployment Issues and Less Roaming Support
- Uncertainty in Pricing Model
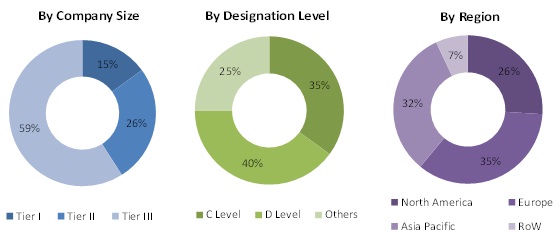
The research methodology used to estimate and forecast the Narrowband IoT enterprise application market begins with capturing data on key vendor revenues through secondary sources such as annual reports, press releases, associations such as The Alliance for Telecommunications Industry Solutions, USA (ATIS), and databases such as Factiva and Bloomberg BusinessWeek, company websites, and news articles. The vendor offerings are also taken into consideration to determine market segmentation. The bottom-up procedure was employed to arrive at the overall market size of the Narrowband IoT enterprise application market from the revenue of the key players in the market. After arriving at the overall market size, the total market was split into several segments and sub-segments, which were then verified through primary research by conducting extensive interviews with key industry personnel, such as CEOs, VPs, Directors, and Executives. The data triangulation and market breakdown procedures were employed to complete the overall market engineering process and to arrive at the exact statistics for all segments and sub-segments. The breakdown of the profiles of primary discussion participants is depicted in the below figure:
To know about the assumptions considered for the study, download the pdf brochure
The Narrowband IoT enterprise application market comprises companies such as Vodafone Group Plc, China Unicom, China Telecom, AT&T, Etisalat, Telstra, Orange S.A. Telefonica, and S.K Telecom. Further, the solutions developed by these companies are used by energy & utilities, retail, healthcare, aviation, industrial manufacturing, and transportation & logistics sectors.
Major Market Developments
- In July 2016, China Unicom entered into a partnership with Huawei to launch NB-IoT based smart parking solution. China Unicom will first deploy dedicated NB-IoT networks covering all of Shanghai to improve the operation management capabilities and efficiency of the city.
- In February 2016, AT&T entered into a partnership with Ericsson, to install CAT-M and NB-IoT 3GPP standards-based technologies. This new software will maintain a new generation of IoT application and increase device performance on the AT&T 4G LTE network.
- In September 2016, Vodafone completed its first ever NB-IoT connection on a live mobile network. It will be launching its commercial services for NB-IoT in 2017 and is planning to launch NB-IoT networks in Australia, Ireland, the Netherlands, and Turkey.
- In February 2016, Etisalat entered into partnership with Oberthur Technologies (OT), a leading global provider of embedded security software products, services, and solutions in order to launch M2M and IoT services.
Key Target Audience
- LPWAN Solution Providers
- Mobile Network Operators (MNOs)
- Mobile Service Providers
- Original Equipment Manufacturers (OEMs)
- Solution Providers
- System Integrators
- Government Organizations
- Investors and Venture Capitalists
Scope of the Report
The research report categorizes the Narrowband IoT enterprise application market to forecast the revenues and analyze the trends in each of the following sub-segments:
By Application Software
- Security solutions
- Real Time Streaming Analytics
- Soil monitoring solutions
- Asset tracking solutions
- Logistics tracking solutions
- Smart Parking Management Solutions
- Others
By Technology Service
- Managed
- Professional
By Vertical
- Agriculture
- Logistics and Transportation
- Healthcare
- Manufacturing
- Energy and Utilities
- Retail
- Others
By Smart Applications
- Smart Governance
- Smart Metering
- Smart Buildings
- Smart Asset Tracking
- Others
By Region
- North America
- Europe
- Asia-Pacific (APAC)
- Middle East and Africa (MEA)
- Latin America
Available Customizations
With the given market data, MarketsandMarkets offers customization as per the company�s specific requirements. The following customization options are available for the report:Geographic Analysis
- Further breakdown of the North American Narrowband IoT enterprise application market
- Further breakdown of the European Narrowband IoT enterprise application market
- Further breakdown of the APAC Narrowband IoT enterprise application market
- Further breakdown of the MEA Narrowband IoT enterprise application market
- Further breakdown of the Latin American Narrowband IoT enterprise application market
Company Information
- Detailed analysis and profiling of additional market players
MarketsandMarkets forecasts the global Narrowband IoT market size to grow from USD 320.5 million in 2017 to USD 8221.3 million by 2022, at a Compound Annual Growth Rate (CAGR) of 91.3% from 2017 to 2022. Growing demand for Low-Power Wide Area Network (LPWAN) use cases across verticals, high deployment flexibility with GSM, WCDMA, or LTE,extended coverage and long battery life, low deployment cost are some of the general driving factors for NB-IoT market.
The NB-IoT enterprise application market is broadly classified by vertical into Agriculture, manufacturing, healthcare, energy and utilities, transport and logistics, retail and others. The energy and utilities sector commands the major market share and is the fastest growing vertical in this market as it is considered an important element in the day to day means and use. Energy resources needed to be utilized in an optimized manner as scarcity will with not only affect the present but also the future.
Smart parking management solution is expected to dominate the application software segment in the narrowband IoT market as the number of vehicles are increasing day by day, smartly parking would help the management of vehicles, utilizing the parking space in an optimized way with the help of NB-IoT application software.
Professional services are expected to lead the market and managed services is expected to carry the highest CAGR in the services segment as these services assist companies in developing firm strategies and provide resources that allow them to manage the technology at a lower cost. Until recently, a majority of managed services have been adopted for very specific needs, but more competitors are ramping up to offer enterprise service models.
Smart metering will be leading the market and asset tracking is expected to be the fastest growing market in the NB-IoT smart application market as wireless asset tracking, sensing and control of products would provide a round-the-clock visibility concerning the whereabouts and state of assets in the supply chain. Its mapping abilities with custom data cover the visualization of the real-time state and location as well as the status history of any asset being tracked. Asset tracking helps the owners of the assets to sense and preventively react to unexpected events such as pets or livestock or kids and others.
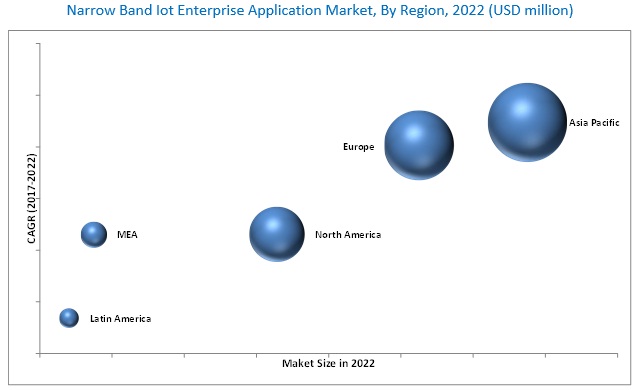
The NB-IoT market is segmented across five regions, namely, North America, Asia-Pacific (APAC), Europe, the Middle East and Africa (MEA), and Latin America. APAC is expected to account for the largest share of the overall NB-IoT enterprise application market with highest CAGR as well in the forecast period, as in coming years, this region will ne see a huge number of smart cities growing which will be implementing a lot of smart application and other advanced software which is most likely to use NB-IoT applications and software.
Large technology deployments invoke system downtime, where IT systems and support have to be switched off and become unavailable for operations, and competition from rival LPWAN technologies are major restraining factor in this market. However, rising need of connectivity in IoT applications, emerging smart cities and smart buildingsand deployment of intelligent devices are expected to provide significant growth opportunities in future. Some of the major technology vendors include such as Vodafone Group PLC, China mobile, China Unicom, AT&T, Honeywell International Inc. (U.S.), SK Telecom, and Etisalat. These companies have just entered into the trial version for launching NB-IoT solutions and have also entered into some of the collaborations in order to launch a NB-IoT application.
Real time streaming analysis
These days, organizations are focusing more towards the usage of advanced IT systems to overcome the challenges faced by them in day-to-day operations such as monitoring critical assets and tracking logistics. Huge data volumes are generated through various smart and connected devices, which are used for various applications across different industry verticals. This data could be transformed into crucial information and insights with the help of advanced IT solutions to yield greater efficiency, productivity, and profitability to the organizations. Advanced solutions such as real-time streaming analytics have transformed the conventional management into fact-based, decision-driven management. The real-time streaming analytics solution enables the organizations to analyse the data generated in different format in real-time as soon as the data-set arrives.
Soil Monitoring Solution
Fields and meadowlands are occasionally inaccessible from cell networks, where narrowband wave length solutions can act as a boon. Agriculturalists and farmers can get substantial benefit from real-time data indicating small differences in soil moisture, temperature, and humidity between and even within fields. The application software can provide them with real-time agricultural sensor data, with emphasis on precision irrigation, enabling growers to produce higher yields of better quality crops while helping to conserve natural resources. Soil moistness sensors from a producer can be linked to the independent NB-IoT modem and positioned in the field. Each modem would then transfer parameters of soil to the base station located in the farm location covering more than 7000 square kilometers of surrounding area. Data would then be received processed by the server and displayed in the client�s application.
Asset Tracking Solution
Asset tracking systems usually consists of desktop software, a mobile application, barcode scanners, and barcode labels. These elements transport the resources to locate physical objects, gather data on its usage and whereabouts, and report on all activity. The system allows businesses of any size to effectively track a pool of assets from when the items are bought or received, until they are transported or disposed. NB-IoT provides a wireless asset to track, sense, and control the product that would provide a round-the-clock visibility concerning the whereabouts and state of assets in the supply chain. Their mapping ability with custom data covers the visualization of the real-time state and location as well as the status history of any asset being tracked.
Logistics Tracking Solution
Logistics tracking solutions are interdependent set of communication devices, joints, and IoT technologies, that track key logistical processes to become more customer-centric by sharing data, information, and facts with supply chain partners. These tracking solutions include business processes related to warehouse, transportation, and associated logistics processes such as order processing, financial transactions, shipping, and dispatch & picking. NB-IoT would help drive more effective business decisions by identifying the crucial bottlenecks and thereby facilitating in critical decision making. Though the concept of NB-IoT is new, it is expected to gain traction in the coming years. NB-IoT would offer connectivity for tracking goods, trucks, trains, planes, ships, and boats and the sensors installed on each vessel, keeping a track of the shipments and monitoring the performance and health of the vehicles carrying them.
Smart Tracking Management Solution
Effective parking management permits drivers to find free parking space and avoid congestion while parking. NB-IoT technology makes a great wireless solution for parking sensors in a single garage/ parking, as compared to wired car parking sensor systems that are expensive for installation on a wide area of urban places. Instead of mounting wire line acoustic sensors to each space, long life sensor can be used beneath each parking spot which will be less expensive. Smart parking management solutions can visualize data when any parking event such as vehicle entering or leaving the area takes place. The parking sensor transmits a small amount of data but requires high autonomy
Critical questions the report answers:
- Where will all these developments take the industry in the mid to long term?
- What are the upcoming industry trends in NB-IoT market?
To speak to our analyst for a discussion on the above findings, click Speak to Analyst
 Exclusive indicates content/data unique to MarketsandMarkets and not available with any competitors.
1 Introduction (Page No. - 14)
1.1 Objectives of the Study
1.2 Market Definition
1.3 Market Scope
1.3.1 Markets Covered
1.3.2 Years Considered for the Study
1.3.3 Currency
1.4 Limitations
1.5 Stakeholders
2 Research Methodology (Page No. - 17)
2.1 Introduction
2.2 Research Data
2.2.1 Secondary Data
2.2.1.1 Key Data From Secondary Sources
2.2.2 Primary Data
2.2.2.1 Key Data From Primary Sources
2.2.2.2 Key Industry Insights
2.2.2.3 Breakdown of Primary Interviews
2.3 Market Size Estimation
2.3.1 Bottom-Up Approach
2.3.2 Top-Down Approach
2.4 Market Breakdown and Data Triangulation
2.5 Market Forecast Assumptions
3 Executive Summary (Page No. - 25)
4 Premium Insights (Page No. - 31)
4.1 Attractive Market Opportunities in the Narrowband IoT market
4.2 Market By Smart Application, 2017�2022
4.3 Global Narrowband IoT Market: By Smart Application and By Region
4.4 Life Cycle Analysis, By Region (2017)
5 Narrowband IoT Market Overview (Page No. - 34)
5.1 Introduction
5.2 Evolution
5.3 Market Segmentation
5.3.1 By Application Software
5.3.2 By Technology Service
5.3.3 By Application
5.3.4 By Vertical
5.3.5 By Region
5.4 Market Dynamics
5.4.1 Drivers
5.4.1.1 Growing Demand for LPWAN Use Cases Across Verticals
5.4.1.2 High Deployment Flexibility With Gsm, Wcdma, Or Lte
5.4.1.3 Extended Coverage and Long Battery Life
5.4.1.4 Low Deployment Cost
5.4.2 Restraints
5.4.2.1 Transformation Downtime During Up Gradation of Existing Base Stations
5.4.2.2 Competition From Rival LPWAN Technologies
5.4.3 Opportunities
5.4.3.1 Rising Need for Connectivity in IoT Applications
5.4.3.2 Emerging Smart Cities and Smart Buildings
5.4.3.3 Deployment of Intelligent Devices
5.4.4 Challenges
5.4.4.1 Deployment Issues and Less Roaming Support
5.4.4.2 Uncertainty in Pricing Model
6 Narrowband IoT Market: Industry Trends (Page No. - 43)
6.1 Introduction
6.2 Value Chain Analysis
6.3 Strategic Benchmarking
6.4 Ecosystem
7 Narrowband IoT Market Analysis, By Application Software (Page No. - 46)
7.1 Introduction
7.2 By Application Software
7.2.1 Security Solutions
7.2.2 Real Time Streaming Analytics
7.2.3 Soil Monitoring Solutions
7.2.4 Asset Tracking Solutions
7.2.5 Logistics Tracking Solutions
7.2.6 Smart Parking Management Solutions
7.2.7 Others
8 Narrowband IoT Market Analysis, By Technology Services (Page No. - 54)
8.1 Introduction
8.1.1 Professional Services
8.1.2 Managed Services
9 Narrowband IoT Market Analysis, By Vertical (Page No. - 58)
9.1 Introduction
9.2 Agriculture
9.3 Logistics and Transportation
9.4 Healthcare
9.5 Industrial Manufacturing
9.6 Energy and Utilities
9.7 Retail
9.8 Others
10 Narrowband IoT Market Analysis, By Smart Applications (Page No. - 66)
10.1 Introduction
10.2 Smart Governance
10.2.1 Smart Lighting
10.2.2 Smart Parking
10.2.3 Smart Waste Management
10.2.4 Smart Traffic Management
10.3 Smart Metering
10.3.1 Smart Electric
10.3.2 Smart Gas
10.3.3 Smart Water
10.4 Smart Buildings
10.4.1 Smart Homes
10.4.2 Smart Offices
10.5 Smart Asset Tracking
10.6 Others
11 Geographic Analysis (Page No. - 79)
11.1 Introduction
11.2 North America
11.3 Europe
11.4 Asia-Pacific
11.5 Middle East and Africa
11.6 Latin America
12 Competitive Landscape (Page No. - 104)
12.1 Overview
12.2 Competitive Situations and Trends
12.3 Partnerships, Agreements, and Collaborations
12.4 New Services Launches
13 Company Profiles (Page No. - 107)
13.1 Introduction
(Overview, Financials, Products & Services, Strategy, and Developments)*
13.2 AT&T, Inc.
13.3 China Mobile Limited
13.4 Orange S.A
13.5 SK Telecom Co., Ltd.
13.6 Vodafone Group PLC
13.7 China Unicom
13.8 Deutsche Telekom AG
13.9 Etisalat
13.10 Telefonica SA
13.11 Telstra Corporation Limited
*Details on Overview, Financials, Product & Services, Strategy, and Developments Might Not Be Captured in Case of Unlisted Companies.
14 Appendix (Page No. - 128)
14.1 Industry Experts
14.2 Discussion Guide
14.3 Knowledge Store: Marketsandmarkets� Subscription Portal
14.4 Introducing RT: Real-Time Market Intelligence
14.5 Available Customizations
14.6 Related Reports
List of Tables (88 Tables)
Table 1 Narrowband IoT Market Size, By Smart Application, 2017�2022 (USD Million)
Table 2 Smart Applications Market Size, By Smart Metering, 2017�2022 (USD Million)
Table 3 Market Size, By Technology Service, 2017�2022 (USD Million)
Table 4 Market Size, By Vertical, 2017�2022 (USD Million)
Table 5 Global Market Size, 2017-2022 (USD Million)
Table 6 Market Size, By Region, 2017-2022 (USD Million)
Table 7 Market Size, By Application Software, 2017-2022 (USD Million)
Table 8 Security Solutions: Market Size, By Region, 2017-2022 (USD Million)
Table 9 Real Time Streaming Analytics: Market Size, By Region, 2017-2022 (USD Million)
Table 10 Soil Monitoring Solutions: Market Size, By Region, 2017-2022 (USD Million)
Table 11 Asset Tracking Solutions: Market Size, By Region, 2017-2022 (USD Million)
Table 12 Logistics Tracking Solutions: Market Size, By Region, 2017-2022 (USD Million)
Table 13 Smart Parking Management Solutions: Market Size, By Region, 2017-2022 (USD Million)
Table 14 Others Market Size, By Region, 2017-2022 (USD Million)
Table 15 Narrowband IoT Market Size, By Technology Services, 2017-2022 (USD Million)
Table 16 Professional Services: Market Size, By Region, 2017-2022 (USD Million)
Table 17 Managed Services: Market Size, By Region, 2017-2022 (USD Million)
Table 18 Global Market Size, By Vertical, 2017-2022 (USD Million)
Table 19 Agriculture: Market Size, By Region, 2017-2022 (USD Million)
Table 20 Logistics and Transportation: Market Size, By Region, 2017-2022 (USD Million)
Table 21 Healthcare: Market Size, By Region, 2017-2022 (USD Million)
Table 22 Industrial Manufacturing: Market Size, By Region, 2017-2022 (USD Million)
Table 23 Energy and Utilities: Market Size, By Region, 2017-2022 (USD Million)
Table 24 Retail: Market Size, By Region, 2017-2022 (USD Million)
Table 25 Others: Market Size, By Region, 2017-2022 (USD Million)
Table 26 Global Narrowband IoT Market Size, By Smart Applications, 2017-2022 (USD Million)
Table 27 Smart Governance: Market Size, By Type, 2017-2022 (USD Million)
Table 28 Smart Lighting Market Size, By Region, 2017-2022 (USD Million)
Table 29 Smart Parking Market Size, By Region, 2017-2022 (USD Million)
Table 30 Smart Waste Management Market Size, By Region, 2017-2022 (USD Million)
Table 31 Smart Traffic Management Market Size, By Region, 2017-2022 (USD Million)
Table 32 Smart Metering: Market Size, By Type 2017-2022 (USD Million)
Table 33 Smart Electric Market Size, By Region, 2017-2022 (USD Million)
Table 34 Smart Gas Market Size, By Region, 2017-2022 (USD Million)
Table 35 Smart Water Market Size, By Region, 2017-2022 (USD Million)
Table 36 Smart Buildings: Global Market Size, By Types, 2017-2022 (USD Million)
Table 37 Smart Homes Market Size, By Region, 2017-2022 (USD Million)
Table 38 Smart Offices Market Size, By Region, 2017-2022 (USD Million)
Table 39 Smart Asset Tracking: Global Market Size, By Region, 2017-2022 (USD Million)
Table 40 Others: Global Market Size, By Region, 2017-2022 (USD Million)
Table 41 Narrowband IoT Market, By Region, 2017�2022 (USD Billion)
Table 42 North America: Market Size, By Application Solutions, 2017�2022 (USD Million)
Table 43 North America: Market Size, By Technology Service, 2017�2022 (USD Million)
Table 44 North America: Market Size, By Vertical, 2017�2022 (USD Million)
Table 45 North America: Market Size, By Smart Application, 2017�2022 (USD Million)
Table 46 North America: Market Size, By Smart Governance 2017�2022 (USD Million)
Table 47 North America: Market Size, By Smart Metering, 2017�2022 (USD Million)
Table 48 North America: Market Size, By Smart Buildings, 2017�2022 (USD Million)
Table 49 Europe: Narrowband IoT Market Size, By Application Solution, 2017�2022 (USD Million)
Table 50 Europe: Market Size, By Technology Services, 2017�2022 (USD Million)
Table 51 Europe: Market Size, By Verticals, 2017�2022 (USD Million)
Table 52 Europe: Market Size, By Smart Application, 2017�2022 (USD Million)
Table 53 Europe: Market Size, By Smart Governance, 2017�2022 (USD Million)
Table 54 Europe: Market Size, By Smart Metering, 2017�2022 (USD Million)
Table 55 Europe: Market Size, By Smart Building, 2017�2022 (USD Million)
Table 56 Asia-Pacific: Narrowband IoT Market Size, By Application Software, 2017�2022 (USD Million)
Table 57 Asia-Pacific: Market Size, By Technology Services, 2017�2022 (USD Million)
Table 58 Asia-Pacific: Market Size, By Verticals, 2017�2022 (USD Million)
Table 59 Asia-Pacific: Market Size, By Smart Application, 2017�2022 (USD Million)
Table 60 Asia-Pacific: Market Size, By Smart Governance, 2017�2022 (USD Million)
Table 61 Asia-Pacific: Market Size, By Smart Metering, 2017�2022 (USD Million)
Table 62 Asia-Pacific: Market Size, By Smart Buildings, 2017�2022 (USD Million)
Table 63 Middle East and Africa: Market Size, By Application Software, 2017�2022 (USD Million)
Table 64 Middle East and Africa: Market Size, By Technology Services, 2017�2022 (USD Million)
Table 65 Middle East and Africa: Market Size, By Verticals, 2017�2022 (USD Million)
Table 66 Middle East and Africa: Market Size, By Smart Application, 2017�2022 (USD Million)
Table 67 Middle East and Africa: Market Size, By Smart Governance, 2017�2022 (USD Million)
Table 68 Middle East and Africa: Market Size, By Smart Metering, 2017�2022 (USD Million)
Table 69 Middle East and Africa: Market Size, By Smart Building, 2017�2022 (USD Million)
Table 70 Latin America: Narrowband IoT Market Size, By Application Software, 2017�2022 (USD Million)
Table 71 Latin America: Market Size, By Technology Service, 2017�2022 (USD Million)
Table 72 Latin America: Market Size, By Vertical, 2017�2022 (USD Million)
Table 73 Latin America: Market Size, By Smart Application, 2017�2022 (USD Million)
Table 74 Latin America: Market Size, By Smart Governance, 2017�2022 (USD Million)
Table 75 Latin America: Market Size, By Smart Metering, 2017�2022 (USD Million)
Table 76 Latin America: Market Size, By Smart Building, 2017�2022 (USD Million)
Table 77 Partnerships, Agreements, and Collaborations, 2015�2016
Table 78 New Services Launches, 2015�2016
Table 79 Recent Developments and Announcements
Table 80 Recent Developments
Table 81 Recent Developments
Table 82 Recent Developments
Table 83 Recent Developments
Table 84 Recent Developments
Table 85 Recent Developments
Table 86 Recent Developments
Table 87 Recent Developments
Table 88 Recent Developments
List of Figures (59 Figures)
Figure 1 Narrowband IoT Market : Research Design
Figure 2 Breakdown of Primary Interview: By Company, Designation, and Region
Figure 3 Market Size Estimation Methodology: Bottom-Up Approach
Figure 4 Market Size Estimation Methodology: Top-Down Approach
Figure 5 Data Triangulation
Figure 6 Narrowband IoT Market Snapshot, By Smart Application, 2017 vs 2022
Figure 7 Smart Applications Snapshot, By Smart Metering, 2017 vs 2022
Figure 8 Market Snapshot, By Technology Service, 2017 vs 2022
Figure 9 Market Snapshot, By Vertical, 2017 vs 2022
Figure 10 Asia-Pacific is Expected to Hold the Largest Market Share in the Global Market, 2017
Figure 11 Recent Developments in the Narrowband IoT Market Snapshot (June 2016)
Figure 12 Growing Demand for LPWAN Use Cases Across Verticals is Boosting the Market
Figure 13 Smart Metering Segment is Expected to Contribute the Largest Market Share Among the Smart Applications
Figure 14 Smart Metering and Asia-Pacific Accounted for the Largest Shares in the Market
Figure 15 Asia-Pacific is Expected to Lead in the Narrowband IoT Market
Figure 16 Narrowband IoT Market Segmentation
Figure 17 Market Segmentation: By Application Software
Figure 18 Market Segmentation: By Technology Service
Figure 19 Market Segmentation: By Smart Application
Figure 20 Market Segmentation: By Vertical
Figure 21 Market Segmentation: By Region
Figure 22 Market Drivers, Restraints, Opportunities, and Challenges
Figure 23 Market Value Chain Analysis
Figure 24 Strategic Benchmarking: Partnership, Collaboration, and Agreement is the Key Growth Strategy Adopted By Market Players
Figure 25 Narrowband IoT Market : Ecosystem
Figure 26 Real Time Streaming Analytics is Expected to Grow at the Highest Growth Rate in the Narrowband IoT Application Enterprise Market
Figure 27 Managed Services is Expected to Grow at the Highest Growth Rate in the Market
Figure 28 Energy and Utilities Vertical is Expected to Grow at the Highest Growth Rate in the Market
Figure 29 Smart Asset Tracking is Expected to Grow at the Highest Growth Rate in the Narrowband IoT Market
Figure 30 Smart Lighting is Expected to Grow at the Highest Growth Rate in the Market in Smart Governance Segment
Figure 31 Smart Water is Expected to Grow at the Highest Growth Rate in the Market
Figure 32 Smart Offices/Commercial Places is Expected to Grow at the Highest Growth Rate in the Narrowband IoT Market in Smart Building Segment
Figure 33 Narrowband IoT Market: Region Wise Adoption Scenario
Figure 34 The Market in Asia-Pacific is Expected to Grow at the Highest CAGR During the Forecast Period
Figure 35 North America: Connectivity Segment is Expected to Have the Largest Market Size During the Forecast Period (2017 - 2022)
Figure 36 Europe: Market Snapshot
Figure 37 Europe: Connectivity Segment is Expected to Have the Largest Market Size During the Forecast Period
Figure 38 Asia-Pacific: Market Snapshot
Figure 39 APAC: Connectivity Segment is Expected to Have the Largest Market Size During the Forecast Period
Figure 40 Middle East and Africa: Connectivity Segment is Expected to Have the Largest Market Size During the Forecast Period
Figure 41 Latin America: Connectivity Segment is Expected to Have the Largest Market Size During the Forecast Period
Figure 42 Companies Adopted the Strategy of Partnership, Agreement, and Collaboration as the Key Growth Strategy From 2015 to 2016
Figure 43 Battle for Market Share: Partnership, Agreement, and Collaboration Was the Key Strategy Adopted By Players in the Narrowband IoT Market During 2015�2016
Figure 44 Geographic Revenue Mix of Top 5 Market Players
Figure 45 AT&T, Inc.: Company Snapshot
Figure 46 AT&T, Inc.: SWOT Analysis
Figure 47 China Mobile Limited: Company Snapshot
Figure 48 China Mobile Limited: SWOT Analysis
Figure 49 Orange S.A: Company Snapshot
Figure 50 Orange S.A.: SWOT Analysis
Figure 51 SK Telecom Co., Ltd: Company Snapshot
Figure 52 SK Telecom Co., Ltd.: SWOT Analysis
Figure 53 Vodafone Group PLC: Company Snapshot
Figure 54 Vodafone Group PLC: SWOT Analysis
Figure 55 China Unicom: Company Snapshot
Figure 56 Deutsche Telekom AG: Company Snapshot
Figure 57 Etisalat: Company Snapshot
Figure 58 Telefonica SA: Company Snapshot
Figure 59 Telstra Corporation Limited: Company Snapshot


Growth opportunities and latent adjacency in Narrowband IoT (NB-IoT) Enterprise Application Market