Mycotoxin Testing Market

Mycotoxin Testing Market by Type (Aflatoxins, Ochratoxin, Fumonisins, Zearalenone, deoxynivalenol, Trichothecenes, Patulin), Technology (Chromatography- & Spectroscopy-Based, Immunoassay-Based), Sample (Feed & Food), and Region - Global Forecast to 2025

Market Segmentation

Report Metrics Details

Market size available for years

2020 - 2025

CAGR %

7.1

READ MORE...

Competitive Analysis

READ MORE...

Top 10 companies in Mycotoxin Testing Market

Report Code: FB 4948 Aug, 2020, by marketsandmarkets.com

[374 Pages Report] The global mycotoxin testing market size is estimated to account for USD 946 million in 2020 and is projected to reach USD 1,337 million by 2025, recording a CAGR of 7.1% during the forecast period. The market is driven by factors such as growing recalls and border rejections with growth in international food trade, stringent regulations across various countries, and changing climatic conditions. The high cost associated with the installation of technologies inhibits the growth of the mycotoxin testing market.

Mycotoxin Testing Market

To know about the assumptions considered for the study, Request for Free Sample Report

COVID-19 Impact on the Global Mycotoxin Testing Market

Covid-19 pandemic outbreak in various regions/countries, the mycotoxin testing market in 2020 is observed to witness a decline due to the lockdowns in various countries, a closure of international borders, and delays in cross border transits, which has led to supply chain hindrances.

COVID-19 has led to a drastic shift in consumer demand; from restaurants, food service, and other types of “food away from home” toward food consumed at home. This has led to many important changes in the way food supply chains operate. As the COVID-19 pandemic gathered pace, sales of “food away from home” (consumed in hotels, restaurants, catering and cafés) collapsed.

COVID-19 has led to disruptions in the food processing industry. Food companies in this industry have been affected by rules on social distancing, by labour shortages due to movement restrictions, and by lockdown measures to contain the spread of the virus. Also, measures taken by the regional governments has limited the number of people working in small areas; this also has affected the growth of the food industry, which, in turn, has led to a decline in the mycotoxin testing market growth. However, as these restrictions relax and as certification requirements on products gain more attention via consumers, the market for mycotoxin testing would witness a significant growth in the next five years.

Mycotoxin Testing Market Dynamics

Driver: Implementation of stringent regulations related to mycotoxin detection

Various government and regulatory bodies across the world have made testing of animal feed and food ingredients mandatory. The regulatory authorities do not approve animal feed for marketing, unless its safety and efficacy are proven. Such measures to prevent potential threats of contamination, chemicals, and toxic presence have been affecting the growth of the mycotoxin testing market greatly. To protect human and animal health, many countries have enacted specific regulations for mycotoxins in food and animal feed. Currently, more than 100 countries have formal mycotoxin regulations for food and feed. The mycotoxin regulations are the most stringent in the EU, where various organizations and pan-European networks contribute to combat the problems related to mycotoxin.

In May 2006, in Kenya, an outbreak of acute aflatoxicosis was reported, where aflatoxin contamination of homegrown corn has been a recurrent problem. CDC teams worked with the Kenyan Ministry of Health for the trial of a rapid, portable aflatoxin screening tool that could be used in the field to identify contaminated corn and guide urgent corn replacement efforts during an outbreak.

Restraint: Lack of food control systems, technology, infrastructure, and resources in developing countries

The mycotoxin testing markets in several developing regions lack organization, sophistication, and technology. The infrastructure of food control laboratories in many developing countries is likely to be scarce due to limited resources, limited technology, and poor management. There are numerous issues related to food safety such as lack of institutional coordination, outdated technology, less expertise for execution of regulation at low levels, and lack of updated standards; all these have been constraining the market for testing. Laboratories are poorly equipped and lack suitable trained analytical staff.

Countries such as India and China are getting government assistance for finance and developing the latest technologies. The concerned regulatory bodies of these developing countries need to apply their resources for the development of infrastructure and technology enhancement. The developing countries also lack support from international agencies such as FAO, WHO, and the World Bank. The foods that are being exported from these countries are expected to comply with Codex Alimentarius standards, which result in the best-quality food material leaving the country.

Corn in Nepal is prone to contamination by trichothecenes, nivalenol, and 4-deoxynivalenol; the farmers in Nepal manage to detoxify contaminated corn by hand-sorting the visibly diseased kernels. To reduce mycotoxin risks in corn in Nepal and other developing countries plant breeding techniques are required to produce ear rot-resistant cultivars, along with education in mycotoxin risks and testing procedures through portable kits in agricultural and grain storage practices to reduce mycotoxin contamination.

Opportunity: Expansion opportunities in emerging markets for mycotoxin testing

Increasing food trade across the borders of emerging markets increases the opportunity for the growth of the market. The increasing incidences of food-borne illnesses and improper sanitation & processing conditions in the factories in a few countries such as Indonesia strongly require the need for mycotoxin testing of food. China has been a potential food-importing & -exporting country; it is hence a key mycotoxin testing market. The inception of regulations in emerging economies that have entered the food trade, authorization of authorities to prohibit the import & supply of contaminated food and enforce food recalls, and nutrition labeling of foods are expected to increase the demand for testing services in these regions.

Moreover, growing cases of mycotoxicosis outbreaks from the emerging economies of Asia and Africa are projected to create high growth opportunities for the mycotoxin testing in these regions. The developing countries are chronically exposed to the high levels of aflatoxins, fumonisins, and trichothecenes, which cause carcinogenicity, immunotoxicity, and growth retardation in animals.

Several studies in Nigeria have reported toxin levels far above the limits allowed by international regulatory agencies in food and agricultural products. In addition, fatal outbreaks of toxicities, resulting particularly from aflatoxins, have been widely reported in Nigeria. There is an urgent need to address the food safety and international trade issues associated with mycotoxin contamination in Nigerian consumer goods and agricultural products, because there is a huge problem of mycotoxin contamination in developing countries such as Nigeria, where there exists a dearth of organized scientific information and data on the magnitude of the problem.

Challenge: Inappropriate sample collection & standardization

The food testing process has multiple stages, namely, raw material growing, procurement, processing, packaging, storage, and the supply chain. The exact number of samples required to be collected during testing is not yet standardized. Food and feed manufacturing or growing companies also face challenges in determining the appropriate sample size as this sample represents all the possible products in the food manufacturing value chain in sufficient quantity. A larger sample size would increase the chances of positive results. Mycotoxin testing laboratories do not receive a sufficient number of samples each time from their clients. This can be attributed to their customers’ lack of awareness about the quantity required for mycotoxin testing.

Standards regarding sample requirement are not published in a reliable reference form. Lack of information, in terms of sample standards, can cause several losses to testing labs. This lack of standardization in collecting samples has been affecting the end results; some testing labs have even lost their accreditation due to inappropriate results. Such issues have been restraining the growth of the mycotoxin testing market to some extent.

On the basis of type, the aflatoxin segment is projected to be the fastest-growing segment during the forecast period.

Aflatoxin has been the most widely tested toxin for various applications, including food and feed. Majority of the key players such as SGS (Switzerland), Bureau Veritas (France), Eurofins (Luxembourg), Intertek (UK) have been providing mycotoxin testing for aflatoxin. As aflatoxins are considered one of the most dangerous types among the group of mycotoxins present in food and feed. It is produced by the fungi–Aspergillus flavus and Aspergillus parasiticus. Amid COVID-19, the awareness among consumers for better-quality food and livestock-based products with improved sanitary measures and proper labelling is projected to drive the growth of market. This has lead to the fastes growth of aflatoxin segment in mycotoxin testing market.

The increasing awareness of health effects due to mycotoxin in cereals, grians & pulses has widened the scope of growth for the market.

Increasing prevelances of mycotoxin in cereals, grain and pulses has lead to largest market among other samples tested. Mycotoxins produced in the cereals and grains are either in fields brought on by Fusarium species or during storage by Penicillium species. Field fungi usually grow in warm and wet weather conditions and these instances increase when the harvest is delayed by wet weather. At the time of storage, fungi grow in grains and cereals when the moisture content is more than 14.5%. Ochratoxin A (OTA) is a mycotoxin produced by storage fungi when the moisture level is more than 18%.

Mycotoxin prevalence is a growing problem worldwide, as the fungi can grow in various climatic conditions. Thus, a proper testing of such contaminants at every stage of the supply chain is required to avoid foodborne diseases. Food manufacturers/growers are required to pay more attention to food quality and food safety testing to reduce the occurrence of food-borne diseases.

On the basis of technology, the chromatography- & spectroscopy-based technology segment is projected to witness the highest growth and largest share in the market.

Due to COVID-19, the demand for advanced technologies, such as chromatography, and spectrometry, will be growing, as they provide faster results than traditional methods, with accuracy in various markets, including mycotoxin testing. As consumers are becoming more cautious about the food that they are consuming, many food and feed manufacturers prefer to use techniques that give quick results as compared to the traditional methods, as it consumes more time and labor for the required result. Considering the current situation regarding the spread of the virus, results need to be quick to take further actions. Hence, it has lead chromatogrpagy & spectroscopy-based technology to grow at the fastest rate and hold the largest share in the mycotoxin testing industry.

Mycotoxin Testing Market  by Region

To know about the assumptions considered for the study, download the pdf brochure

Asia Pacific is projected to be the fastest growing region in the mycotoxin testing market.

The Asia Pacific region has the largest food manufacturing sector across the globe. The COVID-19 outbreak has increased the demand for mycotoxin testing in the region. As the origin of COVID-19 was in China, the products exported from this country will be prioritized for testing to avoid a further outbreak. Further, the growth in the market is attributed to the Chinese government striving to attain global compliance in food safety regulations & standards to enhance the growth of its export industry. The demand from North American and European countries will increase for food products. Therefore, the testing of these products while exporting will be important and result in the growth of the mycotoxin testing market in the Asian Pacific countries. In India, the Food Safety and Standards Authority of India (FSSAI) operates to safeguard the quality of food products consumed and exported across the world. The FSSAI regulates, frames, and supervises the supply chain of food safety testing. The export activity from the region is projected to grow after the COVID-19 outbreak  to match the disrupted supply chain across the world. Along with the growth in export activities, the market for testing may also grow at a higher pace in order to comply with the regulatory standards of the importing countries.

Key Market Players

Many domestic and global players provide mycotoxin testing to prevent food and feed outbreaks in human and livestock and to improve health. Major manufacturers have their presence in the European and Asian countries. The key companies in the global market are SGS (Switzerland), Bureau Veritas (France), Eurofins (Luxembourg), Intertek (UK), Mérieux NutriSciences (US), ALS Limited (Australia), Neogen (US). Various strategies, such as expansions, mergers & acquisitions, and new service launches, were adopted by the key companies to remain competitive in the feed mycotoxin testing market.

Get online access to the report on the World's First Market Intelligence Cloud

  • Easy to Download Historical Data & Forecast Numbers
  • Company Analysis Dashboard for high growth potential opportunities
  • Research Analyst Access for customization & queries
  • Competitor Analysis with Interactive dashboard
  • Latest News, Updates & Trend analysis
Request Sample

Scope of the Report

Report Metric

Details

Market size estimation

2016–2025

Base year considered

2019

Forecast period considered

2020–2025

Units considered

Value (USD)

Segments covered

Type, Sample, Technology, and Region

Regions covered

North America, Asia Pacific, Europe, and RoW

Companies studied

SGS (Switzerland), Bureau Veritas (France), Eurofins (Luxembourg), Intertek (UK), Mérieux NutriSciences (US), ALS Limited (Australia), Neogen (US) AsureQuality (New Zealand), Charm Sciences (US), Premier Analytical Services (UK), Dairyland Laboratories (US), Bio-Check (UK), AES Laboratories (India), IEH Laboratories and Consulting Group (US), Envirologix Inc. (US), EMSL Analytical, Inc. (US), and Krishgen Biosystems (US), (Total 25 companies)

This research report categorizes the mycotoxin testing market based on type, sample, technology, and region.

On the basis of type, the market has been segmented as follows:

  • Aflatoxin
  • Deoxynivalenol
  • Ochratoxins
  • Fumonisins
  • Trichothecene
  • Zearalenone
  • Patulin
  • Others

On the basis of samle, the market has been segmented as follows:

  • Food
    • Cereals, grains, and pulses
    • Milk and milk products
    • Meat, poultry, and seafood
    • Nuts, seeds, and spices
    • Fruits and vegetables
    • Others
  • Feed
    • Cereals and cereal by-products
    • Seeds and seed products
    • Forage and silage
    • Others

On the basis of technology, the market has been segmented as follows:

  • Chromatography- & spectroscopy-based
  • Immunoassay-based

On the basis of region, the market has been segmented as follows:

  • North America
  • Europe
  • Asia Pacific
  • RoW (Brazil, Argentian, South Africa and the Middle East)

Recent Developments

  • In October 2019, SGS announced the expansion of its new food microbiological testing lab in Fairfield, New Jersey, US. The 2,000 sq. ft. microbiological testing facility utilizes a information technology platform to offer food producers, manufacturers and suppliers with a broad spectrum of testing services across every food category.
  • In March 2019, SGS announced the expansion of its new food microbiological testing lab in Carson, California, US. The microbiological testing facility is of 2,400 sq. ft. This expansion is aimed at expanding geographical coverage and its global network of agriculture and food labs.

Frequently Asked Questions (FAQ):

To speak to our analyst for a discussion on the above findings, click Speak to Analyst

TABLE OF CONTENTS

1 INTRODUCTION (Page No. - 51)
    1.1 OBJECTIVES OF THE STUDY
    1.2 MARKET DEFINITION
    1.3 MARKET SCOPE
           1.3.1 MARKETS COVERED
                 FIGURE 1 MARKET SEGMENTATION
           1.3.2 REGIONS COVERED
           1.3.3 YEARS CONSIDERED FOR THE STUDY
    1.4 CURRENCY
        TABLE 1 US DOLLAR EXCHANGE RATES CONSIDERED FOR THE STUDY, 2015–2017
    1.5 STAKEHOLDERS
    1.6 SUMMARY OF CHANGES

2 RESEARCH METHODOLOGY (Page No. - 55)
    2.1 RESEARCH DATA
        FIGURE 2 MARKET RESEARCH DESIGN
           2.1.1 SECONDARY DATA
           2.1.2 PRIMARY DATA
                    2.1.2.1 Key industry insights
                    2.1.2.2 Breakdown of Primaries
    2.2 MARKET SIZE ESTIMATION
           2.2.1 BOTTOM-UP APPROACH
                 FIGURE 3 MYCOTOXIN TESTING MARKET: BOTTOM-UP APPROACH
           2.2.2 TOP-DOWN APPROACH
                 FIGURE 4 MYCOTOXIN TESTING MARKET: TOP-DOWN APPROACH
    2.3 DATA TRIANGULATION
        FIGURE 5 MARKET BREAKDOWN AND DATA TRIANGULATION
    2.4 RESEARCH ASSUMPTIONS
    2.5 RESEARCH LIMITATIONS

3 EXECUTIVE SUMMARY (Page No. - 63)
  FIGURE 6 MYCOTOXIN TESTING MARKET, BY TYPE, 2020 VS. 2025 (USD MILLION)
  FIGURE 7 MARKET, BY SAMPLE, 2020 VS. 2025 (USD MILLION)
  FIGURE 8 MARKET, BY TECHNOLOGY, 2020 VS. 2025 (VALUE SHARE)
  FIGURE 9 ASIA PACIFIC PROJECTED TO GROW AT THE HIGHEST CAGR IN THE MYCOTOXIN TESTING MARKET DURING THE FORECAST PERIOD
  FIGURE 10MARKET SHARE, BY REGION, 2020

4 PREMIUM INSIGHTS (Page No. - 68)
    4.1 OPPORTUNITIES IN THE MYCOTOXIN TESTING MARKET
        FIGURE 11 CHANGING CLIMATIC CONDITIONS TO DRIVE THE GROWTH OF THE MYCOTOXIN TESTING MARKET
    4.2 MYCOTOXIN TESTING MARKET: KEY COUNTRIES, 2020
        FIGURE 12 THE US DOMINATED THE MYCOTOXIN TESTING MARKET IN 2020
    4.3 MYCOTOXIN TESTING MARKET, BY TYPE & REGION, 2020
        FIGURE 13 EUROPEAN REGION TO DOMINATE THE MARKET IN 2020
    4.4 MYCOTOXIN TESTING MARKET, BY TECHNOLOGY, 2020
        FIGURE 14 CHROMATOGRAPHY- & SPECTROSCOPY-BASED TECHNOLOGIES DOMINATED THE MARKET ACROSS ALL TECHNOLOGIES IN 2020
    4.5 NORTH AMERICA: MYCOTOXIN TESTING MARKET,  BY SAMPLE & COUNTRY, 2020
        FIGURE 15 THE US MARKET IS ESTIMATED FOR THE LARGEST SHARE IN 2020

5 MARKET OVERVIEW (Page No. - 71)
    5.1 INTRODUCTION
        TABLE 2 TOXIC EFFECTS OF MYCOTOXINS
    5.2 PATENT ANALYSIS
        TABLE 3 PATENTS PERTAINING TO MYCOTOXIN TESTING
    5.3 MARKET DYNAMICS
        FIGURE 16 MARKET DYNAMICS
           5.3.1 DRIVERS
                    5.3.1.1 Implementation of stringent regulations related to mycotoxin detection
                    5.3.1.2 Growth in international trade
                            FIGURE 17 WORLD FOOD AND AGRICULTURAL PRODUCT EXPORT AND IMPORT, 1995–2016 (USD BILLION)
                            FIGURE 18 GLOBAL FOOD EXPORTS, BY CATEGORY, 2016 (USD MILLION)
                            FIGURE 19 US: PERCENTAGE OF AGRICULTURAL COMMODITIES EXPORTED OUT OF TOTAL PRODUCTION, 2017–2018
                    5.3.1.3 Growth in consumer awareness
                               5.3.1.3.1 Growth in the number of recalls and border rejections
                                         TABLE 4 BORDER REJECTION CASES AGAINST MYCOTOXIN CONTAMINATED FOODS IN EUROPE, 2018–2019
                    5.3.1.4 Humid atmospheric conditions leading to an increase in mycotoxins
                            TABLE 5 OPTIMAL TEMPERATURE CONDITIONS FOR VARIOUS MYCOTOXINS
                            TABLE 6 FAVORABLE WEATHER AND STORAGE CONDITIONS FOR MYCOTOXINS
           5.3.2 RESTRAINTS
                    5.3.2.1 Lack of food control systems, technology, infrastructure, and resources in developing countries
                    5.3.2.2 High capital investment
           5.3.3 OPPORTUNITIES
                    5.3.3.1 Expansion opportunities in emerging markets for mycotoxin testing
                            TABLE 7 MYCOTOXIN OUTBREAKS IN DEVELOPING COUNTRIES
                    5.3.3.2 Launch of advanced technologies for detecting mycotoxins
                            TABLE 8 THE RECENT EVOLUTION IN DETECTION METHODS
                            TABLE 9 MYCOTOXIN DETECTION LIMITS, ELISA VS. LC-MS/MS
                               5.3.3.2.1 Co-occurrence of mycotoxins
                                         FIGURE 20 CO-CONTAMINATION OF MYCOTOXINS, 2018
                               5.3.3.2.2 Launch of economic multi-toxin analysis systems
                    5.3.3.3 Increase in demand for cereal products and oats to offer high growth opportunities for mycotoxin testing
                            FIGURE 21 GLOBAL CEREAL CONSUMPTION, 2014–2018 (MILLION TONNE)
                    5.3.3.4 Emerging mycotoxins
           5.3.4 CHALLENGES
                    5.3.4.1 Inappropriate sample collection & standardization
    5.4 COVID-19 PANDEMIC IMPACT
        FIGURE 22 CHART OF PRE- & POST-COVID SCENARIO IN THE MYCOTOXIN TESTING MARKET

6 REGULATIONS (Page No. - 96)
    6.1 INTRODUCTION
        FIGURE 23 MYCOTOXIN OCCURRENCE IN FOOD AND FEED SUPPLY CHAIN
        TABLE 10 AFM1 REGULATORY LIMITS FOR DAIRY PRODUCTS
           6.1.1 FACTORS AFFECTING THE CONSTITUTION OF MYCOTOXIN REGULATIONS IN FOOD AND FEED
    6.2 INTERNATIONAL BODY FOR FOOD SAFETY STANDARDS AND REGULATIONS
           6.2.1 CODEX ALIMENTARIUS COMMISSION (CAC)
    6.3 GLOBAL FOOD SAFETY INITIATIVE (GFSI)
    6.4 NORTH AMERICA
           6.4.1 US REGULATIONS
                    6.4.1.1 Codex alimentarius
                    6.4.1.2 Federal legislation
                               6.4.1.2.1 State legislation
                               6.4.1.2.2 Food safety in retail food
                               6.4.1.2.3 HACCP regulation in the US
                               6.4.1.2.4 Food safety regulations for fruit & vegetable growers
                               6.4.1.2.5 Federal food, drug, and cosmetic act (FFDCA)
                               6.4.1.2.6 US Food and drug administration(FDA)
                               6.4.1.2.7 United states grain standards act
                               6.4.1.2.8 The toxic substances control act of 1976
                                         TABLE 11 AFLATOXIN B1 & M1 REGULATORY LIMITS FOR FOOD AND FEED IN THE US
                                         TABLE 12 DEOXYNIVALENOL REGULATORY LIMITS FOR FOOD AND FEED IN THE US
                                         TABLE 13 FUMONISIN B1, B2, AND B3 REGULATORY LIMITS FOR FOOD AND FEED IN THE US
           6.4.2 CANADA
                    6.4.2.1 Canadian Food Inspection Agency (CFIA)
                    6.4.2.2 Canadian Grain Commission
                    6.4.2.3 Agriculture and Agri-Food Canada
                    6.4.2.4 International Food Chemical Safety Liaison Group (IFCSLG)
                    6.4.2.5 Codex Committee on Contaminants in Food (CCCF)
           6.4.3 MEXICO
    6.5 EUROPE
           6.5.1 EUROPEAN UNION REGULATIONS
                 TABLE 14 AFLATOXIN B1 & M1 REGULATORY LIMITS FOR FOOD AND FEED IN THE EUROPEAN UNION
                 TABLE 15 FUMONISIN B1 & B2 REGULATORY LIMITS FOR FOOD AND FEED IN THE EUROPEAN UNION
                 TABLE 16 OCHRATOXIN REGULATORY LIMITS FOR FOOD AND FEED IN THE EUROPEAN UNION
                 TABLE 17 CITRININ, PATULIN, AND TROPANE ALKALOIDS REGULATORY LIMITS FOR FOOD IN THE EUROPEAN UNION
                 TABLE 18 ZEARALENONE REGULATORY LIMITS FOR FOOD AND FEED IN THE EUROPEAN UNION
                 TABLE 19 T-2 & HT-2 REGULATORY LIMITS FOR FOOD AND FEED IN THE EUROPEAN UNION
                 TABLE 20 DEOXYNIVALENOL REGULATORY LIMITS FOR FOOD AND FEED IN THE EUROPEAN UNION
                    6.5.1.1 Concerning European Union Reference Laboratories
                    6.5.1.2 General Food Law for Mycotoxin
                    6.5.1.3 Concerning Mycotoxins in Feed
                    6.5.1.4 Concerning Mycotoxins in Food
                    6.5.1.5 Concerning Mycotoxins in Food of Animal Origin
                    6.5.1.6 Commission Rules (Imposing Special Conditions)
                    6.5.1.7 Other Mycotoxin-related Legislation
                    6.5.1.8 The European Union
                    6.5.1.9 Toxins Regulations
                               6.5.1.9.1 Ochratoxin A
                                         TABLE 21 COMMISSION REGULATION FOR OCHRATOXIN A
                               6.5.1.9.2 Fusarium Toxins
                               6.5.1.9.3 Aflatoxins
           6.5.2 GERMANY
           6.5.3 UK
    6.6 ASIA PACIFIC
        TABLE 22 AFLATOXIN B1 & M1 REGULATORY LIMITS FOR FOOD AND FEED IN JAPAN
        TABLE 23 DEOXYNIVALENOL REGULATORY LIMITS FOR FOOD AND FEED IN JAPAN
        TABLE 24 AFLATOXIN B1 & M1 REGULATORY LIMITS FOR FOOD AND FEED IN INDONESIA
        TABLE 25 MYCOTOXIN REGULATORY LIMITS FOR FOOD IN INDONESIA
        TABLE 26 MYCOTOXIN REGULATORY LIMITS FOR FOOD IN MALAYSIA
        TABLE 27 MYCOTOXIN REGULATORY LIMITS FOR FOOD IN SOUTH KOREA
           6.6.1 CHINA
                 TABLE 28 AFLATOXIN B1 & M1 REGULATORY LIMITS FOR FOOD AND FEED IN CHINA
                 TABLE 29 DEOXYNIVALENOL REGULATORY LIMITS FOR FOOD AND FEED IN CHINA
                 TABLE 30 OCHRATOXIN REGULATORY LIMITS FOR FOOD AND FEED IN CHINA
                 TABLE 31 ZEARALENONE REGULATORY LIMITS FOR FOOD AND FEED IN CHINA
           6.6.2 INDIA
                    6.6.2.1 Food Safety and Standards Act, 2006
                    6.6.2.2 Food Safety Standards Amendment Regulations, 2011
                    6.6.2.3 Food Safety Standards Amendment Regulations, 2012
           6.6.3 AUSTRALIA
                    6.6.3.1 Food Standards Australia New Zealand
           6.6.4 NEW ZEALAND
    6.7 SOUTH AMERICA

7 MYCOTOXIN TESTING MARKET, BY TYPE (Page No. - 122)
    7.1 INTRODUCTION
        TABLE 32 MYCOTOXINS: OCCURRENCE, SOURCE, AND HEALTH EFFECTS
        FIGURE 24 MARKET SIZE FOR MYCOTOXIN TESTING, BY TYPE, 2020 VS. 2025 (USD MILLION)
        TABLE 33 MARKET SIZE FOR MYCOTOXIN TESTING, BY TYPE, 2016–2019 (USD MILLION)
        TABLE 34 MARKET SIZE FOR MYCOTOXIN TESTING, BY TYPE, 2020–2025 (USD MILLION)
        TABLE 35 FOOD: MARKET SIZE FOR MYCOTOXIN TESTING, BY TYPE, 2016–2019 (USD MILLION)
        TABLE 36 FOOD: MARKET SIZE FOR MYCOTOXIN TESTING, BY TYPE, 2020-2025 (USD MILLION)
        TABLE 37 FEED: MARKET SIZE FOR MYCOTOXIN TESTING, BY TYPE, 2016–2019 (USD THOUSANDS)
        TABLE 38 FEED: MYCOTOXIN TESTING MARKET SIZE, BY TYPE, 2020-2025 (USD THOUSANDS)
    7.2 AFLATOXINS
           7.2.1 THE PRESENCE OF AFLATOXIN DESTROYS 25% OF THE WORLD’S FOOD CROPS
                 TABLE 39 FDA ACTION LEVELS FOR AFLATOXINS
                 TABLE 40 AFLATOXINS: MARKET SIZE FOR MYCOTOXIN TESTING, BY REGION, 2016–2019 (USD MILLION)
                 TABLE 41 AFLATOXINS: MARKET SIZE FOR MYCOTOXIN TESTING, BY REGION, 2020–2025 (USD MILLION)
                 TABLE 42 FOOD: AFLATOXINS TESTING MARKET SIZE, BY REGION, 2016–2019 (USD MILLION)
                 TABLE 43 FOOD: AFLATOXINS TESTING MARKET SIZE, BY REGION, 2020-2025 (USD MILLION)
                 TABLE 44 FEED: AFLATOXINS TESTING MARKET SIZE, BY REGION, 2016–2019 (USD THOUSANDS)
                 TABLE 45 FEED: AFLATOXINS TESTING MARKET SIZE, BY REGION,  2020-2025 (USD THOUSANDS)
    7.3 OCHRATOXINS
           7.3.1 OCHRATOXINS CAN BE DETECTED USING THE LIQUID CHROMATOGRAPHY & MASS SPECTROMETRY TECHNIQUES
                 TABLE 46 AVERAGE CONCENTRATIONS FOR OCHRATOXIN A IN DIFFERENT FOOD PRODUCTS
                 TABLE 47 OCHRATOXIN: MARKET SIZE FOR MYCOTOXIN TESTING, BY REGION, 2016–2019 (USD MILLION)
                 TABLE 48 OCHRATOXIN: MARKET SIZE FOR MYCOTOXIN TESTING, BY REGION,  2020–2025 (USD MILLION)
                 TABLE 49 FOOD: OCHRATOXIN TESTING MARKET SIZE, BY REGION, 2016–2019 (USD MILLION)
                 TABLE 50 FOOD: OCHRATOXIN TESTING MARKET SIZE, BY REGION, 2020-2025 (USD MILLION)
                 TABLE 51 FEED: OCHRATOXIN TESTING MARKET SIZE, BY REGION, 2016–2019 (USD THOUSANDS)
                 TABLE 52 FEED: OCHRATOXIN TESTING MARKET SIZE, BY REGION, 2020-2025 (USD THOUSANDS)
    7.4 FUMONISINS
           7.4.1 THE PRESENCE OF FUMONISINS IS DETECTED USING THE PATHOGEN IDENTIFICATION REAL TIME (PCR) METHOD
                 TABLE 53 FUMONISINS: MARKET SIZE FOR MYCOTOXIN TESTING, BY REGION, 2016–2019 (USD MILLION)
                 TABLE 54 FUMONISINS: MARKET SIZE FOR MYCOTOXIN TESTING, BY REGION, 2020–2025 (USD MILLION)
                 TABLE 55 FOOD: FUMONISINS TESTING MARKET SIZE, BY REGION, 2016–2019 (USD MILLION)
                 TABLE 56 FOOD: FUMONISINS TESTING MARKET SIZE, BY REGION, 2020-2025 (USD MILLION)
                 TABLE 57 FEED: FUMONISINS TESTING MARKET SIZE, BY REGION, 2016–2019 (USD THOUSANDS)
                 TABLE 58 FEED: FUMONISINS TESTING MARKET SIZE, BY REGION, 2020-2025 (USD THOUSANDS)
    7.5 DEOXYNIVALENOL
           7.5.1 SWINE IS THE MOST COMMONLY AFFECTED LIVESTOCK DUE TO DEOXYNIVALENOL
                 TABLE 59 DEOXYNIVALENOL REGULATORY LIMITS
                 TABLE 60 DEOXYNIVALENOL: MARKET SIZE FOR MYCOTOXIN TESTING, BY REGION, 2016–2019 (USD MILLION)
                 TABLE 61 DEOXYNIVALENOL: MARKET SIZE FOR MYCOTOXIN TESTING, BY REGION, 2020–2025 (USD MILLION)
                 TABLE 62 FOOD: DEOXYNIVALENOL TESTING MARKET SIZE, BY REGION, 2016–2019 (USD MILLION)
                 TABLE 63 FOOD: DEOXYNIVALENOL TESTING MARKET SIZE, BY REGION, 2020-2025 (USD MILLION)
                 TABLE 64 FEED: DEOXYNIVALENOL TESTING MARKET SIZE, BY REGION, 2016–2019 (USD THOUSANDS)
                 TABLE 65 FEED: DEOXYNIVALENOL TESTING MARKET SIZE, BY REGION, 2020-2025 (USD THOUSANDS)
    7.6 TRICHOTHECENES
           7.6.1 TRICHOTHECENES NATURALLY OCCUR IN NORTH AMERICA, AFRICA, SOUTH AMERICA, AND EUROPE
                 TABLE 66 TRICHOTHECENES: MARKET SIZE FOR MYCOTOXIN TESTING, BY REGION,  2016–2019 (USD MILLION)
                 TABLE 67 TRICHOTHECENES: MARKET SIZE FOR MYCOTOXIN TESTING, BY REGION,   2020–2025 (USD MILLION)
                 TABLE 68 FOOD: TRICHOTHECENES TESTING MARKET SIZE, BY REGION, 2016–2019 (USD MILLION)
                 TABLE 69 FOOD: TRICHOTHECENES TESTING MARKET SIZE, BY REGION, 2020-2025 (USD MILLION)
                 TABLE 70 FEED: TRICHOTHECENES TESTING MARKET SIZE, BY REGION,   2016–2019 (USD THOUSANDS)
                 TABLE 71 FEED: TRICHOTHECENES TESTING MARKET SIZE, BY REGION,  2020-2025 (USD THOUSANDS)
    7.7 ZEARALENONE
           7.7.1 ZEARALENONE IS FOUND TO MOST COMMONLY AFFECT CORN AND ITS BY-PRODUCTS
                 TABLE 72 ZEARALENONE: MARKET SIZE FOR MYCOTOXIN TESTING, BY REGION,   2016–2019 (USD MILLION)
                 TABLE 73 ZEARALENONE: MARKET SIZE FOR MYCOTOXIN TESTING, BY REGION, 2020–2025 (USD MILLION)
                 TABLE 74 FOOD: ZEARALENONE TESTING MARKET SIZE, BY REGION,  2016–2019 (USD MILLION)
                 TABLE 75 FOOD: ZEARALENONE TESTING MARKET SIZE, BY REGION, 2020-2025 (USD MILLION)
                 TABLE 76 FEED: ZEARALENONE TESTING MARKET SIZE, BY REGION, 2016–2019 (USD THOUSANDS)
                 TABLE 77 FEED: ZEARALENONE TESTING MARKET SIZE, BY REGION, 2020-2025 (USD THOUSANDS)
    7.8 PATULIN
           7.8.1 THE USAGE OF NON-THERMAL PROCESSING TECHNIQUES HELPS TO REMOVE PATULIN FROM FOOD PRODUCTS
                 TABLE 78 PATULIN: MYCOTOXIN TESTING MARKET SIZE, BY REGION, 2016–2019 (USD MILLION)
                 TABLE 79 PATULIN: MARKET SIZE FOR MYCOTOXIN TESTING, BY REGION, 2020–2025 (USD MILLION)
                 TABLE 80 FOOD: PATULIN TESTING MARKET SIZE, BY REGION, 2016–2019 (USD MILLION)
                 TABLE 81 FOOD: PATULIN TESTING MARKET SIZE, BY REGION, 2020-2025 (USD MILLION)
                 TABLE 82 FEED: PATULIN TESTING MARKET SIZE, BY REGION, 2016–2019 (USD THOUSANDS)
                 TABLE 83 FEED: PATULIN TESTING MARKET SIZE, BY REGION,  2020-2025 (USD THOUSANDS)
    7.9 OTHERS
           7.9.1 DIFFERENT GENERA OF ASPERGILLUS PRODUCING CYCLOPIAZONIC ACID AND CITRININ
                 TABLE 84 OTHERS: MARKET SIZE FOR MYCOTOXIN TESTING, BY REGION, 2016–2019 (USD MILLION)
                 TABLE 85 OTHERS: MARKET SIZE FOR MYCOTOXIN TESTING, BY REGION, 2020–2025 (USD MILLION)
                 TABLE 86 FOOD: OTHERS TESTING MARKET SIZE, BY REGION, 2016–2019 (USD MILLION)
                 TABLE 87 FOOD: OTHERS TESTING MARKET SIZE, BY REGION, 2020-2025 (USD MILLION)
                 TABLE 88 FEED: OTHERS TESTING MARKET SIZE, BY REGION,  2016–2019 (USD THOUSANDS)
                 TABLE 89 FEED: OTHERS TESTING MARKET SIZE, BY REGION, 2020-2025 (USD THOUSANDS)

8 MYCOTOXIN TESTING MARKET, BY SAMPLE (Page No. - 148)
    8.1 INTRODUCTION
    8.2 OPERATIONAL DRIVERS
           8.2.1 STRINGENT FOOD SAFETY REGULATIONS
           8.2.2 GLOBALIZATION OF FOOD TRADE
                 FIGURE 25 MYCOTOXIN TESTING MARKET, BY SAMPLE, 2020 VS. 2025 (USD MILLION)
                 TABLE 90 MARKET SIZE FOR MYCOTOXIN TESTING, BY SAMPLE, 2016–2019 (USD MILLION)
                 TABLE 91 MARKET SIZE FOR MYCOTOXIN TESTING, BY SAMPLE, 2020–2025 (USD MILLION)
    8.3 FOOD
        TABLE 92 MARKET SIZE IN FOOD, BY FOOD TYPE, 2016–2019 (USD MILLION)
        TABLE 93 MARKET SIZE IN FOOD, BY FOOD TYPE, 2020–2025 (USD MILLION)
        TABLE 94 MARKET SIZE IN FOOD, BY REGION, 2016–2019 (USD MILLION)
        TABLE 95 MARKET SIZE IN FOOD, BY REGION,  2020–2025 (USD MILLION)
           8.3.1 CEREALS, GRAINS, AND PULSES
                    8.3.1.1 Cereals are more prevalent for mycotoxin contamination during the stage of vegetation or storage
                            TABLE 96 MYCOTOXINS IN STAPLE CEREALS AND GRAINS
                            TABLE 97 LEGAL LIMITS FOR MYCOTOXINS IN GRAINS INTENDED FOR HUMAN CONSUMPTION
                            TABLE 98 MARKET SIZE IN CEREALS & GRAINS, BY REGION,  2016–2019 (USD MILLION)
                            TABLE 99 MARKET SIZE IN CEREALS & GRAINS, BY REGION,  2020–2025 (USD MILLION)
           8.3.2 MILK AND MILK PRODUCTS
                    8.3.2.1 Permissible limit for aflatoxin M1 in milk and milk products lies in the range of 0 and 0.5 ppb
                            TABLE 100 INTERNATIONAL LIMITS FOR AFM1 IN DAIRY PRODUCTS FOR HUMAN CONSUMPTION
                            TABLE 101 MARKET SIZE IN MILK AND MILK PRODUCTS, BY REGION,  2016–2019 (USD MILLION)
                            TABLE 102 MARKET SIZE IN MILK AND MILK PRODUCTS, BY REGION,  2020–2025 (USD MILLION)
           8.3.3 MEAT, POULTRY, AND SEAFOOD
                    8.3.3.1 Commonly occurring mycotoxins in poultry are aflatoxins, ochratoxins, trichothecenes, and fumonisins
                            TABLE 103 MYCOTOXIN TESTING MARKET SIZE IN MEAT, POULTRY, AND SEAFOOD, BY REGION, 2016–2019 (USD MILLION)
                            TABLE 104 MARKET SIZE IN MEAT, POULTRY, AND SEAFOOD, BY REGION, 2020–2025 (USD MILLION)
           8.3.4 NUTS, SEEDS, AND SPICES
                    8.3.4.1 Thin Layer Chromatography (TLC) is widely adopted to detect the presence of mycotoxins in nuts
                            TABLE 105 MARKET SIZE IN NUTS, SEEDS, AND SPICES, BY REGION,  2016–2019 (USD MILLION)
                            TABLE 106 MARKET SIZE IN NUTS, SEEDS, AND SPICES,  BY REGION,  2020–2025 (USD MILLION)
           8.3.5 FRUITS & VEGE                            TABLES
                    8.3.5.1 Food technologists use ozone for aflatoxin decontamination in fruits and vegetables
                            TABLE 107 MARKET SIZE IN FRUITS AND VEGETABLES, BY REGION,  2016–2019 (USD MILLION)
                            TABLE 108 MARKET SIZE IN FRUITS AND VEGETABLES, BY REGION,  2020–2025 (USD MILLION)
           8.3.6 OTHERS
                    8.3.6.1 Mycotoxin residues are commonly found in food additives despite undergoing heavy processing
                            TABLE 109 MARKET SIZE IN OTHER FOOD TYPES, BY REGION,  2016–2019 (USD MILLION)
                            TABLE 110 MARKET SIZE IN OTHER FOOD TYPES, BY REGION,  2020–2025 (USD MILLION)
    8.4 FEED
        TABLE 111 MARKET IN FEED, BY FEED TYPE, 2016–2019 (USD MILLION)
        TABLE 112 MARKET IN FEED, BY FEED TYPE, 2020–2025 (USD MILLION)
        TABLE 113 MYCOTOXIN TESTING MARKET IN FEED, BY REGION, 2016–2019 (USD MILLION)
        TABLE 114 MARKET IN FEED, BY REGION, 2020–2025 (USD MILLION)
           8.4.1 CEREALS & CEREAL BY-PRODUCTS
                    8.4.1.1 Mycotoxin detection in the feed is conducted by using high-end technologies such as GC and LC-MS/GC-MS
                            TABLE 115 LEGAL LIMITS FOR MYCOTOXINS IN GRAIN INTENDED FOR FEED
                            TABLE 116 FEED: FDA GUIDELINES & HEALTH EFFECTS OF MYCOTOXINS IN CEREALS &  CEREAL BY-PRODUCTS
                            TABLE 117 MARKET IN CEREALS, AND CEREAL BY-PRODUCTS, BY REGION 2016–2019 (USD MILLION)
                            TABLE 118 MARKET IN CEREALS, AND CEREAL BY-PRODUCTS, BY REGION 2020–2025 (USD MILLION)
           8.4.2 SEEDS & SEED PRODUCTS
                    8.4.2.1 Oilseed meals form 20-30% of the poultry diet
                            TABLE 119 FEED: FDA GUIDELINES & HEALTH EFFECTS FOR AFLATOXIN IN COTTONSEED MEAL
                            TABLE 120 MYCOTOXIN TESTING MARKET IN SEED AND SEED PRODUCTS, BY REGION,  2016–2019 (USD MILLION)
                            TABLE 121 MARKET IN SEED AND SEED PRODUCTS, BY REGION,  2020–2025 (USD MILLION)
           8.4.3 FORAGE AND SILAGE
                    8.4.3.1 Storage fungi are more prevalent to contaminate forage  and silage
                            TABLE 122 MARKET IN FORAGE AND SILAGE, BY REGION  2016–2019 (USD MILLION)
                            TABLE 123 MARKET IN FORAGE AND SILAGE, BY REGION  2020–2025 (USD MILLION)
           8.4.4 OTHERS
                    8.4.4.1 LC-MS and ELISA are the most commonly used technologies in the detection and quantification of mycotoxins in feed
                            TABLE 124 MARKET IN OTHER FEED TYPES, BY REGION, 2016–2019 (USD MILLION)
                            TABLE 125 MYCOTOXIN TESTING MARKET IN OTHER FEED TYPES, BY REGION,  2020–2025 (USD MILLION)
    8.5 IMPACT OF COVID-19 ON SAMPLE APPLICATION
           8.5.1 FOOD: HIGHLY-IMPACTED APPLICATION INDUSTRY
           8.5.2 FEED: LEAST-IMPACTED APPLICATION INDUSTRY

9 MYCOTOXIN TESTING MARKET, BY TECHNOLOGY (Page No. - 169)
    9.1 INTRODUCTION
        FIGURE 26 MYCOTOXIN TESTING MARKET SIZE, BY TECHNOLOGY, 2020 VS. 2025 (USD MILLION)
        TABLE 126 MARKET SIZE FOR MYCOTOXIN TESTING, BY TECHNOLOGY,  2016–2019 (USD MILLION)
        TABLE 127 MARKET SIZE FOR MYCOTOXIN TESTING, BY TECHNOLOGY, 2020–2025 (USD MILLION)
        FIGURE 27 MARKET SIZE FOR MYCOTOXIN TESTING, BY CHROMATOGRAPHY-& SPECTROSCOPY- BASED TECHNOLOGY, 2020 VS. 2025 (USD MILLION)
        TABLE 128 MARKET SIZE FOR MYCOTOXIN TESTING, BY CHROMATOGRAPHY-& SPECTROSCOPY- BASED TECHNOLOGY, 2016–2019 (USD MILLION)
        TABLE 129 MARKET SIZE FOR MYCOTOXIN TESTING, BY CHROMATOGRAPHY-& SPECTROSCOPY- BASED TECHNOLOGY, 2020-2025 (USD MILLION)
    9.2 CHROMATOGRAPHY- & SPECTROSCOPY-BASED
        TABLE 130 CHROMATOGRAPHY- & SPECTROSCOPY-BASED: MYCOTOXIN TESTING MARKET SIZE,  BY REGION, 2016–2019 (USD MILLION)
        TABLE 131 CHROMATOGRAPHY- & SPECTROSCOPY-BASED: MYCOTOXIN TESTING MARKET SIZE,  BY REGION, 2020–2025 (USD MILLION)
           9.2.1 HIGH PERFORMANCE LIQUID CHROMATOGRAPHY (HPLC)
                    9.2.1.1 Cost-effectiveness of HPLC is driving the growth of this segment in the market
                            TABLE 132 HIGH PERFORMANCE LIQUID CHROMATOGRAPHY (HPLC): MARKET SIZE FOR MYCOTOXIN TESTING, BY REGION, 2016–2019 (USD MILLION)
                            TABLE 133 HIGH PERFORMANCE LIQUID CHROMATOGRAPHY (HPLC): MARKET SIZE FOR MYCOTOXIN TESTING, BY REGION, 2020–2025 (USD MILLION)
           9.2.2 OTHERS
                    9.2.2.1 Gas chromatography and mass spectrometry techniques help in the identification of compounds with low detection limits
                               9.2.2.1.1 Gas chromatography
                               9.2.2.1.2 Liquid chromatography
                               9.2.2.1.3 Coupled chromatography
                               9.2.2.1.4 Tandem spectrometry
                                         TABLE 134 OTHERS: MARKET SIZE FOR MYCOTOXIN TESTING, BY REGION, 2016–2019 (USD MILLION)
                                         TABLE 135 OTHERS: MARKET SIZE FOR MYCOTOXIN TESTING, BY REGION, 2020–2025 (USD MILLION)
    9.3 IMMUNOASSAY-BASED
           9.3.1 ELISA TECHNIQUE IS MAJORLY USED IN THE DETECTION OF AFLATOXINS IN FOOD PRODUCTS AND OCHRATOXINS IN BABY FOOD
                 TABLE 136 IMMUNOASSAY-BASED: MYCOTOXIN TESTING MARKET SIZE, BY REGION,  2016–2019 (USD MILLION)
                 TABLE 137 IMMUNOASSAY-BASED: MARKET SIZE FOR MYCOTOXIN TESTING, BY REGION,  2020-2025 (USD MILLION)

10 MYCOTOXIN TESTING MARKET, BY REGION (Page No. - 179)
     10.1 INTRODUCTION
     10.2 REGIONAL OPERATIONAL DRIVERS
             10.2.1 INCREASE IN CONSUMER AWARENESS TOWARD PRODUCT CERTIFICATION
             10.2.2 ADOPTION OF STRICT REGION-SPECIFIC REGULATIONS
                        10.2.2.1 Europe
                        10.2.2.2 Asia Pacific
                        10.2.2.3 US
                                 FIGURE 28 CHINA TO RECORD THE FASTEST GROWTH RATE DURING THE FORECAST PERIOD IN THE MYCOTOXIN TESTING MARKET
                                 TABLE 138 MARKET SIZE FOR MYCOTOXIN TESTING, BY REGION, 2016–2019 (USD MILLION)
                                 TABLE 139 MARKET SIZE FOR MYCOTOXIN TESTING, BY REGION, 2020–2025 (USD MILLION)
                                 TABLE 140 FOOD MYCOTOXIN TESTING MARKET SIZE, BY REGION, 2016–2019 (USD MILLION)
                                 TABLE 141 FOOD MYCOTOXIN TESTING MARKET SIZE, BY REGION, 2020–2025 (USD MILLION)
                                 TABLE 142 FEED MYCOTOXIN TESTING MARKET SIZE, BY REGION,  2016–2019 (USD MILLION)
                                 TABLE 143 FEED MYCOTOXIN TESTING MARKET SIZE, BY REGION, 2020–2025 (USD MILLION)
     10.3 IMPACT OF COVID-19 ON MYCOTOXIN TESTING ACROSS REGIONS
             10.3.1 HIGH IMPACT REGIONS; EUROPE & ASIA PACIFIC
             10.3.2 LOW IMPACT REGION; NORTH AMERICA
     10.4 EUROPE
          FIGURE 29 EUROPE: MYCOTOXIN CONTAMINATED SAMPLES,  Q1 2018 VS. Q2 2018 (PERCENTAGE)
          FIGURE 30 RASFF NOTIFICATIONS IN EUROPE, BY HAZARD CATEGORY,  2004–2015 (PERCENTAGE SHARE)
          FIGURE 31 MYCOTOXINS REGULATED IN FEED & FOOD IN EUROPE
          TABLE 144 MYCOTOXINS IN FOOD: REGULATORY LIMITS FOR EUROPE
          FIGURE 32 EUROPE: MYCOTOXIN TESTING MARKET SNAPSHOT
          TABLE 145 EUROPE: MARKET SIZE FOR MYCOTOXIN TESTING, BY COUNTRY, 2016–2019 (USD MILLION)
          TABLE 146 EUROPE: MARKET SIZE FOR MYCOTOXIN TESTING BY COUNTRY, 2020–2025 (USD MILLION)
          TABLE 147 EUROPE: FOOD MYCOTOXIN TESTING MARKET SIZE, BY COUNTRY, 2016–2019 (USD MILLION)
          TABLE 148 EUROPE: FOOD MYCOTOXIN TESTING MARKET SIZE, BY COUNTRY, 2020–2025 (USD MILLION)
          TABLE 149 EUROPE: FEED MYCOTOXIN TESTING MARKET SIZE, BY COUNTRY, 2016–2019 (USD THOUSANDS)
          TABLE 150 EUROPE: FEED MYCOTOXIN TESTING MARKET SIZE, BY COUNTRY,  2020–2025 (USD THOUSANDS)
          TABLE 151 EUROPE: MARKET SIZE FOR MYCOTOXIN TESTING, BY TYPE,  2016–2019 (USD MILLION)
          TABLE 152 EUROPE: MARKET SIZE FOR MYCOTOXIN TESTING, BY TYPE, 2020–2025 (USD MILLION)
          TABLE 153 EUROPE: FOOD MYCOTOXIN TESTING MARKET SIZE, BY TYPE, 2016–2019 (USD MILLION)
          TABLE 154 EUROPE: FOOD MYCOTOXIN TESTING MARKET SIZE, BY TYPE, 2020–2025 (USD MILLION)
          TABLE 155 EUROPE: FEED MYCOTOXIN TESTING MARKET SIZE, BY TYPE, 2016–2019 (USD THOUSANDS)
          TABLE 156 EUROPE: FEED MYCOTOXIN TESTING MARKET SIZE, BY TYPE, 2020–2025 (USD THOUSANDS)
          TABLE 157 EUROPE: MARKET SIZE FOR MYCOTOXIN TESTING, BY SAMPLE, 2016–2019 (USD MILLION)
          TABLE 158 EUROPE: MARKET SIZE FOR MYCOTOXIN TESTING, BY SAMPLE,  2020–2025 (USD MILLION)
          TABLE 159 EUROPE: FOOD MYCOTOXIN TESTING MARKET SIZE, BY FOOD TYPE, 2016–2019 (USD MILLION)
          TABLE 160 EUROPE: FOOD MYCOTOXIN TESTING MARKET SIZE, BY FOOD TYPE, 2020–2025 (USD MILLION)
          TABLE 161 EUROPE: FEED MYCOTOXIN TESTING MARKET, BY FEED TYPE,  2016–2019 (USD MILLION)
          TABLE 162 EUROPE: FEED MYCOTOXIN TESTING MARKET SIZE, BY FEED TYPE, 2020–2025 (USD MILLION)
          TABLE 163 EUROPE: MARKET SIZE FOR MYCOTOXIN TESTING, BY TECHNOLOGY, 2016–2019 (USD MILLION)
          TABLE 164 EUROPE: MARKET SIZE FOR MYCOTOXIN TESTING, BY TECHNOLOGY, 2020–2025 (USD MILLION)
          TABLE 165 EUROPE: MARKET SIZE FOR MYCOTOXIN TESTING, BY CHROMATOGRAPHY-  & SPECTROSCOPY-BASED TECHNOLOGY, 2016–2019 (USD MILLION)
          TABLE 166 EUROPE: MARKET SIZE FOR MYCOTOXIN TESTING, BY CHROMATOGRAPHY-  & SPECTROSCOPY-BASED TECHNOLOGY, 2020–2025 (USD MILLION)
             10.4.1 GERMANY
                        10.4.1.1 Favorable policies by the National Reference Laboratory (NRL) in Germany is driving the market
                                 TABLE 167 GERMANY: MARKET SIZE FOR MYCOTOXIN TESTING, BY SAMPLE, 2016–2019 (USD MILLION)
                                 TABLE 168 GERMANY: MARKET SIZE FOR MYCOTOXIN TESTING, BY SAMPLE, 2020–2025 (USD MILLION)
                                 TABLE 169 GERMANY: FOOD MYCOTOXIN TESTING MARKET SIZE, BY TYPE, 2016–2019 (USD MILLION)
                                 TABLE 170 GERMANY: FOOD MYCOTOXIN TESTING MARKET SIZE, BY TYPE,   2020–2025 (USD MILLION)
                                 TABLE 171 GERMANY: FEED MYCOTOXIN TESTING MARKET SIZE, BY TYPE,  2016–2019 (USD THOUSANDS)
                                 TABLE 172 GERMANY: FEED MYCOTOXIN TESTING MARKET SIZE, BY TYPE,  2020–2025 (USD THOUSANDS)
             10.4.2 UK
                        10.4.2.1 DON is growing as the most prevalent mycotoxin in the UK
                                 TABLE 173 UK: MARKET SIZE FOR MYCOTOXIN TESTING, BY SAMPLE, 2016–2019 (USD MILLION)
                                 TABLE 174 UK: MARKET SIZE FOR MYCOTOXIN TESTING, BY SAMPLE, 2020–2025 (USD MILLION)
                                 TABLE 175 UK: FOOD MYCOTOXIN TESTING MARKET SIZE, BY TYPE,  2016–2019 (USD MILLION)
                                 TABLE 176 UK: FOOD MYCOTOXIN TESTING MARKET SIZE, BY TYPE, 2020–2025 (USD MILLION)
                                 TABLE 177 UK: FEED MYCOTOXIN TESTING MARKET SIZE, BY TYPE,  2016–2019 (USD THOUSANDS)
                                 TABLE 178 UK: FEED MYCOTOXIN TESTING MARKET SIZE, BY TYPE, 2020–2025 (USD THOUSANDS)
             10.4.3 FRANCE
                        10.4.3.1 Regulatory rigor is creating an opportunity for mycotoxin testing in feed and food
                                 TABLE 179 FRANCE: MARKET SIZE FOR MYCOTOXIN TESTING, BY SAMPLE, 2016–2019 (USD MILLION)
                                 TABLE 180 FRANCE: MARKET SIZE FOR MYCOTOXIN TESTING, BY SAMPLE, 2020–2025 (USD MILLION)
                                 TABLE 181 FRANCE: FOOD MYCOTOXIN TESTING MARKET SIZE, BY TYPE, 2016–2019 (USD MILLION)
                                 TABLE 182 FRANCE: FOOD MYCOTOXIN TESTING MARKET SIZE, BY TYPE,  2020–2025 (USD MILLION)
                                 TABLE 183 FRANCE: FEED MYCOTOXIN TESTING MARKET SIZE, BY TYPE,  2016–2019 (USD THOUSANDS)
                                 TABLE 184 FRANCE: FEED MYCOTOXIN TESTING MARKET SIZE, BY TYPE, 2020–2025 (USD THOUSANDS)
             10.4.4 ITALY
                        10.4.4.1 Increasing outbreaks due to mycotoxin-contaminated food is creating demand for testing in Italy
                                 TABLE 185 ITALY: MARKET SIZE FOR MYCOTOXIN TESTING, BY SAMPLE, 2016–2019 (USD MILLION)
                                 TABLE 186 ITALY: MARKET SIZE FOR MYCOTOXIN TESTING, BY SAMPLE, 2020–2025 (USD MILLION)
                                 TABLE 187 ITALY: FOOD MYCOTOXIN TESTING MARKET SIZE, BY TYPE, 2016–2019 (USD MILLION)
                                 TABLE 188 ITALY: FOOD MYCOTOXIN TESTING MARKET SIZE, BY TYPE, 2020–2025 (USD MILLION)
                                 TABLE 189 ITALY: FEED MYCOTOXIN TESTING MARKET SIZE, BY TYPE, 2016–2019 (USD THOUSANDS)
                                 TABLE 190 ITALY: FEED MYCOTOXIN TESTING MARKET SIZE, BY TYPE, 2020–2025 (USD THOUSANDS)
             10.4.5 POLAND
                        10.4.5.1 Growth in feed crops production and cultivation is creating an opportunity for mycotoxin testing in the country
                                 TABLE 191 POLAND: MARKET SIZE FOR MYCOTOXIN TESTING, BY SAMPLE,  2016–2019 (USD MILLION)
                                 TABLE 192 POLAND: MARKET SIZE FOR MYCOTOXIN TESTING, BY SAMPLE, 2020–2025 (USD MILLION)
                                 TABLE 193 POLAND: FOOD MYCOTOXIN TESTING MARKET SIZE, BY TYPE, 2016–2019 (USD MILLION)
                                 TABLE 194 POLAND: FOOD MYCOTOXIN TESTING MARKET SIZE, BY TYPE,  2020–2025 (USD MILLION)
                                 TABLE 195 POLAND: FEED MYCOTOXIN TESTING MARKET SIZE, BY TYPE, 2016–2019 (USD THOUSANDS)
                                 TABLE 196 POLAND: FEED MYCOTOXIN TESTING MARKET SIZE, BY TYPE,  2020–2025 (USD THOUSANDS)
             10.4.6 REST OF EUROPE
                        10.4.6.1 Growing consumer awareness to fuel the demand for mycotoxin testing in the region
                                 TABLE 197 REST OF EUROPE: MARKET SIZE FOR MYCOTOXIN TESTING, BY SAMPLE,   2016–2019 (USD MILLION)
                                 TABLE 198 REST OF EUROPE: MARKET SIZE FOR MYCOTOXIN TESTING, BY SAMPLE, 2020–2025 (USD MILLION)
                                 TABLE 199 REST OF EUROPE: FOOD MYCOTOXIN TESTING MARKET SIZE, BY TYPE, 2016–2019 (USD MILLION)
                                 TABLE 200 REST OF EUROPE: FOOD MYCOTOXIN TESTING MARKET SIZE, BY TYPE,   2020–2025 (USD MILLION)
                                 TABLE 201 REST OF EUROPE: FEED MYCOTOXIN TESTING MARKET SIZE, BY TYPE, 2016–2019 (USD THOUSANDS)
                                 TABLE 202 REST OF EUROPE: FEED MYCOTOXIN TESTING MARKET SIZE, BY TYPE,  2020–2025 (USD THOUSANDS)
     10.5 NORTH AMERICA
          FIGURE 33 NORTH AMERICA: MYCOTOXIN CONTAMINATED SAMPLES, Q1 2018 VS Q2 2018 (PERCENTAGE)
          FIGURE 34 MYCOTOXINS REGULATED IN FEED AND FOOD IN NORTH AMERICA  (US & CANADA)
          TABLE 203 AFLATOXIN IN FEED: REGULATORY LIMITS OF MYCOTOXIN IN NORTH AMERICA
          TABLE 204 DEOXYNIVALENOL IN FEED: REGULATORY LIMITS OF MYCOTOXIN IN NORTH AMERICA
          TABLE 205 NORTH AMERICA: MARKET SIZE FOR MYCOTOXIN TESTING, BY COUNTRY/REGION,  2016–2019 (USD MILLION)
          TABLE 206 NORTH AMERICA: MARKET SIZE FOR MYCOTOXIN TESTING, BY COUNTRY/REGION,  2020–2025 (USD MILLION)
          TABLE 207 NORTH AMERICA: FOOD MYCOTOXIN TESTING MARKET SIZE,  BY COUNTRY/REGION,  2016–2019 (USD MILLION)
          TABLE 208 NORTH AMERICA: FOOD MYCOTOXIN TESTING MARKET SIZE,  BY COUNTRY/REGION,  2020–2025 (USD MILLION)
          TABLE 209 NORTH AMERICA: FEED MYCOTOXIN TESTING MARKET SIZE, BY COUNTRY/REGION,  2016–2019 (USD THOUSANDS)
          TABLE 210 NORTH AMERICA: FEED MYCOTOXIN TESTING MARKET SIZE, BY COUNTRY/REGION,  2020–2025 (USD THOUSANDS)
          TABLE 211 NORTH AMERICA: MARKET SIZE FOR MYCOTOXIN TESTING, BY TYPE, 2016–2019 (USD MILLION)
          TABLE 212 NORTH AMERICA: MARKET SIZE FOR MYCOTOXIN TESTING, BY TYPE, 2020–2025 (USD MILLION)
          TABLE 213 NORTH AMERICA: MARKET SIZE IN FOOD, BY TYPE,  2016–2019 (USD MILLION)
          TABLE 214 NORTH AMERICA: MARKET SIZE IN FOOD, BY TYPE,  2020–2025 (USD MILLION)
          TABLE 215 NORTH AMERICA: MARKET SIZE IN FEED, BY TYPE,  2016–2019 (USD THOUSANDS)
          TABLE 216 NORTH AMERICA: MARKET SIZE IN FEED, BY TYPE,  2020–2025 (USD THOUSANDS)
          TABLE 217 NORTH AMERICA: MARKET SIZE, BY SAMPLE,  2016–2019 (USD MILLION)
          TABLE 218 NORTH AMERICA: MARKET SIZE, BY SAMPLE,  2020–2025 (USD MILLION)
          TABLE 219 NORTH AMERICA: MARKET SIZE IN FOOD, BY FOOD TYPE,  2016–2019 (USD MILLION)
          TABLE 220 NORTH AMERICA: MARKET SIZE IN FOOD, BY FOOD TYPE,  2020–2025 (USD MILLION)
          TABLE 221 NORTH AMERICA: MARKET SIZE IN FEED, BY FEED TYPE,  2016–2019 (USD MILLION)
          TABLE 222 NORTH AMERICA: MARKET SIZE IN FEED, BY FEED TYPE,  2020–2025 (USD MILLION)
          TABLE 223 NORTH AMERICA: MARKET SIZE FOR MYCOTOXIN TESTING, BY TECHNOLOGY,  2016–2019 (USD MILLION)
          TABLE 224 NORTH AMERICA: MARKET SIZE FOR MYCOTOXIN TESTING, BY TECHNOLOGY,  2020–2025 (USD MILLION)
          TABLE 225 NORTH AMERICA: MARKET SIZE FOR MYCOTOXIN TESTING, BY CHROMATOGRAPHY-& SPECTROSCOPY-BASED TECHNOLOGY, 2016–2019 (USD MILLION)
          TABLE 226 NORTH AMERICA: MARKET SIZE FOR MYCOTOXIN TESTING, BY CHROMATOGRAPHY-& SPECTROSCOPY-BASED TECHNOLOGY, 2020–2025 (USD MILLION)
             10.5.1 US
                        10.5.1.1 Mycotoxin contamination in pasture grasses has led to rising concerns about feed safety in the US
                                 TABLE 227 US: MYCOTOXIN TESTING MARKET SIZE, BY SAMPLE,  2016–2019 (USD MILLION)
                                 TABLE 228 US: MARKET SIZE FOR MYCOTOXIN TESTING, BY SAMPLE, 2020–2025 (USD MILLION)
                                 TABLE 229 US: MARKET SIZE IN FOOD, BY TYPE, 2016–2019 (USD MILLION)
                                 TABLE 230 US: MARKET SIZE IN FOOD, BY TYPE,  2020–2025 (USD MILLION)
                                 TABLE 231 US: MARKET SIZE IN FEED, BY TYPE, 2016–2019 (USD THOUSANDS)
                                 TABLE 232 US: MARKET SIZE IN FEED, BY TYPE,  2020–2025 (USD THOUSANDS)
             10.5.2 CANADA
                        10.5.2.1 Regulatory actions by the Canadian Food Inspection Agency (CFIA) offers growth opportunities for mycotoxin testing in Canada
                                 TABLE 233 CANADA: MARKET SIZE FOR MYCOTOXIN TESTING, BY SAMPLE, 2016–2019 (USD MILLION)
                                 TABLE 234 CANADA: MARKET SIZE FOR MYCOTOXIN TESTING, BY SAMPLE, 2020–2025 (USD MILLION)
                                 TABLE 235 CANADA: MARKET SIZE IN FOOD, BY TYPE, 2016–2019 (USD MILLION)
                                 TABLE 236 CANADA:  TESTING MARKET SIZE IN FOOD, BY TYPE,  2020–2025 (USD MILLION)
                                 TABLE 237 CANADA: MARKET SIZE IN FEED, BY TYPE,  2016–2019 (USD THOUSANDS)
                                 TABLE 238 CANADA: MARKET SIZE IN FEED, BY TYPE,  2020–2025 (USD THOUSANDS)
             10.5.3 MEXICO
                        10.5.3.1 Favorable government policies for international trade to fuel the mycotoxin testing market in the country
                                 TABLE 239 MEXICO: MARKET SIZE FOR MYCOTOXIN TESTING, BY SAMPLE, 2016–2019 (USD MILLION)
                                 TABLE 240 MEXICO: MARKET SIZE, BY SAMPLE,  2020–2025 (USD MILLION)
                                 TABLE 241 MEXICO: MARKET SIZE IN FOOD, BY TYPE,  2016–2019 (USD MILLION)
                                 TABLE 242 MEXICO: MARKET SIZE IN FOOD, BY TYPE,  2020–2025 (USD MILLION)
                                 TABLE 243 MEXICO:MARKET SIZE IN FEED, BY TYPE, 2016–2019 (USD THOUSANDS)
                                 TABLE 244 MEXICO: MARKET SIZE IN FEED, BY TYPE, 2020–2025 (USD THOUSANDS)
     10.6 ASIA PACIFIC
          FIGURE 35 ASIA PACIFIC: MYCOTOXIN CONTAMINATED SAMPLES, BY MYCOTOXIN TYPE,  Q1 2018 VS. Q2 2018
          FIGURE 36 ASIA PACIFIC: MYCOTOXIN TESTING MARKET SNAPSHOT, 2020
          TABLE 245 ASIA PACIFIC: MARKET SIZE FOR MYCOTOXIN TESTING, BY COUNTRY/REGION,  2016–2019 (USD MILLION)
          TABLE 246 ASIA PACIFIC: MARKET SIZE FOR MYCOTOXIN TESTING, BY COUNTRY/REGION,  2020–2025 (USD MILLION)
          TABLE 247 ASIA PACIFIC: FOOD MYCOTOXIN TESTING MARKET SIZE,  BY COUNTRY/REGION,  2016–2019 (USD MILLION)
          TABLE 248 ASIA PACIFIC: FOOD MYCOTOXIN TESTING MARKET SIZE,  BY COUNTRY/REGION,  2020–2025 (USD MILLION)
          TABLE 249 ASIA PACIFIC: FEED MYCOTOXIN TESTING MARKET SIZE, BY COUNTRY/REGION,  2016–2019 (USD MILLION)
          TABLE 250 ASIA PACIFIC: FEED MYCOTOXIN TESTING MARKET SIZE,  BY COUNTRY/REGION,  2020–2025 (USD MILLION)
          TABLE 251 ASIA PACIFIC: MARKET SIZE FOR MYCOTOXIN TESTING, BY TYPE, 2016–2019 (USD MILLION)
          TABLE 252 ASIA PACIFIC: MARKET SIZE FOR MYCOTOXIN TESTING, BY TYPE,  2020–2025 (USD MILLION)
          TABLE 253 ASIA PACIFIC: MARKET SIZE IN FOOD, BY TYPE,  2016–2019 (USD MILLION)
          TABLE 254 ASIA PACIFIC: MARKET SIZE IN FOOD, BY TYPE,  2020–2025 (USD MILLION)
          TABLE 255 ASIA PACIFIC: MARKET SIZE IN FEED, BY TYPE, 2016–2019 (USD MILLION)
          TABLE 256 ASIA PACIFIC: MARKET SIZE IN FEED, BY TYPE, 2020–2025 (USD MILLION)
          TABLE 257 ASIA PACIFIC: MARKET SIZE, BY SAMPLE,  2016–2019 (USD MILLION)
          TABLE 258 ASIA PACIFIC: MARKET SIZE, BY SAMPLE,  2020–2025 (USD MILLION)
          TABLE 259 ASIA PACIFIC: MARKET SIZE IN FOOD, BY FOOD TYPE,  2016–2019 (USD MILLION)
          TABLE 260 ASIA PACIFIC: MARKET SIZE IN FOOD, BY FOOD TYPE,  2020–2025 (USD MILLION)
          TABLE 261 ASIA PACIFIC: MARKET SIZE IN FEED, BY FEED TYPE,  2016–2019 (USD MILLION)
          TABLE 262 ASIA PACIFIC: MARKET SIZE IN FEED, BY FEED TYPE,  2020–2025 (USD MILLION)
          TABLE 263 ASIA PACIFIC: MARKET SIZE, BY TECHNOLOGY,  2016–2019 (USD MILLION)
          TABLE 264 ASIA PACIFIC: MARKET SIZE, BY TECHNOLOGY,  2020–2025 (USD MILLION)
          TABLE 265 ASIA PACIFIC: MARKET SIZE, BY CHROMATOGRAPHY-& SPECTROSCOPY-BASED TECHNOLOGY, 2016–2019 (USD MILLION)
          TABLE 266 ASIA PACIFIC: MARKET SIZE, BY CHROMATOGRAPHY-& SPECTROSCOPY-BASED TECHNOLOGY, 2020–2025 (USD MILLION)
             10.6.1 CHINA
                        10.6.1.1 Growth in the prevalence of mycotoxins in China is leading to demand for testing
                                 TABLE 267 CHINA: REGULATORY LIMITS OF MYCOTOXIN IN FOOD
                                 TABLE 268 MYCOTOXIN IN FEED: REGULATORY LIMITS OF MYCOTOXIN IN CHINA
                                 TABLE 269 CHINA: MARKET SIZE FOR MYCOTOXIN TESTING, BY SAMPLE, 2016–2019 (USD MILLION)
                                 TABLE 270 CHINA: MARKET SIZE FOR MYCOTOXIN TESTING, BY SAMPLE, 2020–2025 (USD MILLION)
                                 TABLE 271 CHINA: MARKET SIZE IN FOOD, BY TYPE, 2016–2019 (USD MILLION)
                                 TABLE 272 CHINA: MARKET SIZE IN FOOD, BY TYPE, 2020–2025 (USD MILLION)
                                 TABLE 273 CHINA: MARKET SIZE IN FEED, BY TYPE, 2016–2019 (USD THOUSANDS)
                                 TABLE 274 CHINA: MARKET SIZE IN FEED, BY TYPE, 2020–2025 (USD THOUSANDS)
             10.6.2 INDIA
                        10.6.2.1 Aflatoxin contamination is a major concern in India
                                 TABLE 275 MYCOTOXIN LIMITS FOR SPECIFIC FOOD ITEMS IN INDIA
                                 TABLE 276 INDIA: MYCOTOXIN TESTING MARKET SIZE, BY SAMPLE, 2016–2019 (USD MILLION)
                                 TABLE 277 INDIA: MARKET SIZE, BY SAMPLE, 2020–2025 (USD MILLION)
                                 TABLE 278 INDIA: MARKET SIZE IN FOOD, BY TYPE, 2016–2019 (USD MILLION)
                                 TABLE 279 INDIA: MARKET SIZE IN FOOD, BY TYPE, 2020–2025 (USD MILLION)
                                 TABLE 280 INDIA: MARKET SIZE IN FEED, BY TYPE,  2016–2019 (USD THOUSANDS)
                                 TABLE 281 INDIA: MARKET SIZE IN FEED, BY TYPE, 2020–2025 (USD THOUSANDS)
             10.6.3 JAPAN
                        10.6.3.1 Fusarium toxin contamination is growing in Japan with changing climatic conditions
                                 TABLE 282 JAPAN: MYCOTOXIN TESTING MARKET SIZE, BY SAMPLE, 2016–2019 (USD MILLION)
                                 TABLE 283 JAPAN: MARKET SIZE, BY SAMPLE,  2020–2025 (USD MILLION)
                                 TABLE 284 JAPAN: MARKET SIZE IN FOOD, BY TYPE, 2016–2019 (USD MILLION)
                                 TABLE 285 JAPAN: MARKET SIZE IN FOOD, BY TYPE, 2020–2025 (USD MILLION)
                                 TABLE 286 JAPAN: MARKET SIZE IN FEED, BY TYPE,  2016–2019 (USD THOUSANDS)
                                 TABLE 287 JAPAN: MARKET SIZE IN FEED, BY TYPE,  2020–2025 (USD THOUSANDS)
             10.6.4 AUSTRALIA & NEW ZEALAND
                        10.6.4.1 Development in regulatory standards offers further growth opportunities in Australia & New Zealand
                                 TABLE 288 MYCOTOXIN LIMITS FOR FOOD ITEMS SET BY FOOD STANDARDS AUSTRALIA AND  NEW ZEALAND
                                 TABLE 289 AUSTRALIA AND NEW ZEALAND: MYCOTOXIN TESTING MARKET SIZE, BY SAMPLE,  2016–2019 (USD MILLION)
                                 TABLE 290 AUSTRALIA AND NEW ZEALAND: MARKET SIZE, BY SAMPLE,  2020–2025 (USD MILLION)
                                 TABLE 291 AUSTRALIA AND NEW ZEALAND: MARKET SIZE IN FOOD, BY TYPE, 2016–2019 (USD MILLION)
                                 TABLE 292 AUSTRALIA AND NEW ZEALAND: MARKET SIZE IN FOOD, BY TYPE, 2020–2025 (USD MILLION)
                                 TABLE 293 AUSTRALIA AND NEW ZEALAND: MARKET SIZE IN FEED, BY TYPE, 2016–2019 (USD THOUSANDS)
                                 TABLE 294 AUSTRALIA AND NEW ZEALAND: MARKET SIZE IN FEED, BY TYPE, 2020–2025 (USD THOUSANDS)
             10.6.5 REST OF ASIA PACIFIC
                        10.6.5.1 Lack of food control policies is fueling mycotoxin testing market in the region
                                 FIGURE 37 OCEANIA: MYCOTOXIN CONTAMINATED SAMPLES, BY MYCOTOXIN TYPE,  Q1 2018 VS. Q2 2018
                                 TABLE 295 REST OF ASIA PACIFIC: MYCOTOXIN TESTING MARKET SIZE, BY SAMPLE,  2016–2019 (USD MILLION)
                                 TABLE 296 REST OF ASIA PACIFIC: MARKET SIZE, BY SAMPLE,  2020–2025 (USD MILLION)
                                 TABLE 297 REST OF ASIA PACIFIC: MARKET SIZE IN FOOD, BY TYPE,  2016–2019 (USD MILLION)
                                 TABLE 298 REST OF ASIA PACIFIC: MARKET SIZE IN FOOD, BY TYPE,  2020–2025 (USD MILLION)
                                 TABLE 299 REST OF ASIA PACIFIC: MARKET SIZE IN FEED, BY TYPE,  2016–2019 (USD THOUSANDS)
                                 TABLE 300 REST OF ASIA PACIFIC: MARKET SIZE IN FEED, BY TYPE,  2020–2025 (USD THOUSANDS)
     10.7 REST OF THE WORLD (ROW)
          TABLE 301 ROW: MARKET SIZE FOR MYCOTOXIN TESTING, BY COUNTRY, 2016–2019 (USD MILLION)
          TABLE 302 ROW: MARKET SIZE, BY COUNTRY, 2020–2025 (USD MILLION)
          TABLE 303 ROW: FOOD MYCOTOXIN TESTING MARKET SIZE, BY COUNTRY,  2016–2019 (USD MILLION)
          TABLE 304 ROW: FOOD MYCOTOXIN TESTING MARKET SIZE, BY COUNTRY, 2020–2025 (USD MILLION)
          TABLE 305 ROW: FEED MYCOTOXIN TESTING MARKET SIZE, BY COUNTRY, 2016–2019 (USD THOUSANDS)
          TABLE 306 ROW: FEED MYCOTOXIN TESTING MARKET SIZE, BY COUNTRY, 2020–2025 (USD THOUSANDS)
          TABLE 307 ROW: MARKET SIZE FOR MYCOTOXIN TESTING, BY TYPE,  2016–2019 (USD MILLION)
          TABLE 308 ROW: MARKET SIZE FOR MYCOTOXIN TESTING, BY TYPE, 2020–2025 (USD MILLION)
          TABLE 309 ROW: FOOD MYCOTOXIN TESTING MARKET SIZE, BY TYPE, 2016–2019 (USD MILLION)
          TABLE 310 ROW: FOOD MYCOTOXIN TESTING MARKET SIZE, BY TYPE, 2020–2025 (USD MILLION)
          TABLE 311 ROW: FEED MYCOTOXIN TESTING MARKET SIZE, BY TYPE,  2016–2019 (USD THOUSANDS)
          TABLE 312 ROW: FEED MYCOTOXIN TESTING MARKET SIZE, BY TYPE,  2020–2025 (USD THOUSANDS)
          TABLE 313 ROW: MARKET SIZE FOR MYCOTOXIN TESTING, BY SAMPLE, 2016–2019 (USD MILLION)
          TABLE 314 ROW: MARKET SIZE FOR MYCOTOXIN TESTING, BY SAMPLE,  2020–2025 (USD MILLION)
          TABLE 315 ROW: FOOD MYCOTOXIN TESTING MARKET SIZE, BY FOOD TYPE,  2016–2019 (USD MILLION)
          TABLE 316 ROW: FOOD MYCOTOXIN TESTING MARKET SIZE, BY FOOD TYPE,   2020–2025 (USD MILLION)
          TABLE 317 ROW: FEED MYCOTOXIN TESTING MARKET, BY FEED TYPE, 2016–2019 (USD MILLION)
          TABLE 318 ROW: FEED MYCOTOXIN TESTING MARKET SIZE, BY FEED TYPE,  2020–2025 (USD MILLION)
          TABLE 319 ROW: MARKET SIZE FOR MYCOTOXIN TESTING, BY TECHNOLOGY,  2016–2019 (USD MILLION)
          TABLE 320 ROW: MARKET SIZE FOR MYCOTOXIN TESTING, BY TECHNOLOGY, 2020–2025 (USD MILLION)
          TABLE 321 ROW: MARKET SIZE FOR MYCOTOXIN TESTING, BY CHROMATOGRAPHY-  & SPECTROSCOPY-BASED TECHNOLOGY, 2016–2019 (USD MILLION)
          TABLE 322 ROW: MARKET SIZE FOR MYCOTOXIN TESTING, BY CHROMATOGRAPHY-  & SPECTROSCOPY-BASED TECHNOLOGY, 2020–2025 (USD MILLION)
             10.7.1 BRAZIL
                        10.7.1.1 The regulations for mycotoxins in the country are dependent on the requirements of producer countries such as Peru and Bolivia
                                 TABLE 323 BRAZIL: MARKET SIZE FOR MYCOTOXIN TESTING, BY SAMPLE,  2016–2019 (USD MILLION)
                                 TABLE 324 BRAZIL: MARKET SIZE FOR MYCOTOXIN TESTING, BY SAMPLE,  2020–2025 (USD MILLION)
                                 TABLE 325 BRAZIL: FOOD MYCOTOXIN TESTING MARKET SIZE, BY TYPE, 2016–2019 (USD MILLION)
                                 TABLE 326 BRAZIL: FOOD MYCOTOXIN TESTING MARKET SIZE, BY TYPE, 2020–2025 (USD MILLION)
                                 TABLE 327 BRAZIL: FEED MYCOTOXIN TESTING MARKET SIZE, BY TYPE, 2016–2019 (USD THOUSANDS)
                                 TABLE 328 BRAZIL: FEED MYCOTOXIN TESTING MARKET SIZE, BY TYPE,  2020–2025 (USD THOUSANDS)
             10.7.2 ARGENTINA
                        10.7.2.1 Prominent food safety regulations due to agricultural exports to Europe and North America
                                 TABLE 329 AFLATOXIN LIMITS IN ARGENTINA
                                 TABLE 330 ARGENTINA: MARKET SIZE FOR MYCOTOXIN TESTING, BY SAMPLE, 2016–2019 (USD MILLION)
                                 TABLE 331 ARGENTINA: MARKET SIZE FOR MYCOTOXIN TESTING, BY SAMPLE,  2020–2025 (USD MILLION)
                                 TABLE 332 ARGENTINA: FOOD MYCOTOXIN TESTING MARKET SIZE, BY TYPE, 2016–2019 (USD MILLION)
                                 TABLE 333 ARGENTINA: FOOD MYCOTOXIN TESTING MARKET SIZE, BY TYPE, 2020–2025 (USD MILLION)
                                 TABLE 334 ARGENTINA: FEED MYCOTOXIN TESTING MARKET SIZE, BY TYPE, 2016–2019 (USD THOUSANDS)
                                 TABLE 335 ARGENTINA: FEED MYCOTOXIN TESTING MARKET SIZE, BY TYPE,  2020–2025 (USD THOUSANDS)
             10.7.3 SOUTH AFRICA
                        10.7.3.1 A three-year project has been taken up to tackle mycotoxin-related food safety issues in Africa
                                 FIGURE 38 SOUTH AFRICA: MYCOTOXIN CONTAMINATED SAMPLES, BY MYCOTOXIN TYPE, Q1 2018 VS. Q2 2018
                                 TABLE 336 SOUTH AFRICA: MARKET SIZE FOR MYCOTOXIN TESTING, BY SAMPLE, 2016–2019 (USD MILLION)
                                 TABLE 337 SOUTH AFRICA: MARKET SIZE FOR MYCOTOXIN TESTING, BY SAMPLE, 2020–2025 (USD MILLION)
                                 TABLE 338 SOUTH AFRICA: FOOD MYCOTOXIN TESTING MARKET SIZE, BY TYPE,   2016–2019 (USD MILLION)
                                 TABLE 339 SOUTH AFRICA: FOOD MYCOTOXIN TESTING MARKET SIZE, BY TYPE, 2020–2025 (USD MILLION)
                                 TABLE 340 SOUTH AFRICA: FEED MYCOTOXIN TESTING MARKET SIZE, BY TYPE, 2016–2019 (USD THOUSANDS)
                                 TABLE 341 SOUTH AFRICA: FEED MYCOTOXIN TESTING MARKET SIZE, BY TYPE, 2020–2025 (USD THOUSANDS)
             10.7.4 OTHERS IN ROW
                        10.7.4.1 Lack of resources in these countries leads to hindrance in the testing of feed mycotoxins
                                 FIGURE 39 SOUTH AMERICA: MYCOTOXIN CONTAMINATED SAMPLES, BY MYCOTOXIN TYPE, Q1 2018 VS. Q2 2018
                                 FIGURE 40 REST OF AFRICA: MYCOTOXIN CONTAMINATED SAMPLES, BY MYCOTOXIN TYPE, Q1 2018 VS. Q2 2018
                                 FIGURE 41 MIDDLE EAST: MYCOTOXIN CONTAMINATED SAMPLES, BY MYCOTOXIN TYPE,  Q1 2018 VS. Q2 2018
                                 TABLE 342 OTHERS IN ROW: MARKET SIZE FOR MYCOTOXIN TESTING, BY SAMPLE, 2016–2019 (USD MILLION)
                                 TABLE 343 OTHERS IN ROW: MARKET SIZE FOR MYCOTOXIN TESTING, BY SAMPLE,  2020–2025 (USD MILLION)
                                 TABLE 344 OTHERS IN ROW: FOOD MYCOTOXIN TESTING MARKET SIZE, BY TYPE, 2016–2019 (USD MILLION)
                                 TABLE 345 OTHERS IN ROW: FOOD MYCOTOXIN TESTING MARKET SIZE, BY TYPE, 2020–2025 (USD MILLION)
                                 TABLE 346 OTHERS IN ROW: FEED MYCOTOXIN TESTING MARKET SIZE, BY TYPE,  2016–2019 (USD THOUSANDS)
                                 TABLE 347 OTHERS IN ROW: FEED MYCOTOXIN TESTING MARKET SIZE, BY TYPE,  2020–2025 (USD THOUSANDS)

11 COMPETITIVE LANDSCAPE (Page No. - 283)
     11.1 OVERVIEW
          FIGURE 42 KEY DEVELOPMENTS OF THE LEADING PLAYERS IN THE MARKET, 2016–2020
     11.2 COMPETITIVE LEADERSHIP MAPPING (OVERALL MARKET)
             11.2.1 DYNAMIC DIFFERENTIATORS
             11.2.2 INNOVATORS
             11.2.3 VISIONARY LEADERS
             11.2.4 EMERGING COMPANIES
                    FIGURE 43 MYCOTOXIN TESTING MARKET: COMPETITIVE LEADERSHIP MAPPING, 2019
     11.3 RANKING & MARKET SHARE ANALYSIS OF KEY PLAYERS
          FIGURE 44 SGS LED THE MYCOTOXIN TESTING MARKET IN 2019
     11.4 COMPETITIVE LEADERSHIP MAPPING (START-UP/SMES)
             11.4.1 PROGRESSIVE COMPANIES
             11.4.2 STARTING BLOCKS
             11.4.3 RESPONSIVE COMPANIES
             11.4.4 DYNAMIC COMPANIES
                    FIGURE 45 MYCOTOXIN TESTING MARKET: COMPETITIVE LEADERSHIP MAPPING FOR  START-UPS, 2019
     11.5 COMPETITIVE SCENARIO
             11.5.1 NEW SERVICE, TECHNOLOGY, AND PRODUCT LAUNCHES
                    TABLE 348 NEW SERVICE, TECHNOLOGY, AND PRODUCT LAUNCHES, 2017–2020
             11.5.2 EXPANSIONS & INVESTMENTS
                    TABLE 349 EXPANSIONS & INVESTMENTS, 2018-2019
             11.5.3 ACQUISITIONS
                    TABLE 350 ACQUISITIONS, 2018-2020
             11.5.4 AGREEMENTS, COLLABORATIONS, PARTNERSHIPS, AND MERGERS
                    TABLE 351 AGREEMENTS, COLLABORATIONS, PARTNERSHIPS, AND MERGERS,  2016–2019

12 COMPANY PROFILES (Page No. - 294)
(Business Overview, Services Offered, Recent Developments, SWOT Analysis, and MNM View)*
     12.1 SGS
          FIGURE 46 SGS: COMPANY SNAPSHOT
          FIGURE 47 SGS: SWOT ANALYSIS
     12.2 BUREAU VERITAS
          FIGURE 48 BUREAU VERITAS: COMPANY SNAPSHOT
          FIGURE 49 BUREAU VERITAS: SWOT ANALYSIS
     12.3 INTERTEK
          FIGURE 50 INTERTEK: COMPANY SNAPSHOT
          FIGURE 51 INTERTEK: SWOT ANALYSIS
     12.4 EUROFINS
          FIGURE 52 EUROFINS: COMPANY SNAPSHOT
          FIGURE 53 EUROFINS: SWOT ANALYSIS
     12.5 ALS LIMITED
          FIGURE 54 ALS LIMITED: COMPANY SNAPSHOT
     12.6 NEOGEN
          FIGURE 55 NEOGEN: COMPANY SNAPSHOT
     12.7 ASUREQUALITY
          FIGURE 56 ASUREQUALITY: COMPANY SNAPSHOT
     12.8 MICROBAC LABORATORIES, INC.
     12.9 ROMER LABS
     12.10 SYMBIO LABORATORIES
     12.11 MÉRIEUX NUTRISCIENCES
     12.12 OMIC USA INC.
     12.13 VICAM
     12.14 AGRIFOOD TECHNOLOGY
     12.15 AES LABORATORIES PVT. LTD.
     12.16 TLR INTERNATIONAL LABORATORIES
     12.17 TRILOGY ANALYTICAL LABORATORIES
     12.18 PREMIER ANALYTICAL SERVICES
     12.19 CHARM SCIENCES
     12.20 IEH LABORATORIES & CONSULTING GROUP
     12.21 BIO-CHECK (UK) LTD.
     12.22 DAIRYLAND LABORATORIES, INC.
     12.23 ENVIROLOGIX INC.
     12.24 EMSL ANALYTICAL, INC.
     12.25 KRISHGEN BIOSYSTEMS

*Details on Business Overview, Services Offered, Recent Developments, SWOT Analysis, and MNM View might not be captured in case of unlisted companies.

13 ADJACENT & RELATED MARKETS (Page No. - 342)
     13.1 INTRODUCTION
     13.2 LIMITATIONS
     13.3 MEAT TESTING MARKET
             13.3.1 MARKET DEFINITION
             13.3.2 MARKET OVERVIEW
     13.4 MEAT TESTING MARKET, BY TARGET TESTED
             13.4.1 INTRODUCTION
                    TABLE 352 MEAT TESTING MARKET SIZE, BY TARGET TESTED, 2016–2023 (USD MILLION)
             13.4.2 PATHOGENS
                    TABLE 353 MEAT TESTING FOR PATHOGENS MARKET SIZE, BY REGION, 2016–2023 (USD MILLION)
             13.4.3 SPECIES
                    TABLE 354 MEAT TESTING FOR SPECIES MARKET SIZE, BY REGION, 2016–2023 (USD MILLION)
             13.4.4 GMOS
                    TABLE 355 MEAT TESTING FOR GMOS MARKET SIZE, BY REGION, 2016–2023 (USD MILLION)
             13.4.5 ALLERGENS
                    TABLE 356 MEAT TESTING FOR ALLERGENS MARKET SIZE, BY REGION,  2016–2023 (USD MILLION)
             13.4.6 MYCOTOXINS
                    TABLE 357 MEAT TESTING FOR MYCOTOXINS MARKET SIZE, BY REGION, 2016–2023 (USD MILLION)
             13.4.7 HEAVY METALS
                    TABLE 358 MEAT TESTING FOR HEAVY METALS MARKET SIZE, BY REGION, 2016–2023 (USD MILLION)
             13.4.8 VETERINARY DRUG RESIDUES
                    TABLE 359 MEAT TESTING FOR VETERINARY DRUG RESIDUES MARKET SIZE, BY REGION,  2016–2023 (USD MILLION)
             13.4.9 OTHERS
                    TABLE 360 MEAT TESTING FOR OTHER TARGETS MARKET SIZE, BY REGION, 2016–2023 (USD MILLION)
     13.5 MEAT TESTING MARKET, BY REGION
             13.5.1 INTRODUCTION
                    TABLE 361 MEAT & SEAFOOD TESTING MARKET SIZE, BY REGION,  2016–2023 (USD MILLION)
             13.5.2 NORTH AMERICA
                    TABLE 362 NORTH AMERICA: MEAT TESTING MARKET SIZE, BY TARGET TESTED, 2016–2023 (USD MILLION)
             13.5.3 EUROPE
                    TABLE 363 EUROPE: MEAT TESTING MARKET SIZE, BY TARGET TESTED, 2016–2023 (USD MILLION)
             13.5.4 ASIA PACIFIC
                    TABLE 364 ASIA PACIFIC: MEAT TESTING MARKET SIZE, BY TARGET TESTED, 2016–2023 (USD MILLION)
             13.5.5 REST OF THE WORLD (ROW)
                    TABLE 365 ROW: MEAT TESTING MARKET SIZE, BY TARGET TESTED, 2016–2023 (USD MILLION)
     13.6 SHELF-LIFE TESTING MARKET
             13.6.1 LIMITATIONS
             13.6.2 MARKET DEFINITION
             13.6.3 MARKET OVERVIEW
             13.6.4 SHELF-LIFE TESTING MARKET SIZE, BY FOOD TESTED
                        13.6.4.1 Introduction
                                 TABLE 366 SHELF-LIFE TESTING MARKET SIZE, BY FOOD TESTED, 2016–2023 (USD MILLION)
                        13.6.4.2 Packaged food
                                 TABLE 367 SHELF-LIFE TESTING MARKET SIZE IN PACKAGED FOOD, BY REGION,  2016–2023 (USD MILLION)
                        13.6.4.3 Beverages
                                 TABLE 368 SHELF-LIFE TESTING MARKET SIZE IN BEVERAGES, BY REGION, 2016–2023 (USD MILLION)
                        13.6.4.4 Bakery & confectionery products
                                 TABLE 369 SHELF-LIFE TESTING MARKET SIZE IN BAKERY & CONFECTIONERY PRODUCTS,  BY REGION, 2016–2023 (USD MILLION)
                        13.6.4.5 Meat & meat products
                                 TABLE 370 SHELF-LIFE TESTING MARKET SIZE IN MEAT & MEAT PRODUCTS, BY REGION,  2016–2023 (USD MILLION)
                        13.6.4.6 Dairy, dairy products, and desserts
                                 TABLE 371 SHELF-LIFE TESTING MARKET SIZE IN DAIRY, DAIRY PRODUCTS,  AND DESSERTS,  BY REGION, 2016–2023 (USD MILLION)
                        13.6.4.7 Processed fruits & vege                                 TABLEs
                                 TABLE 372 SHELF-LIFE TESTING MARKET SIZE IN PROCESSED FRUITS & VEGETABLES, BY REGION, 2016–2023 (USD MILLION)
                        13.6.4.8 Others
                                 TABLE 373 SHELF-LIFE TESTING MARKET SIZE IN OTHER FOOD TESTED, BY REGION,  2016–2023 (USD MILLION)
             13.6.5 SHELF-LIFE TESTING MARKET, BY REGION
                        13.6.5.1 Introduction
                                 TABLE 374 SHELF-LIFE TESTING MARKET SIZE, BY REGION, 2016–2023 (USD MILLION)
                        13.6.5.2 Europe
                                 TABLE 375 EUROPE: SHELF-LIFE TESTING SERVICES MARKET SIZE, BY FOOD TESTED,  2016–2023 (USD MILLION)
                        13.6.5.3 North America
                                 TABLE 376 NORTH AMERICA: SHELF-LIFE TESTING SERVICES MARKET SIZE, BY FOOD TESTED,  2016–2023 (USD MILLION)
                        13.6.5.4 Asia Pacific
                                 TABLE 377 ASIA PACIFIC: SHELF-LIFE TESTING SERVICES MARKET SIZE, BY FOOD TESTED,  2016–2023 (USD MILLION)
                        13.6.5.5 Rest of the World (ROW)
                                 TABLE 378 ROW: SHELF-LIFE TESTING SERVICES MARKET SIZE, BY FOOD TESTED,  2016–2023 (USD MILLION)

14 APPENDIX (Page No. - 365)
     14.1 DISCUSSION GUIDE
     14.2 KNOWLEDGE STORE: MARKETSANDMARKETS’  SUBSCRIPTION PORTAL
     14.3 AVAILABLE CUSTOMIZATIONS
     14.4 RELATED REPORTS
     14.5 AUTHOR DETAILS

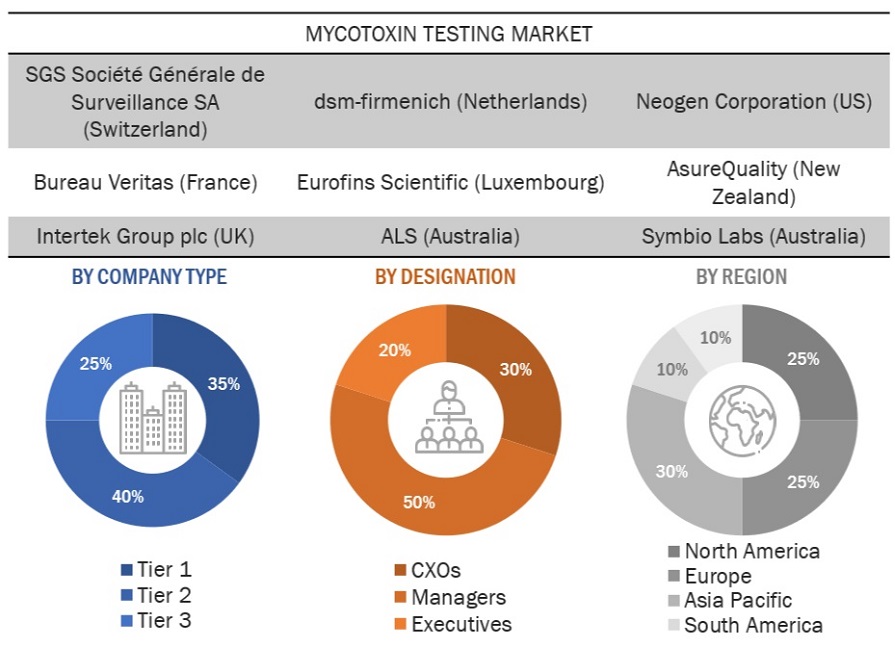
The study includes four major activities to estimate the current market size for mycotxin testing. Exhaustive secondary research was done to collect information on the overall market and the peer market. The next step was to validate these findings, assumptions, and sizing with industry experts across the value chain through primary research. Both top-down and bottom-up approaches were used to estimate the complete market size. Thereafter, data triangulation was used, and the market breakdown was done to estimate the market size of segments and subsegments.

Secondary Research

In the secondary research process, various secondary sources have been referred to, to identify and collect information for this study. The secondary sources included annual reports, press releases, investor presentations of laboratories, white papers, certified publications, articles by recognized authors, regulatory bodies, trade directories, and databases. Secondary research has mainly been used to obtain key information about the industry’s value chain and supply chain, the total pool of key players, market classification & segmentation according to industry trends to the bottom-most level, and geographical markets. It has also been used to obtain information on the key developments from a market-oriented perspective.

Primary Research

The market includes several stakeholders in the supply chain—testing equipment suppliers, service providers, R&D institutes, and food & feed product manufacturers. Various primary sources from both the supply and demand sides of testing service providers, importers/exporte, and food and feed manufacturers were interviewed to obtain qualitative and quantitative information. The primary interviewees from the demand side include research institutions, feed and supplement formulators and suppliers, government agencies, livestock, and the food & feed industry associations, and farm cooperative societies. The primary sources from the supply side include testing service providers, equipment suppliers, and key opinion leaders.

Mycotoxin Testing Market  Size, and Share

To know about the assumptions considered for the study, download the pdf brochure

Market Size Estimation

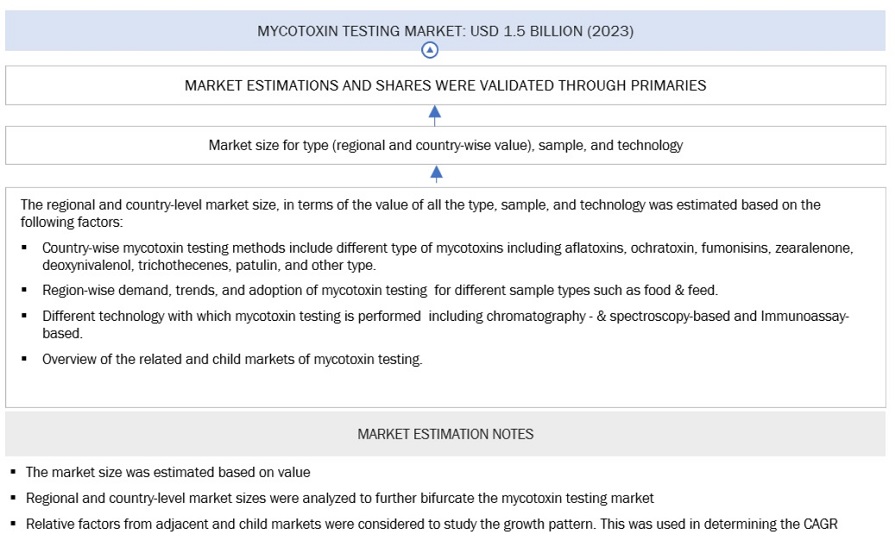
Both the top-down and bottom-up approaches were used to estimate and validate the total size of the mycotxin testing market. These methods were also used extensively to estimate the size of various sub-segments in the market. The research methodology used to estimate the market size includes the following:

  • The key players in the industry and markets were identified through extensive secondary research.
  • All percentage shares, splits, and breakdowns were determined using secondary sources and verified through primary sources.
  • All possible parameters that affect the markets covered in this research study were accounted for, viewed in extensive detail, verified through primary research, and analyzed to obtain the final quantitative and qualitative data.
  • The research included the study of reports, reviews, and newsletters of top market players, along with extensive interviews for opinions from leaders such as CEOs, directors, and marketing executives.

Mycotoxin Testing Market  Size, and Share

To know about the assumptions considered for the study, Request for Free Sample Report

Mycotoxin Testing Market  Size, and Share

Data Triangulation

After arriving at the overall market size from the estimation process explained above, the total market was split into several segments and subsegments. In order to arrive at the exact statistics for all the segments and subsegments, the data triangulation and market breakdown procedures were employed wherever applicable. After the market was validated using both the top-down and bottom-up approaches, the data was triangulated by studying various factors and trends from both the demand and supply sides.

Report Objectives

  • Determining and projecting the size of the market with respect to type, sample, technology, and region over a five-year period from 2020 to 2025
  • Identifying attractive opportunities in the market by determining the largest and fastest-growing segments across regions
  • Analyzing the demand-side factors on the basis of the following:
  • Impact of macro- and microeconomic factors on the market
  • Shifts in demand patterns across different subsegments and regions
  • Identifying and profiling key market players in the mycotoxin testing market on the basis of the following:
  • Service offering
  • Business strategies            
  • Strengths, weaknesses, opportunities, and threats
  • Key financials
  • Understanding the competitive landscape for a comparative analysis of market leaders and identifying the key market shareholders across the industry.
  • Analyzing regulatory frameworks across regions and their impact on prominent market players
  • Providing insights on key investments in technology innovations

Availabe Customizations

With the given market data, MarketsandMarkets offers customizations according to the company’s specific scientific needs.

The following customization options are available for the report:

Product Analysis

Product Matrix, which gives a detailed comparison of the serivce portfolio of each company

Geographic Analysis

  • Further breakdown of the Rest of Europe market into Netherlands, Spain, Belgium, and Denmark
  • Further breakdown of the Rest of Asia Pacific market into the Philippines, Vietnam, Indonesia, Pakistan, and New Zealand
  • Further breakdown of the Rest of South America market into Chile, Colombia, and Venezuela

Company Information

  • Detailed analyses and profiling of additional market players (up to five)
Custom Market Research Services

We will customize the research for you, in case the report listed above does not meet with your exact requirements. Our custom research will comprehensively cover the business information you require to help you arrive at strategic and profitable business decisions.

Request Customization
Report Code
FB 4948
Published ON
Aug, 2020
Choose License Type
BUY NOW
  • SHARE
X
Request Customization
Speak to Analyst
Speak to Analyst
OR FACE-TO-FACE MEETING
PERSONALIZE THIS RESEARCH
  • Triangulate with your Own Data
  • Get Data as per your Format and Definition
  • Gain a Deeper Dive on a Specific Application, Geography, Customer or Competitor
  • Any level of Personalization
REQUEST A FREE CUSTOMIZATION
LET US HELP YOU!
  • What are the Known and Unknown Adjacencies Impacting the Mycotoxin Testing Market
  • What will your New Revenue Sources be?
  • Who will be your Top Customer; what will make them switch?
  • Defend your Market Share or Win Competitors
  • Get a Scorecard for Target Partners
CUSTOMIZED WORKSHOP REQUEST
+1-888-600-6441
  • Call Us
  • +1-888-600-6441 (Corporate office hours)
  • +1-888-600-6441 (US/Can toll free)
  • +44-800-368-9399 (UK office hours)
CONNECT WITH US
ABOUT TRUST ONLINE
©2024 MarketsandMarkets Research Private Ltd. All rights reserved
DMCA.com Protection Status Website Feedback