Molecular Weight Marker Market by Products (DNA, RNA, Protein Ladders), Type (Prestained, Specialty), Application (PCR, Western Blotting, Gel Extraction), & End User (Academic Institutes, Pharmaceutical Companies, CRO) - Global Forecast to 2019


The global molecular weight marker market was valued at $265.36 million in 2014 and is poised to grow at a CAGR of 12.23 % between 2014 and 2019, to reach $472.47 million in 2019. Increased research and development spending by biotechnology and pharmaceutical companies, increasing public funding for life science research, and new innovations in genomics and proteomics research will drive the growth of the this market.
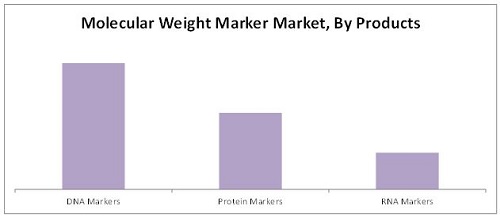
This report segments the global market by products, applications, and end users. The product segments included in the report are DNA, Protein and RNA markers. The DNA markers segment is subsegmented on the basis of marker sizes. The DNA markers size subsegments included in the report are below 50 base pair (bp), 50 bp to 100 bp, 100 bp to 1 kilo base pair (kb), 1 kb to 5 kb and above 5 kb. The protein markers segment is also subsegmented on the basis of marker sizes. The protein markers size subsegments included in the report are below 10 kilo Dalton (kDa), 10 kDa to 100 kDa, 100 kDa to 200 kDa and above 200 kDa markers. The report also includes a segmentation of the molecular weight markers on the basis of staining type. The type segments included in the report are prestained, unstained, and specialty markers.
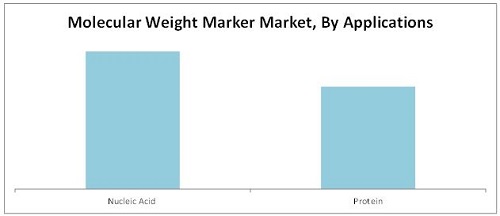
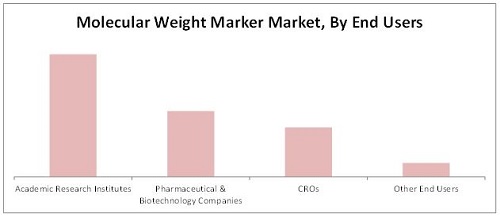
The application segments included in this report are nucleic acid applications and protein applications. The nucleic acid applications segment is subsegmented into PCR, sequencing, northern blotting, southern blotting, molecular cloning, and other nucleic acid applications. The protein applications segment is subsegmented into western blotting, gel extraction, other protein applications. On the basis of end users the global molecular weight marker market report is segmented into academic research institutes, biotechnology and pharmaceutical companies, contract research organizations and other end users.
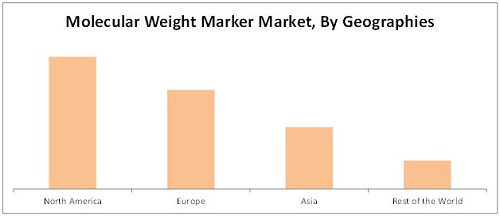
The report also includes a geographic analysis of this market. The geographic segments included in this report are North America, Europe, Asia and Rest of the World (RoW). The geographic analysis reveals that North America accounted for the largest share in the global market in 2014. Asia regional segment, on the other hand, is expected to register a faster growth from 2014 to 2019, due to the increasing in R&D for proteomics and genomics research from this region.
The major players of this market include F Hoffmann-La Roche AG (Switzerland),Thermo Fisher Scientific Inc. (U.S.), Agilent Technologies (U.S.), Sigma-Aldrich (U.S.), Affymetrix, Inc.(U.S.), QIAGEN (Netherlands), Takara Bio Inc. (Japan), Bio-Rad Laboratories (U.S.), Promega Corporation (U.S.) and New England Biolabs (U.S.).
Scope of the Report : Molecular Weight Marker Market
This research report categorizes the global market into the following segments and sub-segments:
Molecular Weight Marker Market, by Products
- DNA Markers, by Ladder Size
- Below 50 base-pair (bp)
- 50 bp to 100 bp
- 100 bp to 1 kilo base-pair (kb)
- 1 kb to 5 kb
- Above 5 kb
- Protein Markers, by Ladder Size
- Below 10 kilo Dalton (kDa)
- 10 k Da to 100 kDa
- 100 k Da to 200 kDa
- Above 200 kDa
- RNA Markers
Molecular Weight Marker Market, by Type
- Prestained Markers
- Unstained Markers
- Specialty Markers
Molecular Weight Marker Market, by Application
- Nucleic Acid Applications, by Type
- PCR
- Sequencing
- Northern Blotting
- Southern Blotting
- Molecular cloning
- Other Nucleic Acid Applications
- Proteomics Applications, by Type
- Western Blotting
- Gel extraction
- Other Proteomics Applications
Molecular Weight Marker Market, by End user
- Academic Research Institutes
- Pharmaceutical and Biotechnology Companies
- Contract Research Organizations
- Other End Users
Molecular Weight Marker Market, by Region
- North America
- Europe
- Asia
- Rest of the World (RoW)
Molecular weight markers are widely used in life science research. Increased research and development spending by biotechnology companies, government and private sector funding for research and growing partnership between academic, biotechnology & pharmaceutical companies for molecular research will drive the growth of the this market.
This report segments the global market by products, applications, and end users. The global market product segment comprises of DNA, Protein and RNA markers markets. DNA molecular weight markers by size consist of 5 segments: below 50 base pair (bp), 50 bp to 100 bp, 100 bp to 1 kilo base pair (kb), 1 kb to 5 kb and above 5 kb. The protein markers are further categorized into 4 segments as below 10 kilo Dalton (kDa), 10 kDa to 100 kDa, 100 kDa to 200 kDa and above 200 kDa markers. The DNA markers segment had the largest share of the this market in 2014. This market is further divided on the basis of type, and consists of 3 segments, namely, prestained, unstained and specialty markers.
The application segments included in this report are nucleic acid applications and protein applications. The nucleic acid applications had the largest share of the market in 2014. The nucleic acid application subsegments included in the report are PCR, sequencing, northern blotting, southern blotting, molecular cloning, and other nucleic acid On the other hand, the protein applications segment is subsegmented into western blotting, gel extraction, other protein applications. The end user segments included in the report are academic research institutes, biotechnology and pharmaceutical companies, contract research organizations and other end users. Academic research institutes are the largest end-user segment of this market. The geographic segments included in this report are North America, Europe, Asia and Rest of the World (RoW). The geographic analysis reveals that North America accounted for the largest share in the global molecular weight marker market in 2014. Asia regional segment, on the other hand, is expected to register a faster growth from 2014 to 2019.
The major players of this Molecular Weight Marker Market include F Hoffmann-La Roche AG (Switzerland), Thermo Fisher Scientific Inc. (U.S.), Agilent Technologies (U.S.), Sigma-Aldrich (U.S.), Affymetrix, Inc.(U.S.), QIAGEN (Netherlands), Takara Bio Inc. (Japan), Bio-Rad Laboratories (U.S.), Promega Corporation (U.S.) and New England Biolabs (U.S.).
Global Molecular Weight Marker Market Snapshot, 2014 ($Million)
Source: MarketsandMarkets analysis
Source: MarketsandMarkets analysis
Source: MarketsandMarkets analysis
Source: MarketsandMarkets analysis
 Exclusive indicates content/data unique to MarketsandMarkets and not available with any competitors.
Table of Contents
1 Introduction (Page No. - 17)
1.1 Objectives of the Study
1.2 Market Definition
1.3 Market Scope
1.3.1 Markets Covered
1.3.2 Years Considered for the Study
1.4 Currency
1.5 Stakeholders
2 Research Methodology (Page No. - 21)
2.1 Market Size Estimation
2.2 Market Breakdown and Data Triangulation
2.3 Market Share Estimation
2.3.1 Key Data From Secondary Sources
2.3.2 Key Data From Primary Sources
2.3.3 Assumptions
3 Executive Summary (Page No. - 29)
4 Premium Insights (Page No. - 34)
4.1 Molecular Weight Marker Market to Grow at A High Rate
4.2 Life Cycle Analysis, By Region
5 Market Overview (Page No. - 39)
5.1 Introduction
5.2 Market Segmentation
5.2.1 Molecular Weight Marker Market, By Product
5.2.2 Molecular Weight Marker Market, By Type
5.2.3 Molecular Weight Marker Market, By Application
5.2.4 Molecular Weight Marker Market, By Enduser
5.3 Market Dynamics
5.3.1 Drivers
5.3.1.1 Increased Research and Development Spending By Biotechnology Companies
5.3.1.2 Research Funding in Public Sector
5.3.1.3 Proteomics and Genomics Technologies Research
5.3.1.4 Growing Partnership Between Academia and Biotechnology & Pharmaceutical Companies for Molecular Research
5.3.2 Restraints
5.3.2.1 High Degree of Consolidation Restricts the Entry of New Firms
5.3.2.2 Lack of Skilled Professionals
5.3.3 Opportunities
5.3.3.1 Emerging and Untapped Markets
6 Industry Trends (Page No. - 47)
6.1 Introduction
6.2 Porter�s Five Forces Analysis
6.2.1 Threat From New Entrants
6.2.2 Threat From Substitutes
6.2.3 Bargaining Power of Buyers
6.2.4 Bargaining Power of Suppliers
6.2.5 Competitive Rivalry Among Existing Players
6.3 Strategic Benchmarking
6.3.1 Expansion
6.4 Supply Chain Analysis
6.4.1 Key Influencers
7 Molecular Weight Marker Market, By Product (Page No. - 53)
7.1 Introduction
7.2 Product Segmentation
7.2.1 DNA Markers
7.2.2 Protein Markers
7.2.3 RNA Markers
7.3 Market By Type
7.3.1 Prestained Markers
7.3.2 Unstained Markers
7.3.3 Specialty Markers
8 Molecular Weight Marker Market, By Application (Page No. - 70)
8.1 Introduction
8.2 Nucleic Acid Applications
8.2.1 Molecular Cloning
8.2.2 Polymerase Chain Reaction (PCR)
8.2.3 Sequencing
8.2.4 Northern Blotting
8.2.5 Southern Blotting
8.2.6 Other Applications
8.3 Protein Applications
9 Molecular Weight Marker Market, By End User (Page No. - 86)
9.1 Introduction
9.2 Academic Research Institutes
9.3 Pharmaceutical and Biotechnology Companies
9.4 Contract Research Organizations
9.5 Other End Users
10 Geographic Analysis (Page No. - 96)
10.1 Introduction
10.2 North America
10.3 Europe
10.4 Asia
10.5 Rest of the World (ROW)
11 Competitive Landscape (Page No. - 138)
11.1 Introduction
11.2 Market Share Analysis: Molecular Weight Marker Market
11.3 Competitive Situation and Trends
11.3.1 Expansions
11.3.2 Other Developments
11.3.3 Agreements and Joint Ventures
11.3.4 Acquisitions
12 Company Profiles (Page No. - 150)
12.1 Introduction
12.2 Agilent Technologies
12.2.1 Business Overview
12.2.2 Product Portfolio
12.2.3 Recent Developments
12.2.4 MNM View
12.2.4.1 Financial Analysis
12.2.4.2 Strategic Analysis
12.3 Bio-Rad Laboratories
12.3.1 Business Overview
12.3.2 Product Portfolio
12.3.3 Recent Developments
12.3.4 MNM View
12.3.4.1 Financial Analysis
12.3.4.2 Strategic Analysis
12.4 F. Hoffmann-La Roche Ltd.
12.4.1 Business Overview
12.4.2 Product Portfolio
12.4.3 Recent Developments
12.4.4 MNM View
12.4.4.1 Financial Analysis
12.4.4.2 Strategic Analysis
12.5 Sigma-Aldrich Corporation
12.5.1 Business Overview
12.5.2 Product Portfolio
12.5.3 Recent Developments
12.5.4 MNM View
12.5.4.1 Financial Analysis
12.5.4.2 Strategic Analysis
12.6 Thermo Fisher Scientific, Inc.
12.6.1 Business Overview
12.6.2 Product Portfolio
12.6.3 Recent Developments
12.6.4 MNM View
12.6.4.1 Financial Analysis
12.6.4.2 Strategic Analysis
12.7 Affymetrix, Inc.
12.7.1 Business Overview
12.7.2 Product Portfolio
12.7.3 Key Strategy
12.7.4 Recent Developments
12.8 New England Biolabs, Inc.
12.8.1 Business Overview
12.8.2 Product Portfolio
12.8.3 Key Strategy
12.8.4 Recent Development
12.9 Promega Corporation
12.9.1 Business Overview
12.9.2 Product Portfolio
12.9.3 Key Strategy
12.9.4 Recent Developments
12.1 Qiagen N.V.
12.10.1 Business Overview
12.10.2 Product Portfolio
12.10.3 Key Strategies
12.10.4 Recent Developments
12.11 Takara Bio, Inc.
12.11.1 Business Overview
12.11.2 Product Portfolio
12.11.3 Key Strategy
12.11.4 Recent Development
13 Appendix (Page No. - 182)
13.1 Insights of Industry Experts
13.2 Discussion Guide
13.3 Introducing RT: Real Time Market Intelligence
13.4 Available Customizations
13.5 Related Reports
List of Tables (71 Tables)
Table 1 Molecular Weight Size Markers Market Summary
Table 2 Market Developments Between 2011 and 2014
Table 3 Global Market Size, By Product, 2012�2019 ($Million)
Table 4 DNA Markers Offered By Market Leaders
Table 5 Global DNA Molecular Weight Marker Market Size, By Region, 2012�2019 ($Million)
Table 6 Global DNA Molecular Weight Marker Market Size, By Ladder Size, 2012�2019 ($Million)
Table 7 Commonly Used Protein Components of DNA Markers
Table 8 Global Protein Molecular Weight Marker Market Size, By Region, 2012�2019 ($Million)
Table 9 Protein Market Size, By Ladder Size, 2012�2019 ($Million)
Table 10 Global RNA Market Size, By Region, 2012�2019 ($Million)
Table 11 Global Molecular Weight Marker Market Size, By Type, 2012�2019 ($Million)
Table 12 Global Prestained Markers Market Size, By Region, 2012�2019 ($Million)
Table 13 Global Unstained Markers Market Size, By Region, 2012�2019 ($Million)
Table 14 Global Specialty Markers Market Size, By Region, 2012�2019 ($Million)
Table 15 Molecular Weight Marker Market Size, By Application, 2012�2019 ($Million)
Table 16 Market Size for Nucleic Acid Applications, By Type, 2012�2019 ($Million)
Table 17 Market Size for Nucleic Acid Applications, By Region, 2012�2019 ($Million)
Table 18 Market Size for Molecular Cloning Applications, By Region, 2012�2019 ($Million)
Table 19 Market Size for PCR Applications, By Region, 2012�2019 ($Million)
Table 20 Market Size for Sequencing Applications, By Region, 2012�2019 ($Million)
Table 21 Market Size for Northern Blotting Applications, By Region, 2012�2019 ($Million)
Table 22 Market Size for Southern Blotting Applications, By Region, 2012�2019 ($Million)
Table 23 Molecular Weight Marker Market Size for Other Applications, By Region, 2012�2019 ($Million)
Table 24 Market Size for Protein Applications, By Type, 2012�2019 ($Million)
Table 25 Market Size for Protein Applications, By Region, 2012�2019 ($Million)
Table 26 Market Size, By End User, 2012�2019 ($Million)
Table 27 Market Size for Academic Research Institutes, By Region, 2012�2019 ($Million)
Table 28 Molecular Weight Marker Market Size for Pharmaceutical and Biotechnology Companies, By Region, 2012�2019 ($Million)
Table 29 Market Size for Contract Research Organizations, By Region, 2012�2019 ($Million)
Table 30 Market Size for Other End Users, By Region, 2012�2019 ($Million)
Table 31 Market Size, By Region, 2012�2019 ($Million)
Table 32 North America: Molecular Weight Marker Market Size, By Country, 2012�2019 ($Million)
Table 33 North America: Market Size, By Product, 2012�2019 ($Million)
Table 34 North America: DNA Markers Market Size, By Ladder Size, 2012�2019 ($Million)
Table 35 North America: Protein Markers Market Size, By Ladder Size, 2012�2019 ($Million)
Table 36 North America: Market Size, By Type, 2012�2019 ($Million)
Table 37 North America: Market Size, By Application, 2012�2019 ($Million)
Table 38 North America: Market Size for Nucleic Acid Applications, By Type, 2012�2019 ($Million)
Table 39 North America: Market Size for Protein Applications, By Type, 2012�2019 ($Million)
Table 40 North America: Market Size, By End User, 2012�2019 ($Million)
Table 41 Europe: Molecular Weight Marker Market Size, By Country, 2012�2019 ($Million)
Table 42 Europe: Market Size, By Product, 2012�2019 ($Million)
Table 43 Europe: DNA Markers Market Size, By Ladder Size, 2012�2019 ($Million)
Table 44 Europe: Protein Markers Market Size, By Ladder Size, 2012�2019 ($Million)
Table 45 Europe: Market Size, By Type, 2012�2019 ($Million)
Table 46 Europe: Molecular Weight Marker Market Size, By Application, 2012�2019 ($Million)
Table 47 Europe: Market Size for Nucleic Acid Applications, By Type, 2012�2019 ($Million)
Table 48 Europe: Market Size for Protein Applications, By Type, 2012�2019 ($Million)
Table 49 Europe: Market Size, By End User, 2012�2019 ($Million)
Table 50 Asia: Molecular Weight Marker Market Size, By Country, 2012�2019 ($Million)
Table 51 Asia: Market Size, By Product, 2012�2019 ($Million)
Table 52 Asia: DNA Markers Market Size, By Ladder Size, 2012�2019 ($Million)
Table 53 Asia: Protein Markers Market Size, By Ladder Size, 2012�2019 ($Million)
Table 54 Asia: Market Size, By Type, 2012�2019 ($Million)
Table 55 Asia: Market Size, By Application, 2012�2019 ($Million)
Table 56 Asia: Market Size for Nucleic Acid Applications, By Type, 2012�2019 ($Million)
Table 57 Asia: Market Size for Protein Applications, By Type, 2012�2019 ($Million)
Table 58 Asia: Market Size, By End User, 2012�2019 ($Million)
Table 59 ROW: Molecular Weight Marker Market Size, By Country, 2012�2019 ($Million)
Table 60 ROW: Market Size, By Product, 2012�2019 ($Million)
Table 61 ROW: DNA Markers Market Size, By Ladder Size, 2012�2019 ($Million)
Table 62 ROW: Protein Markers Market Size, By Ladder Size, 2012�2019 ($Million)
Table 63 ROW: Protein Markers Market Size, By Type, 2012�2019 ($Million)
Table 64 ROW: Market Size, By Application, 2012�2019 ($Million)
Table 65 ROW: Market Size for Nucleic Acid Applications, By Type, 2012�2019 ($Million)
Table 66 ROW: Protein Markers Market Size for Protein Applications, By Type, 2012�2019 ($Million)
Table 67 ROW: Market Size, By End User, 2012�2019 ($Million)
Table 68 Expansions, 2011�2014
Table 69 Other Developments, 2011�2014
Table 70 Agreements and Joint Ventures, 2011�2014
Table 71 Acquisitions, 2011�2014
List of Figures (109 Figures)
Figure 1 Global Molecular Weight Marker Market
Figure 2 Research Methodology
Figure 3 Market Size Estimation Methodology: Bottom-Up Approach
Figure 4 Market Size Estimation Methodology: Top-Down Approach
Figure 5 Breakdown of Primary Interviews: By Company Type, Designation, and Region
Figure 6 Data Triangulation Methodology
Figure 7 DNA Markers Dominate the Molecular Weight Marker Market
Figure 8 Prestained Markers is the Largest and Fastest-Growing Segment, By Type, in 2014
Figure 9 Nucleic Acid is the Fastest-Growing Application Segment in 2014
Figure 10 Academic Research Institutes Will Dominate the Molecular Weight Marker Market By 2019
Figure 11 Asia is Expected to Grow at the Highest Rate During the Forecast Period
Figure 12 Increasing Research and Development Activities and Rising Public Funding Are Important Growth Drivers
Figure 13 DNA Markers to Dominate the Molecular Weight Marker Market
Figure 14 Asia to Grow at the Highest Rate During the Forecast Period
Figure 15 Asian Market Showcases Lucrative Growth Opportunities
Figure 16 Market Segmentation: By Product
Figure 17 Market Segmentation: By Type
Figure 18 Market Segmentation: By Application
Figure 19 Market Segmentation: By End User
Figure 20 Increased Research and Development Spending Will Be the Primary Growth Driver for This Market
Figure 21 Porter�s Five Forces Analysis
Figure 22 Most Market Players Adopted the Organic Growth Strategy of Expansions Between 2011 and 2014
Figure 23 Supply Chain Analysis
Figure 24 Global Market, By Product
Figure 25 Global Market, By Product, 2012�2019 ($Million)
Figure 26 Global DNA Market, By Region, 2012�2019 ($Million)
Figure 27 DNA Markers Market Segmentation, By Ladder Size
Figure 28 Global DNA Markers Market, By Ladder Size, 2012�2019 ($Million
Figure 29 Global Protein Molecular Weight Marker Market, By Region, 2012�2019 ($Million)
Figure 30 Protein Markers Market Segmentation, By Ladder Size
Figure 31 Global Protein Molecular Weight Marker Market, By Ladder Size, 2012�2019 ($Million)
Figure 32 Global RNA Molecular Weight Marker Market, By Region, 2012�2019 ($Million)
Figure 33 Global Market, By Type
Figure 34 Global Market, By Type, 2012�2019 ($Million)
Figure 35 Global Prestained Markers Market, By Region, 2014�2019 ($Million)
Figure 36 Global Unstained Markers Market, By Region, 2014�2019 ($Million)
Figure 37 Global Specialty Markers Market, By Region, 2014�2019 ($Million)
Figure 38 Global Market, By Application
Figure 39 Global Market, By Application, 2014 ($Million)
Figure 40 Sequencing Will Be the Fastest-Growing Application Segment
Figure 41 North America Commands the Largest Share of the Nucleic Acid Applications Segment
Figure 42 North America to Be the Largest and Fastest-Growing Regional Segment for Molecular Cloning
Figure 43 North America to Be the Fastest-Growing Regional Segment for Molecular Weight Marker Used in PCR
Figure 44 Largest Growth for Molecular Weight Marker Used in Sequencing to Take Place in North America
Figure 45 North America Commands the Largest Share in the Northern Blotting Application Segment
Figure 46 Molecular Weight Marker Market for Southern Blotting Applications to Grow at the Highest Rate in Asia
Figure 47 North America Had the Largest Share in Molecular Weight Marker Market for Other Applications
Figure 48 Gel Extraction Commands the Largest Share in the Molecular Weight Marker Market for Protein Applications
Figure 49 Asia Will Grow at the Fastest Rate in the Molecular Weight Marker Market for Protein Applications
Figure 50 Market Segmentation, By End User
Figure 51 Market Size, By End User, 2014 vs. 2019 ($Million)
Figure 52 Public Sector Research Funding is Driving the Growth of the Academic Research Institutes Segment
Figure 53 Market Size for Academic Research Institutes, By Region, 2014 vs. 2019 ($Million)
Figure 54 Increasing Number of Biotechnology Patents Granted is Enhancing Growth of the Pharmaceutical & Biotechnology Companies Segment
Figure 55 Market Size for Pharmaceutical and Biotechnology Companies, By Region, 2014 vs. 2019 ($Million)
Figure 56 Market Size for Contract Research Organizations, By Region, 2014 vs. 2019 ($Million)
Figure 57 Market Size for Other End Users, By Region, 2014 vs. 2019 ($Million)
Figure 58 Geographic Snapshot (2014)
Figure 59 Global Market, By Region (Market Size and Growth Rate), 2014 vs. 2019
Figure 60 North America: Market Size, By Country (Market Size and Growth Rate), 2014 vs. 2019
Figure 61 North America: Market Snapshot
Figure 62 DNA Markers Are Estimated to Be the Largest Product Segment in North America in 2014
Figure 63 North America: 1 to 5 Kb DNA Markers to Grow at the Highest CAGR From 2014 to 2019
Figure 64 North America: Protein Markers Market Size, By Ladder Size (Market Size and Growth Rate), 2014 vs. 2019
Figure 65 North America: Molecular Weight Marker Market Size, By Type (Market Size and Growth Rate), 2014 vs. 2019
Figure 66 North America: Market Size, By Application (Market Size and Growth Rate), 2014 vs. 2019
Figure 67 North America: Market Size for Nucleic Acid Applications, By Type (Market Size and Growth Rate), 2014 vs. 2019
Figure 68 North America: Market Size for Protein Applications, By Type (Market Size and Growth Rate), 2014 vs. 2019
Figure 69 Academic Research Institutes to Account for the Largest Share of the Molecular Weight Marker End-Users Market in North America
Figure 70 Europe: Molecular Weight Marker Market, By Country (Market Size and Growth Rate), 2014 vs. 2019
Figure 71 DNA Markers Are Estimated to Be the Largest Product Segment in Europe in 2014
Figure 72 Europe: 1 to 5 Kb DNA Markers to Grow at the Highest CAGR From 2014 to 2019
Figure 73 Europe: Protein Markers Market Size, By Ladder Size (Market Size and Growth Rate), 2014 vs. 2019
Figure 74 Europe: Market, By Type (Market Size and Growth Rate), 2014 vs. 2019
Figure 75 Europe: Market Size, By Application (Market Size and Growth Rate), 2014 vs. 2019
Figure 76 Europe: Market Size for Nucleic Acid Applications, By Type (Market Size and Growth Rate), 2014 vs. 2019
Figure 77 Europe: Market Size for Protein Applications, By Type (Market Size and Growth Rate), 2014 vs. 2019
Figure 78 Academic Research Institutes to Account for the Largest Share of the Molecular Weight Marker End-Users Market in Europe
Figure 79 Asia: Molecular Weight Marker Market, By Country (Market Size and Growth Rate), 2014 vs. 2019
Figure 80 Asia: Market Snapshot
Figure 81 DNA Markers Are Estimated to Be the Largest Product Segment in Asia in 2014
Figure 82 Asia: DNA Markers to Grow at the Highest CAGR From 2014 to 2019
Figure 83 Asia: Protein Markers Market Size, By Ladder Size (Market Size and Growth Rate), 2014 vs. 2019
Figure 84 Asia: Market Size, By Type (Market Size and Growth Rate), 2014 vs. 2019
Figure 85 Asia: Market Size, By Application (Market Size and Growth Rate), 2014 vs. 2019
Figure 86 Asia: Market Size for Nucleic Acid Applications, By Type (Market Size and Growth Rate), 2014 vs. 2019
Figure 87 Asia: Market Size for Protein Applications, By Type (Market Size and Growth Rate), 2014 vs. 2019
Figure 88 Academic Research Institutes to Account for the Largest Share of the Molecular Weight Marker End-Users Market in Asia
Figure 89 ROW: Molecular Weight Marker Market, By Country (Market Size and Growth Rate), 2014 vs. 2019
Figure 90 DNA Markers Are Estimated to Be the Largest Product Segment in the ROW in 2014
Figure 91 ROW: DNA Markers to Grow at the Highest CAGR From 2014 to 2019
Figure 92 ROW: Protein Markers Market Size, By Ladder Size (Market Size and Growth Rate), 2014 vs. 2019
Figure 93 ROW: Market Size, By Type (Market Size and Growth Rate), 2014 vs. 2019
Figure 94 ROW: Market Size, By Application (Market Size and Growth Rate), 2014 vs. 2019
Figure 95 ROW: Market Size for Nucleic Acid Applications, By Type (Market Size and Growth Rate), 2014 vs. 2019
Figure 96 ROW: Market Size for Protein Applications, By Type (Market Size and Growth Rate), 2014 vs. 2019
Figure 97 Academic Research Institutes to Account for the Largest Share of the Molecular Weight Marker End-Users Market in the ROW
Figure 98 Product Innovations is the Key Strategy Adopted By Players in Market
Figure 99 Global Market Share Analysis, By Key Player, 2014
Figure 100 Competitive Situation and Trends: Expansion is the Key Growth Strategy
Figure 101 Geographic Revenue Mix of the Top 5 Market Players
Figure 102 Agilent Technologies: Company Snapshot
Figure 103 Bio-Rad Laboratories: Company Snapshot
Figure 104 F. Hoffmann-La Roche Ltd.: Company Snapshot
Figure 105 Sigma-Aldrich Corporation: Company Snapshot
Figure 106 Thermo Fisher Scientific, Inc.: Company Snapshot
Figure 107 Affymetrix, Inc.: Company Snapshot
Figure 108 Qiagen N.V.: Company Snapshot
Figure 109 Takara Bio, Inc.: Company Snapshot

 Generating Response ...


Growth opportunities and latent adjacency in Molecular Weight Marker Market