Middle East and Africa Power Rental Market by End-user (Utilities, Construction, Oil & gas, and Others (Industrial, Shipping, Quarrying & Mining, and Events)), by Fuel Type (Diesel & Gas) and by Region - Trends and Forecast to 2019


[184 Pages Report] Each region has been analyzed with respect to its market trends, growth, and future prospects in the Middle East and Africa power rental market. This report basically aims to estimate the power rental market for the Middle East and Africa from 2014 to 2019.
The Middle East and Africa power rental market size is estimated to reach $9,048.25 million by 2019 from $3,942.07 million in 2014. The major factors responsible for driving the growth of this market include the increasing demand of power in the respective regions.
The Middle East market remains the largest market for power rental. Widespread construction and developmental activities are driving growth of the power rental market. The permanent power producers� inability to meet the power demand especially during extremely hot weather conditions, are considered as opportunities for the Middle East and Africa power rental market. Rising imports of low cost Chinese generators and upcoming power generation projects through renewable sources such as solar, wind and biomass energy in the Middle East and Africa can limit the growth of power rental market in the region.
Wear and tear of the generators and decrease in global oil prices are major challenges for the power rental market in the Middle East and Africa.
Middle East and Africa Power Rental Projected Market Size, by Type (2019)
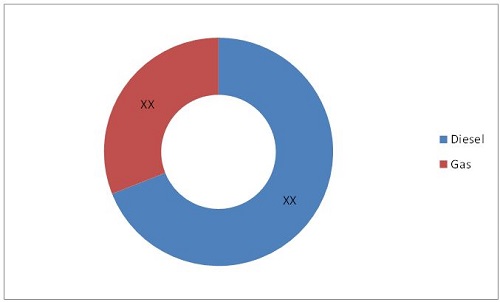
Source: Related Research Publications and MarketsandMarkets Analysis
The report analyzes the power rental market for the regions of the Middle East and Africa. The report also provides a market overview of power rental market of the Middle East and Africa by different types. Among these types, diesel is the most preferred fuel for igniting the generators.
For this report, the major players in the market are identified through secondary and primary research, based on which their market shares are evaluated. This includes a study of the annual reports of top market players and interviews with key opinion leaders such as the CEOs, directors, and marketing executives. The market size for various types of oilfield service providers are determined and evaluated using primary and secondary research. The market data is available from 2012 to 2019 at a CAGR from 2014 to 2019.
Customer Interested in this report also can view
Temporary Power Market by Generator Rating (Less than 80 kW, 81-280kW, 281-600 kW), End Use (Events, Utilities, Oil & Gas, Construction, Mining, Manufacturing, & Shipping), Fuel Type (Diesel, Gas, & Others (Duel Fuel & HFO)) - Global Forecast to 2021
Power Rental Market by Fuel (Diesel, Gas, Duel Fuel & HFO), Power Rating, End User (Utilities, Oil & Gas, Events, Construction, Mining, Manufacturing, Shipping), Application (Peak Shaving, Base Load, Stand by), by Region - Global Trends & Forecast to 2021
To cater the increasing power demand across the Middle East and Africa, signing supply contracts is adopted by maximum industry players as a key strategy in order to achieve growth in the power rental market. Permanent power producers� inability to meet the power demand at regular periods and especially during extremely hot weather conditions, are considered as opportunities for the Middle East and Africa power rental market. This market is estimated to reach $9,048.25 million at a CAGR of 18.08% from 2014 to 2019.
The power rental market is defined as the revenue earned either through renting generators or from a temporary power plant. Earlier, power rental companies would rent out generators, the maintenance responsibility for which would have to borne by company itself, and the cost earned from renting such generators generated revenue for the power rental market. Now, power rental companies build and maintain temporary power plants and charge users on the basis of duration, capacity build, and electricity units supplied.
The power rental market in the Middle East and African region has a significant growth rate, as it is an economically sustainable option to rent out generators over installing an IPP for the same purpose.
Growing population, urbanization, and customized standards of living are seen improving in the Middle Eastern and African countries which are in turn likely to increase the demand for power in the coming years. Grid networks being poor or erratic in certain areas, power rentals would emerge as a feasible option to meet end-user requirements. This has created many opportunities for rental power service providers that can offer accelerated turnkey power solutions.
Saudi Arabia is the largest market for power rental in the Middle East and Africa, owing to the increased construction activities. UAE and South Africa are also one of the attractive markets for the power rental industry in the regions of the Middle East and Africa.
Middle East And Africa Market Share, by End-Users, 2019, ($Million)
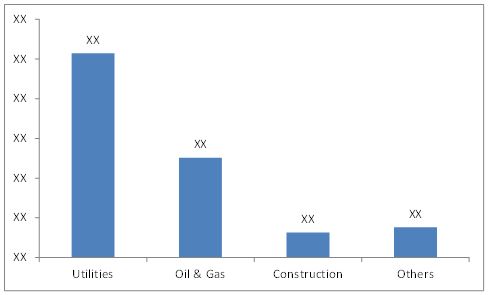
Note: Other end users include Industrial, Shipping, Mining, Events, universities, government, hospitals
Source: Related research publications, and MarketsandMarkets Analysis
Currently, utilities sector dominate the power rental market of the Middle East and Africa in the end-user segment. Oil & gas market occupy the second largest market share in the oil rich regions of the Middle East and Africa. Construction segment is also one of the largest growing segments in the power rental industry.
 Exclusive indicates content/data unique to MarketsandMarkets and not available with any competitors.
Table of Contents
1 Introduction (Page No. - 15)
1.1 Objectives of the Study
1.2 Market Definition
1.3 Market Scope
1.3.1 Markets Covered
1.3.2 Years Considered for the Study
1.4 Currency & Pricing
1.5 Package Size
1.6 Stakeholders
2 Research Methodology (Page No. - 18)
2.1 Introduction
2.2 Market Size Estimation
2.3 Market-Breakdown Using Primary and Secondary Sources
2.3.1 Market Breakdown and Data Triangulation
2.4 Market Size Estimation
2.4.1 Key Data Taken From Secondary Sources
2.4.2 Key Data Taken From Primary Sources
2.4.3 Assumptions
3 Executive Summary (Page No. - 24)
4 Premium Insights (Page No. - 29)
4.1 Market Opportunities
4.2 Middle East & Africa Power Rental Market � Top Three End-User Segment
4.3 Power Rental Market in the Middle East & Africa, 2014
4.4 Diesel & Gas Gensets Market Share (Value), by Fuel Type: 2014 vs. 2019
5 Market Overview (Page No. - 32)
5.1 Introduction
5.2 Middle East & Africa Power Rental Market, by End-User
5.3 Middle East & Africa Power Rental Market, by Type
5.4 Middle East & Africa Power Rental Market, by Region
5.5 Market Dynamics
5.5.1 Drivers
5.5.1.1 Increase in Demand of Power
5.5.1.2 Major Upcoming Events
5.5.1.3 Lack of Infrastructure
5.5.2 Restraints
5.5.2.1 Increased in Number of Ipps and Permanent Power Plants
5.5.2.2 Low-Priced Generator Are Imported From China
5.5.2.3 Energy Efficiency and Energy Conservation
5.5.3 Opportunities
5.5.3.1 Investment in the Power Rental Industry
5.5.3.2 New Technology for Temporary Power Equipment
5.5.4 Challenges
5.5.4.1 Wear and Tear of Generators
5.5.4.2 Decrease in Global Oil Prices
5.5.5 Winning Imperatives
5.5.5.1 Inability of Permanent Power Producers to Meet the Demand
6 Industry Trends (Page No. - 40)
6.1introduction
6.2 Value Chain Analysis
6.3 Supply Chain Analysis
6.4 Porter�s Five Forces Analysis
6.4.1 Threat of Substitutes
6.4.2 Threat of New Entrants
6.4.3 Bargaining Power of Buyers
6.4.4 Bargaining Power of Suppliers
6.4.5 Industry Competition
7 Middle East & Africa Power Rental Market, by Fuel Type (Page No. - 46)
7.1 Introduction
7.2 Middle East & Africa Power Rental Market, by Fuel Type
7.3 Diesel Generator Rental Market
7.3.1 Middle East Diesel Generator Rental Market
7.3.2 Africa Diesel Generator Rental Market
7.4 Gas Generator Rental Market
7.4.1 Middle East Gas Generator Rental Market
7.4.2 Africa Gas Generator Rental Market
8 Middle East & Africa Power Rental Market, by End-User (Page No. - 57)
8.1 Introduction
8.2 Middle East and Africa Power Rental Market, by End-User
8.3 Utilities
8.4 Oil & Gas
8.5 Construction
8.6 Other End-Users
8.7 Industrial
8.8 Mining
8.9 Shipping
8.10 Events
8.11 Others
9 Middle East & Africa Power Rental Market, by Region (Page No. - 91)
9.1 Introduction
9.2 Middle East & Africa Power Rental Market, by Region
9.3 Middle East Power Rental Market, by Fuel Type
9.3.1 Middle East Power Rental Market, by Region
9.3.2 Iran Power Rental Market, by Fuel Type
9.3.3 Oman Power Rental Market, by Fuel Type
9.3.4 Qatar Power Rental Market, by Fuel Type
9.3.5 Saudi Arabia Power Rental Market, by Fuel Type
9.3.6 UAE Power Rental Market, by Fuel Type
9.3.7 Other Middle East, Power Rental Market, by Fuel Type
9.3.8 Africa Power Rental Market, by Fuel Type
9.4 Africa Power Rental Market, by Region
9.4.1 Algeria Power Rental Market, by Fuel Type
9.4.2 Egypt Power Rental Market, by Fuel Type
9.4.3 Libya Power Rental Market, by Fuel Type
9.4.4 Nigeria Power Rental Market, by Fuel Type
9.4.5 Other Africa Power Rental, by Fuel Type
9.4.6 Middle East & Africa Power Rental Market, by End-User
9.5 Middle East Power Rental Market, by End-User
9.6 Middle East Power Rental Market, by Other End-User
9.6.1 Iran Power Rental Market, by End-User
9.6.2 Oman Power Rental Market, by End-User
9.6.3 Qatar Power Rental Market, by End-User
9.6.4 Saudi Arabia Power Rental Market, by End-User
9.6.5 UAE Power Rental Market, by End-User
9.6.6 Other Middle East Countries, Power Rental Market, by End-User
9.6.7 Africa Power Rental Market, by End-Users
9.7 Africa Power Rental Market, by Other End-User
9.7.1 Algeria Power Rental Market, by End-User
9.7.2 Angola Power Rental Market, by End-User
9.7.3 Egypt Power Rental Market, by End-User
9.7.4 Libya Power Rental Market, by End-User
9.7.5 Nigeria Power Rental Market, by End-User
9.7.6 South Africa Power Rental Market, by End-User
9.7.7 Other African Countries Power Rental Market, by End-User
10 Competitive Landscape (Page No. - 117)
10.1 Overview
10.2 Market Share Analysis, 2013
10.3 Competitive Situation & Trends
10.3.1 Supply Contracts
10.3.2 Expansions
10.3.3 Agreements
10.3.4 Awards & Recognition
10.3.5 New Product Launch
10.3.6 Joint Venture
10.3.7 Partnership
10.3.8 Other Developments
11 Company Profiles (Page No. - 146)
11.1 Introduction
11.2 Aggreko Plc
11.2.1 Business Overview
11.2.2 Products
11.2.3 Recent Developments
11.2.4 Key Strategy
11.2.5 SWOT Analysis
11.2.6 MNM View
11.3 Altaaqa Global
11.3.1 Business Overview
11.3.2 Products & Services
11.3.3 Recent Developments
11.3.4 Key Strategy
11.3.5 SWOT Analysis
11.3.6 MNM View
11.4 Apr Energy Plc.
11.4.1 Business Overview
11.4.2 Products
11.4.3 Recent Developments
11.4.4 Key Strategy
11.4.5 SWOT Analysis
11.4.6 MNM View
11.5 Bryne Equipment Rental LLC.
11.5.1 Business Overview
11.5.2 Products
11.5.3 Developments
11.5.4 Key Strategy
11.6 Cummins Inc.
11.6.1 Business Overview
11.6.2 Products
11.6.3 Recent Developments
11.6.4 Key Strategy
11.6.5 SWOT Analysis
11.6.6 MNM View
11.7 Hertz Equipment Rental
11.7.1 Business Overview
11.7.2 Products
11.7.3 Recent Developments
11.7.4 Key Strategy
11.8 Jubaili Bros. LLC
11.8.1 Business Overview
11.8.2 Products
11.8.3 Developments
11.8.4 Key Strategy
11.9 Rental Solutions & Services LLC
11.9.1 Business Overview
11.9.2 Products
11.9.3 Developments
11.9.4 Key Strategy
11.9.5 SWOT Analysis
11.9.6 MNM View
11.10 Sakr Power Group
11.10.1 Business Overview
11.10.2 Products
11.10.3 Developments
11.10.4 Key Strategy
11.11 Speedy Hire Plc.
11.11.1 Business Overview
11.11.2 Products
11.11.3 Developments
11.11.4 Key Strategy
12 Appendix (Page No. - 179)
12.1 Insights of Industry Experts
12.2 Discussion Guide
12.3 Introducing RT: Real Time Market Intelligence
12.4 Available Customizations
12.5 Related Reports
List of Tables
Table 1 Lack of Infrastructure and Major Upcoming Events Is Driving Growth of the Middle East & Africa Power Rental Market
Table 2 Increased Installation of Ipps and Permanent Power Plants Are Restraining the Growth of the Middle East & Africa Power Rental Market
Table 3 Investment in Power Rental Industry and New Technology for Temporary Power Requirement
Table 4 Decrease in Global Oil Prices Can Be A Challenge for the Power Rental Industry
Table 5 Oil Production: Middle East (Thousand Barrels Daily)
Table 6 Oil Production: Africa (Thousand Barrels Daily)
Table 7 Middle East & Africa Power Rental Market Size, by Fuel Type, 2014-2019 ($Million)
Table 8 Middle East & Africa Power Rental Market Size, by Diesel Type, 2014-2019 ($Million)
Table 9 Middle East Power Rental Market Size, by Diesel Type, 2014-2019 ($Million)
Table 10 Africa Power Rental Market Size, by Diesel Type, 2014-2019 ($Million)
Table 11 Natural Gas Production: Middle East (Million Tonnes Oil Equivalent)
Table 12 Natural Gas Production: Africa (Million Tonnes Oil Equivalent)
Table 13 Middle East & Africa Power Rental Market Size, by Gas Type, 2014-2019 ($Million)
Table 14 Middle East Power Rental Market Size, by Gas Type, 2014-2019 ($Million)
Table 15 Africa Power Rental Market Size, by Gas Type, 2014-2019 ($Million)
Table 16 Middle East and Africa Power Rental Market, by End-User, 2014-2019 ($Million)
Table 17 Average Retail Price of Electricity, by End-User, 2010-2014, (Cents Per Kilowatt-Hour)
Table 18 The Middle East Set to Outpace Africa in Terms of Growth in the Utilities Segment of the Power Rental Market
Table 19 Middle East and Africa Power Rental Market for the Utilities Segment, 2014-2019 ($Million)
Table 20 Middle East: Net Electricity Consumption, by Country, 2010-2012, (Billion Kilowatt Hours)
Table 21 Middle East: Power Rental Market for the Utilities Segment, by Country, 2014-2019 ($Million)
Table 22 Africa: Net Electricity Consumption, by Country, 2010-2012, (Billion Kilowatt Hours)
Table 23 Africa: Power Rental Market for the Utilities Segment, by Country, 2014-2019 ($Million)
Table 24 Electricity Demand* in Africa in the New Policies Scenario (TWH)
Table 25 Africa: Power Rental Market for the Utilities Segment, by Region, 2014-2019 ($Million)
Table 26 Middle East and Africa Power Rental Market for the Oil & Gas Segment, 2014-2019 ($Million)
Table 27 Middle East: Power Rental Market for the Oil & Gas Segment, by Country, 2014-2019 ($Million)
Table 28 Africa: Power Rental Market for the Oil & Gas Segment, by Country, 2014-2019 ($Million)
Table 29 Middle East and Africa Power Rental Market for the Construction Segment, 2014-2019 ($Million)
Table 30 Middle East: Power Rental Market for the Construction Segment, by Country, 2014-2019 ($Million)
Table 31 Africa: Power Rental Market for the Construction Segment, by Country, 2014-2019 ($Million)
Table 32 Africa: Power Rental Market for the Construction Segment, by Region, 2014-2019 ($Million)
Table 33 Middle East and Africa Power Rental Market for the Other End-User Segment, 2014-2019 ($Million)
Table 34 Middle East: Power Rental Market for the Other End-User Segment, by Country, 2014-2019 ($Million)
Table 35 Africa: Power Rental Market for the Other End-User Segment, by Country, 2014-2019 ($Million)
Table 36 Other Middle East and Africa Power Rental Market, by End-User, 2014-2019 ($Million)
Table 37 Middle East and Africa Power Rental Market for the Industrial Segment, 2014-2019 ($Million)
Table 38 Middle East: Gdp of Top Ten Countries, 2013-2014 ($Million)
Table 39 Middle East: Power Rental Market for the Industrial Segment, by Country, 2014-2019 ($Million)
Table 40 Africa: Gdp of Top Ten Countries, 2013-2014 ($Million)
Table 41 Africa: Power Rental Market for Industrial Segment, by Country, 2014-2019 ($Million)
Table 42 Middle East and Africa Power Rental Market for the Mining Segment, 2014-2019 ($Million)
Table 43 Africa: Power Rental Market for Mining Segment, by Region, 2014-2019 ($Million)
Table 44 Middle East and Africa Power Rental Market for the Shipping Segment, 2014-2019 ($Million)
Table 45 Middle East: List of Major Events Using Power Rental, 2013-2022
Table 46 Middle East and Africa Power Rental Market for the Events Segment, 2014-2019 ($Million)
Table 47 Middle East: Power Rental Market for the Events Segment, by Country, 2014-2019 ($Million)
Table 48 Middle East and Africa Power Rental Market for the Others Segment, 2014-2019 ($Million)
Table 49 Middle East & Africa Power Rental Market Size, by Region, 2014-2019 ($Million)
Table 50 Middle East Power Rental Market Size, by Fuel Type, 2014-2019 ($Million)
Table 51 Middle East Power Rental Market Size, by Region, 2014-2019 ($Million)
Table 52 Iran Power Rental Market Size, by Fuel Type, 2014-2019 ($Million)
Table 53 Oman Power Rental Market Size, by Fuel Type, 2014-2019 ($Million)
Table 54 Qatar Power Rental Market Size, by Fuel Type, 2014-2019 ($Million)
Table 55 Saudi Arabia Power Rental Market Size, by Fuel Type, 2014-2019 ($Million)
Table 56 UAE Power Rental Market Size, by Fuel Type, 2014-2019 ($Million)
Table 57 Other Middle East, Power Rental Market Size, by Fuel Type, 2014-2019 ($Million)
Table 58 Africa Power Rental Market, by Fuel Type, 2014-2019 ($Million)
Table 59 Africa Power Rental Market Size, by Region, 2014-2019 ($Million)
Table 60 Algeria Power Rental Market Size, by Fuel Type, 2014-2019 ($Million)
Table 61 Egypt Power Rental Market Size, by Fuel Type, 2014-2019 ($Million)
Table 62 Libya Power Rental Market Size, by Fuel Type, 2014-2019 ($Million)
Table 63 Nigeria Power Rental Market Size, by Fuel Type, 2014-2019 ($Million)
Table 64 Other Africa Power Rental Market Size, by Fuel Type, 2014-2019 ($Million)
Table 65 Middle East & Africa Power Rental Market Size, by End-User, 2014-2019 ($Million)
Table 66 Middle East Power Rental Market Size, by End-User, 2014-2019 ($Million)
Table 67 Middle East Power Rental Market Size, by Other End-User, 2014-2019 ($Million)
Table 68 Iran Power Rental Market Size, by End-User, 2014-2019 ($Million)
Table 69 Oman Power Rental Market, by End-User, 2014-2019 ($Million)
Table 70 Qatar Power Rental Market Size, by End-User, 2014-2019 ($Million)
Table 71 Saudi Arabia Power Rental Market Size, by End-User, 2014-2019 ($Million)
Table 72 UAE Power Rental Market Size, by End-User, 2014-2019 ($Million)
Table 73 Other Middle East Countries: Power Rental Market Size, by End-User, 2014-2019 ($Million)
Table 74 Africa: Power Rental Market Size, by End-User, 2014-2019 ($Million)
Table 75 Africa Power Rental Market Size, by Other End-User, 2014-2019 ($Million)
Table 76 Algeria Power Rental Market Size, by End-User, 2014-2019 ($Million)
Table 77 Angola Power Rental Market Size, by End-User, 2014-2019 ($Million)
Table 78 Egypt Power Rental Market Size, by End-User, 2014-2019 ($Million)
Table 79 Libya Power Rental Market Size, by End-User, 2014-2019 ($Million)
Table 80 Nigeria Power Rental Market Size, by End-User, 2014-2019 ($Million)
Table 81 South Africa Power Rental Market Size, by End-User, 2014-2019 ($Million)
Table 82 Other African Countries Power Rental Market, by End-User, 2014-2019 ($Million)
Table 83 Supply Contract, 2008-2014
Table 84 Expansions, 2010-2014
Table 85 Agreements, 2010-2013
Table 86 Awards & Recognition, 2009-2014
Table 87 New Product Launch, 2012-2013
Table 88 Joint Ventures, 2008-2013
Table 89 Partnership, 2011-2013
Table 90 Other Developments, 2010-2014
List of Figures
Figure 1 Middle East & Africa Power Rental Market: Research Design
Figure 2 Market Size Estimation Methodology: Bottom-Up Approach
Figure 3 Market Size Estimation Methodology: Top-Down Approach
Figure 4 Breakdown of Primary Interviews: by Company Type, Designation, & Region
Figure 5 Data Triangulation
Figure 6 Middle East & Africa Power Rental End-User Market Snapshot (2014 vs 2019): Market for Utilities Is Dominating in the End-User Industry
Figure 7 Diesel Gensets Market to Capture Lion�s Share by 2019
Figure 8 Saudi Arabia Is the Largest Market for Power Rental in the Middle East
Figure 9 Africa Has Majority of Matured Markets in the Region
Figure 10 Market Opportunities in the Middle East & Africa Power Rental Market
Figure 11 Utilities to Grow At the Fastest Pace in the Middle East & Africa Power Rental Market
Figure 12 Utilities Segment to Capture the Lion�s Share
Figure 13 Diesel Genset to Lead the Power Rental Market of Middle East & Africa In2019
Figure 14 Market Segmentation by End-User, Type, & Region
Figure 15 Increasing Power Demand Drive the Market in the Middle East and Africa
Figure 16 Value Chain Analysis
Figure 17 Supply Chain Analysis
Figure 18 Porter�s Five Forces Analysis
Figure 19 Large End-User Base for the Power Rental Market in the Middle East and Africa
Figure 20 Utilities Are the Key Driving Force of the Middle East and Africa Power Rental Market
Figure 21 Increased Oil & Gas Production in Saudi Arabia and Nigeria to Drive the Growth of the Middle East and Africa Power Rental Market
Figure 22 Middle East Will Continue to Lead the Power Rental Market in the Construction Sector
Figure 23 Africa: Construction Projects, by Region, 2014
Figure 24 Industrial: the Power Rental Market in Turkey Is Expected to Grow More Than Double by 2019 Due to the Increase in Economic Activities
Figure 25 Middle East and Africa Mining Projects, by Region, 2014
Figure 26 Africa Mining Projects, by Region, 2014
Figure 27 Power Rental Market for Shipping Snapshot (2014 vs. 2019): Market Size by Value for Middle East and Africa Is Expected to Double in the Next Five Years
Figure 28 The Increasing Number of International Sports Events Is Driving the Power Rental Market in the Middle East
Figure 29 Increasing Number International Sports Events Is Driving the Power Rental Market in the Middle East
Figure 30 Diesel Generator Will Capture Lion�s Share in the Middle East & Africa Power Rental Industry in 2019
Figure 31 The Middle East to Dominate the Power Rental Market in Diesel Generators
Figure 32Growth in Construction & Utilities Sector Is Enhancing the Power Rental Market in the Middle East
Figure 33 Qatar Exhibits Highest Growth among All the End-Users in the Middle East Region
Figure 34 UAE Is Expected to Lead the Top Three End-User Segment With Highest Growth Rate
Figure 35 Africa Is Projected to Have Matured Markets for the End-User Segment
Figure 36 Nigeria Is Projected to Have the Largest Market in Africa ($Million)
Figure 37 Companies Adopted Supply Contracts & Agreements to Capture the Markets
Figure 38 Middle East & Africa Power Rental Market Share: Top 5 Companies vs Others, 2013
Figure 39 Market Evaluation Framework: Significant Supply Contracts, Expansions, & Agreements Have Fueled Growth & Innovation from 2011-2014
Figure 40 Geographic Revenue Mix of Top 3 Market Players
Figure 41 Aggreko Plc. : Company Snapshot
Figure 42 Aggreko Plc. : SWOT Analysis
Figure 43 Altaaqa Global: Business Overview
Figure 44 Altaaqa Global : SWOT Analysis
Figure 45 Apr Energy Plc.: Business Overview
Figure 46 Apr Energy Plc.: SWOT Analysis
Figure 47 Bryne Equipment Rental LLC.: Business Overview
Figure 48 Cummins Inc.: Business Overview
Figure 49 Cummins Inc.: SWOT Analysis
Figure 50 Hertz Equipment Rental: Business Overview
Figure 51 Jubaili Bros. LLC: Business Overview
Figure 52 Rental Solutions and Services LLC: Business Overview
Figure 53 Rental Solutions and Services LLC: SWOT Analysis
Figure 54 Sakr Power Group: Business Overview
Figure 55 Speedy Hire Plc: Business Overview


Growth opportunities and latent adjacency in Middle East and Africa Power Rental Market