System Integration Market (2011-2016): Middle East and Africa (MEA) System Integration (SI) Services Market Forecast


IT services are categorized into managed and professional IT services. Managed IT services are provided on a fixed monthly charge and tailored to the need of small and medium size businesses; whereas professional IT services include system integration & support services, consulting services, strategic IT planning, and other services.
System Integration services account for approximately 46% of the total professional IT services market in MEA region. The major factors driving the system integration market in MEA are rise in government investment in IT, growth in technology and population, and the increasing need for industrial growth. Reforming regulatory regimes and the urgent need for industry growth are the prominent factors driving the consistent demand for system integration systems in MEA. This, in turn, has encouraged the MEA governments to fasten the adoption of system integration systems across their jurisdictions. Sectors such as transportation, power, water plants, and property constructions are the opportunity drivers for system integration vendors for projects such as ERP owing to the high investments aided by the government. Factors restraining the market are the lack of network infrastructure, and the challenges faced while integrating different systems altogether.
Since System Integration Services market is at a nascent stage in the MEA region, initial setup of infrastructure is higher as compared to applications. Infrastructure market in MEA is expected to grow by 2016. However, after 2016, application integration services are expected to take over due to fast penetration of IT services in the region. MEA market consists of several players such as IBM, Oracle, Ericsson, Ness Technologies, and Saudi Business Machines.
MEA system integration services market is expected to grow from $6.30 billion in 2010 to $10.34 billion in 2016, registering a CAGR of 8.87% during 2011-2016. Oracle, Dell, and IBM are the most active companies in terms of competitive developments.
Sectors such as transportation, power, water plants, and property constructions are the opportunity drivers for system integration vendors for projects such as ERP owing to the high investments aided by the government. Vertical application markets such as BFSI, communications & media, government, and manufacturing will continue to be the high revenue generating segments for system integration services whereas healthcare, utilities, and services will have faster growth in revenues.
Scope of the report
This research report segments the MEA System Integration market on the basis of professional services, infrastructure integration services, and application integration Services. It is further sub-segmented in terms of regions and revenues, giving insights of the market trends and applications areas in each sub segment.
On the basis of market segments:
- Infrastructure integration services market
- Application integration services market
- Consulting services
On the basis of industry:
- Banking, financial services, and insurance
- Communications and media
- Manufacturing (discrete and process)
- Government
- Health
- Wholesale and retail services
- Services
- Transportation
- Utilities and resources
- Others
On the basis of geography:
- Middle East
- Africa
- Others such as:
- Middle East
- Lebanon
- Oman
- Qatar
- Bahrain
- Algeria
- Kuwait
- Pakistan
- Israel
- Africa
- South Africa
- Nigeria
- Others such as:
- Namibia
- Libya
- Ivory Coast
- Angola
- Tunisia
- Morocco
- Egypt
- Kenya
Customer Interested in this report also can view
-
Global System Integration Market [ALM, Building Management System, C2/C4isr, Cloud Integration (IAAS), Data Integration, EAI, Integrated Communication, Network Integration, Integrated Security Software, SOA] - Worldwide Forecasts & Analysis (2013 - 2018)
System Integration Market (2011-2016): Middle East and Africa (MEA) System Integration (SI) Services Market Forecast
The overall system integration services market in MEA region is expected to grow from $6.30 billion in 2010 to $10.34 billion in 2016, registering a CAGR of 8.87% from 2011 to 2016. Since system integration services market is at a nascent stage in the MEA region, initial setup of infrastructure is higher as compared to applications. The infrastructure market in MEA is expected to grow by 2016. However, after 2016, application integration services are expected to take over due to fast penetration of IT services in the region.
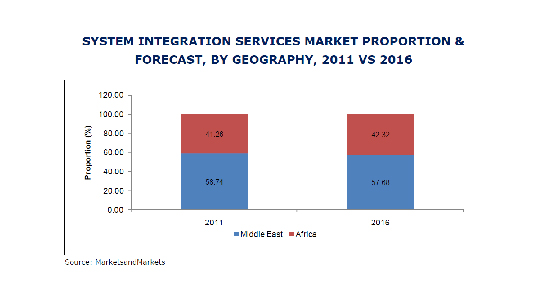
Middle East is leading the MEA region in terms of absolute dollar value of system integration services; whereas Africa is leading the market in terms of compounded annual growth rate (CAGR). Amongst several industries, BFSI is leading due to the growth of e-banking, thereby triggering higher demand for system integration services.
 Exclusive indicates content/data unique to MarketsandMarkets and not available with any competitors.
TABLE OF CONTENTS
1 INTRODUCTION
1.1 KEY TAKE-AWAYS
1.2 REPORT DESCRIPTION
1.3 MARKETS COVERED
1.4 STAKEHOLDERS
1.5 RESEARCH METHODOLOGY
1.6 FORECAST ASSUMPTIONS
2 SUMMARY
3 MARKET OVERVIEW
3.1 MARKET SEGMENTATION
3.2 PROFESSIONAL IT SERVICES MARKET IN MEA
3.3 MEA SYSTEM INTEGRATION MARKET SIZE
3.4 MARKET DYNAMICS
3.4.1 DRIVERS
3.4.1.1 Rise in IT investments by the Government
3.4.1.2 Growth in technology & youth population
3.4.1.3 Emergence of cloud computing
3.4.1.4 Need for industry growth
3.4.2 RESTRAINTS
3.4.2.1 Lack of network infrastructure
3.4.2.2 Technical integration challenges
3.4.3 OPPORTUNITIES
3.4.3.1 Risk diversification
3.4.3.2 Employment opportunities
3.5 IMPACT ANALYSIS OF DROS
3.6 OPPORTUNITY ANALYSIS
3.7 MARKET PRESENCE ANALYSIS
3.8 ANALYSIS OF MARKET DRIVING FACTORS
4 MEA SYSTEMS INTEGRATION SERVICES MARKET
4.1 OVERVIEW
4.2 MARKET SIZE & FORECAST
4.2.1 MEA INFRASTRUCTURE INTEGRATION SERVICES MARKET
4.2.1.1 Market overview
4.2.1.2 Market size & forecast
4.2.2 MEA: APPLICATION INTEGRATION SERVICES MARKET
4.2.2.1 Market overview
4.2.2.2 Market size & forecast
4.3 MEA CONSULTING SERVICES MARKET
4.3.1 MARKET OVERVIEW
4.3.2 MARKET SIZE & FORECAST
4.3.2.1 Consulting services market in MEA
5 MEA: SYSTEM INTEGRATION SERVICES MARKET ANALYSIS & FORECAST, BY INDUSTRIES
5.1 OVERVIEW
5.2 MARKET SIZE & FORECAST
5.2.1 KEY TRENDS PREVAILING IN VARIOUS INDUSTRIES
5.2.1.1 Banking, Financial Services & Insurance (BFSI)
5.2.1.2 Communications & Media
5.2.1.3 Manufacturing (Discrete & Process)
5.2.1.4 Government
5.2.1.5 Healthcare
5.2.1.6 Wholesale & Retail
5.2.1.7 Services
5.2.1.8 Transportation
5.2.1.9 Utilities & resources
6 GEOGRAPHICAL ANALYSIS
6.1 MIDDLE EAST
6.1.1 OVERVIEW
6.1.2 MARKET SIZE & FORECAST
6.1.2.1 ME system integration services market
6.1.2.2 ME infrastructure integration services market
6.1.2.3 ME application integration services market
6.1.2.4 ME consulting services market
6.1.3 SAUDI ARABIA
6.1.3.1 Overview
6.1.3.2 Key trends prevailing in Saudi Arabia system integration services market
6.1.3.3 Market size & forecast
6.1.3.3.1 Saudi Arabia system integration services market
6.1.3.3.2 Saudi Arabia infrastructure integration services market
6.1.3.3.3 Saudi Arabia application integration services market
6.1.3.3.4 Saudi Arabia consulting services market
6.1.4 UNITED ARAB EMIRATES (UAE)
6.1.4.1 Overview
6.1.4.2 Key trends prevailing in UAE system integration services market
6.1.4.3 Market size & forecast
6.1.4.3.1 UAE system integration services market
6.1.4.3.2 UAE infrastructure integration services market
6.1.4.3.3 UAE application integration services market
6.1.4.3.4 UAE Consulting services market
6.1.5 TURKEY
6.1.5.1 Overview
6.1.5.2 Key trends prevailing in Turkey system integration services market
6.1.5.3 Market size & forecast
6.1.5.3.1 Turkey system integration services market
6.1.5.3.2 Turkey infrastructure integration services market
6.1.5.3.3 Turkey application integration services market
6.1.5.3.4 Turkey consulting services market
6.1.6 OTHERS
6.1.6.1 Overview
6.1.6.2 Market size & forecast
6.1.6.2.1 Others system integration services market
6.1.6.2.2 Others infrastructure integration services market
6.1.6.2.3 Others application integration services market
6.1.6.2.4 Others consulting services market
6.2 AFRICA
6.2.1 OVERVIEW
6.2.2 MARKET SIZE & FORECAST
6.2.2.1 Africa system integration services market
6.2.2.2 Africa infrastructure integration services market
6.2.2.3 Africa application integration services market
6.2.2.4 Africa consulting services market
6.2.3 SOUTH AFRICA
6.2.3.1 Overview
6.2.3.2 Key trends prevailing in South Africa system integration services market
6.2.3.3 Market size & forecast
6.2.3.3.1 South Africa system integration services market
6.2.3.3.2 South Africa infrastructure integration services market
6.2.3.3.3 South Africa application integration services market
6.2.3.3.4 South Africa consulting services market
6.2.4 NIGERIA
6.2.4.1 Overview
6.2.4.2 Key trends prevailing in Nigeria system integration services market
6.2.4.3 Market size & forecast
6.2.4.3.1 Nigeria system integration services market
6.2.4.3.2 Nigeria infrastructure integration services market
6.2.4.3.3 Nigeria application integration services market
6.2.4.3.4 Nigeria consulting services market
6.2.5 OTHERS
6.2.5.1 Overview
6.2.5.2 Market size & forecast
6.2.5.2.1 Others system integration services market
6.2.5.2.2 Others infrastructure integration services market
6.2.5.2.3 Others application integration services market
6.2.5.2.4 Others consulting services market
7 COMPETITIVE LANDSCAPE
7.1 OVERVIEW
8 COMPANY PROFILES
8.1 ACCENTURE
8.1.1 OVERVIEW
8.1.2 PRIMARY BUSINESS
8.1.3 FINANCIALS
8.1.4 STRATEGY
8.1.5 DEVELOPMENTS
8.2 ALCATEL-LUCENT
8.2.1 OVERVIEW
8.2.2 PRIMARY BUSINESS
8.2.3 FINANCIALS
8.2.4 STRATEGY
8.2.5 DEVELOPMENTS
8.3 BUSINESS CONNEXION GROUP LTD
8.3.1 OVERVIEW
8.3.2 PRIMARY BUSINESS
8.3.3 FINANCIALS
8.3.4 STRATEGY
8.3.5 DEVELOPMENTS
8.4 DEUTSCHE TELEKOM (T-SYSTEMS)
8.4.1 OVERVIEW
8.4.2 PRIMARY BUSINESS
8.4.3 FINANCIALS
8.4.4 STRATEGY
8.4.5 DEVELOPMENTS
8.5 ERICSSON
8.5.1 OVERVIEW
8.5.2 PRIMARY BUSINESS
8.5.3 FINANCIALS
8.5.4 STRATEGY
8.5.5 DEVELOPMENTS
8.6 HEWLETT PACKARD
8.6.1 OVERVIEW
8.6.2 PRIMARY BUSINESS
8.6.3 FINANCIALS
8.6.4 STRATEGY
8.6.5 DEVELOPMENTS
8.7 HONEYWELL INTERNATIONAL
8.7.1 OVERVIEW
8.7.2 PRIMARY BUSINESS
8.7.3 FINANCIALS
8.7.4 STRATEGY
8.7.5 DEVELOPMENTS
8.8 INTERNATIONAL BUSINESS MACHINES CORP
8.8.1 OVERVIEW
8.8.2 PRIMARY BUSINESS
8.8.3 FINANCIALS
8.8.4 STRATEGY
8.8.5 DEVELOPMENTS
8.9 INFOSYS TECHNOLOGIES LTD
8.9.1 OVERVIEW
8.9.2 PRIMARY BUSINESS
8.9.3 FINANCIALS
8.9.4 STRATEGY
8.9.5 DEVELOPMENTS
8.10 MAHINDRA SATYAM (SATYAM COMPUTER SERVICES LTD)
8.10.1 OVERVIEW
8.10.2 PRIMARY BUSINESS
8.10.3 FINANCIALS
8.10.4 STRATEGY
8.10.5 DEVELOPMENTS
8.11 MANNAI CORP QSC
8.11.1 OVERVIEW
8.11.2 PRIMARY BUSINESS
8.11.3 FINANCIALS
8.11.4 STRATEGY
8.11.5 DEVELOPMENTS
8.12 NESS TECHNOLOGIES
8.12.1 OVERVIEW
8.12.2 PRIMARY BUSINESS
8.12.3 FINANCIALS
8.12.4 STRATEGY
8.12.5 DEVELOPMENTS
8.13 ORACLE
8.13.1 OVERVIEW
8.13.2 PRIMARY BUSINESS
8.13.3 FINANCIALS
8.13.4 STRATEGY
8.13.5 DEVELOPMENTS
8.14 SIEMENS AKTIENGESELLSCHAFT
8.14.1 OVERVIEW
8.14.2 PRIMARY BUSINESS
8.14.3 FINANCIALS
8.14.4 STRATEGY
8.14.5 DEVELOPMENTS
8.15 TATA CONSULTANCY SERVICES LTD
8.15.1 OVERVIEW
8.15.2 PRIMARY BUSINESS
8.15.3 FINANCIALS
8.15.4 STRATEGY
8.15.5 DEVELOPMENTS
8.16 WIPRO LTD
8.16.1 OVERVIEW
8.16.2 PRIMARY BUSINESS
8.16.3 FINANCIALS
8.16.4 STRATEGY
8.16.5 DEVELOPMENTS
8.17 DELOITTE LLP
8.17.1 OVERVIEW
8.17.2 PRIMARY BUSINESS
8.17.3 FINANCIALS
8.17.4 STRATEGY
8.17.5 DEVELOPMENTS
8.18 OTHERS
8.18.1 BT GROUP PLC
8.18.1.1 Overview
8.18.1.2 Primary business
8.18.1.3 Financials
8.18.2 DIMENSION DATA
8.18.2.1 Overview
8.18.2.2 Primary business
8.18.2.3 Financials
8.18.2.4 Strategy
8.18.2.5 Developments
8.18.3 COMPUTER SCIENCES CORP
8.18.3.1 Overview
8.18.3.2 Primary business
8.18.3.3 Financials
8.18.3.4 Strategy
8.18.3.5 Developments
8.18.4 GIJIMA
8.18.4.1 Overview
8.18.4.2 Primary business
8.18.4.3 Financials
8.18.4.4 Strategy
8.18.4.5 Developments
LIST OF TABLES
TABLE 1 SYSTEM INTEGRATION SERVICES MARKET, BY GEOGRAPHY, 2009 - 2016 ($BILLION)
TABLE 2 MEA: PROFESSIONAL IT SERVICES MARKET, 2009 - 2016
TABLE 3 SYSTEM INTEGRATION SERVICES MARKET, BY GEOGRAPHY, 2010 � 2016 (Y-O-Y GROWTH RATE)
TABLE 4 IMPACT ANALYSIS OF DROS ON SYSTEM INTEGRATION SERVICES MARKET IN MEA
TABLE 5 MEA: SYSTEM INTEGRATION SERVICES MARKET, 2010 � 2016
TABLE 6 MEA: INFRASTRUCTURE INTEGRATION SERVICES MARKET, 2010 � 2016
TABLE 7 MEA: APPLICATION INTEGRATION SERVICES MARKET, 2010 � 2016
TABLE 8 MEA: CONSULTING SERVICES MARKET, 2010 � 2016
TABLE 9 MEA: CONSULTING SERVICES MARKET REVENUE, BY GEOGRAPHY, 2010 � 2016 ($BILLION)
TABLE 10 MEA: CONSULTING SERVICES MARKET, BY GEOGRAPHY, 2011 - 2016 (Y-O-Y GROWTH RATE)
TABLE 11 MEA: SYSTEM INTEGRATION SERVICES MARKET REVENUE, BY INDUSTRY, 2010 � 2016 ($BILLION)
TABLE 12 MEA: SYSTEM INTEGRATION SERVICES MARKET, BY INDUSTRY, 2011 - 2016 (Y-O-Y GROWTH RATE)
TABLE 13 ME: SYSTEM INTEGRATION SERVICES MARKET REVENUE, BY INDUSTRY, 2010 � 2016 ($BILLION)
TABLE 14 ME: SYSTEM INTEGRATION SERVICES MARKET, BY INDUSTRY, 2011 - 2016 (Y-O-Y GROWTH RATE)
TABLE 15 AFRICA: SYSTEM INTEGRATION SERVICES MARKET REVENUE, BY INDUSTRY, 2010 � 2016 ($BILLION)
TABLE 16 AFRICA: SYSTEM INTEGRATION SERVICES MARKET, BY INDUSTRY, 2011 - 2016 (Y-O-Y GROWTH RATE)
TABLE 17 BFSI SYSTEM INTEGRATION SERVICES MARKET, 2010 � 2016
TABLE 18 COMMUNICATIONS & MEDIA SYSTEM INTEGRATION SERVICES MARKET, 2010 � 2016
TABLE 19 MANUFACTURING SYSTEM INTEGRATION SERVICES MARKET, 2010 � 2016
TABLE 20 GOVERNMENT SYSTEM INTEGRATION SERVICES MARKET, 2010 � 2016
TABLE 21 HEALTHCARE SYSTEM INTEGRATION SERVICES MARKET, 2010 � 2016
TABLE 22 WHOLESALE & RETAIL SYSTEM INTEGRATION SERVICES MARKET, 2010 � 2016
TABLE 23 SERVICES INDUSTRY SYSTEM INTEGRATION SERVICES MARKET, 2010 � 2016
TABLE 24 TRANSPORTATION SYSTEM INTEGRATION SERVICES MARKET, 2010 � 2016
TABLE 25 UTILITIES & RESOURCES SYSTEM INTEGRATION SERVICES MARKET, 2010 � 2016
TABLE 26 OTHERS SYSTEM INTEGRATION SERVICES MARKET, 2010 � 2016
TABLE 27 ME: SYSTEM INTEGRATION SERVICES MARKET REVENUE, BY TYPES, 2010 � 2016 ($BILLION)
TABLE 28 ME: SYSTEM INTEGRATION SERVICES MARKET, BY TYPES, 2011 - 2016 (Y-O-Y GROWTH RATE)
TABLE 29 ME: SYSTEM INTEGRATION SERVICES MARKET REVENUE, BY COUNTRIES, 2010 � 2016 ($BILLION)
TABLE 30 ME: SYSTEM INTEGRATION SERVICES MARKET, BY COUNTRIES, 2011 - 2016 (Y-O-Y GROWTH RATE)
TABLE 31 ME: INFRASTRUCTURE INTEGRATION SERVICES MARKET REVENUE, BY COUNTRIES, 2010 � 2016 ($BILLION)
TABLE 32 ME: INFRASTRUCTURE INTEGRATION SERVICES MARKET, BY COUNTRIES, 2011 - 2016 (Y-O-Y GROWTH RATE)
TABLE 33 ME: APPLICATION INTEGRATION SERVICES MARKET REVENUE, BY COUNTRIES, 2010 � 2016 ($BILLION)
TABLE 34 ME: APPLICATION INTEGRATION SERVICES MARKET, BY COUNTRIES, 2011 - 2016 (Y-O-Y GROWTH RATE)
TABLE 35 ME: CONSULTING SERVICES MARKET REVENUE, BY COUNTRIES, 2010 � 2016 ($BILLION)
TABLE 36 ME: CONSULTING SERVICES MARKET, BY COUNTRIES, 2011 - 2016 (Y-O-Y GROWTH RATE)
TABLE 37 SAUDI ARABIA: SYSTEM INTEGRATION SERVICES MARKET, 2010 � 2016
TABLE 38 SAUDI ARABIA: INFRASTRCUTURE INTEGRATION SERVICES MARKET, 2010 � 2016
TABLE 39 SAUDI ARABIA: APPLICATION INTEGRATION SERVICES MARKET, 2010 � 2016
TABLE 40 SAUDI ARABIA: CONSULTING SERVICES MARKET, 2010 � 2016
TABLE 41 UAE: SYSTEM INTEGRATION SERVICES MARKET, 2010 � 2016
TABLE 42 UAE: INFRASTRUCTURE INTEGRATION SERVICES MARKET, 2010 � 2016
TABLE 43 UAE: APPLICATION INTEGRATION SERVICES MARKET, 2010 � 2016
TABLE 44 UAE: CONSULTING SERVICES MARKET, 2010 � 2016
TABLE 45 TURKEY: SYSTEM INTEGRATION SERVICES MARKET, 2010 � 2016
TABLE 46 TURKEY: INFRASTRUCTURE INTEGRATION SERVICES MARKET, 2010 � 2016
TABLE 47 TURKEY: APPLICATION INTEGRATION SERVICES MARKET, 2010 � 2016
TABLE 48 TURKEY: CONSULTING SERVICES MARKET, 2010 � 2016
TABLE 49 OTHERS: SYSTEM INTEGRATION SERVICES MARKET, 2010 � 2016
TABLE 50 OTHERS: INFRASTRUCTURE INTEGRATION SERVICES MARKET, 2010 � 2016
TABLE 51 OTHERS: APPLICATION INTEGRATION SERVICES MARKET, 2010 � 2016
TABLE 52 OTHERS: CONSULTING SERVICES MARKET, 2010 � 2016
TABLE 53 AFRICA: SYSTEM INTEGRATION SERVICES MARKET REVENUE, BY TYPES, 2010 � 2016 ($BILLION)
TABLE 54 AFRICA: SYSTEM INTEGRATION SERVICES MARKET, BY TYPES, 2010 � 2016 (Y-O-Y GROWTH RATE)
TABLE 55 AFRICA: SYSTEM INTEGRATION SERVICES MARKET REVENUE, BY COUNTRIES, 2010 � 2016 ($BILLION)
TABLE 56 AFRICA SYSTEM INTEGRATION SERVICES MARKET, BY COUNTRIES, 2011 - 2016 (Y-O-Y GROWTH RATE)
TABLE 57 AFRICA: INFRASTRUCTURE INTEGRATION SERVICES MARKET REVENUE, BY COUNTRIES, 2010 � 2016 ($BILLION)
TABLE 58 AFRICA: INFRASTRUCTURE INTEGRATION SERVICES MARKET, BY COUNTRIES, 2011 - 2016 (Y-O-Y GROWTH RATE)
TABLE 59 AFRICA: APPLICATION INTEGRATION SERVICES MARKET REVENUE, BY COUNTRIES, 2010 � 2016 ($BILLION)
TABLE 60 AFRICA: APPLICATION INTEGRATION SERVICES MARKET, BY COUNTRIES, 2011 - 2016 (Y-O-Y GROWTH RATE)
TABLE 61 AFRICA: CONSULTING SERVICES MARKET REVENUE, BY COUNTRIES, 2010 � 2016 ($BILLION)
TABLE 62 AFRICA: CONSULTING SERVICES MARKET, BY COUNTRIES, 2011 - 2016 (Y-O-Y GROWTH RATE)
TABLE 63 SOUTH AFRICA: SYSTEM INTEGRATION SERVICES MARKET, 2010 � 2016
TABLE 64 SOUTH AFRICA: INFRASTRUCTURE INTEGRATION SERVICES MARKET, 2010 � 2016
TABLE 65 SOUTH AFRICA: APPLICATION INTEGRATION SERVICES MARKET, 2010 � 2016
TABLE 66 SOUTH AFRICA: CONSULTING SERVICES MARKET, 2010 � 2016
TABLE 67 NIGERIA: SYSTEM INTEGRATION SERVICES MARKET, 2010 � 2016
TABLE 68 NIGERIA: INFRASTRUCTURE INTEGRATION SERVICES MARKET, 2010 � 2016
TABLE 69 NIGERIA: APPLICATION INTEGRATION SERVICES MARKET, 2010 � 2016
TABLE 70 NIGERIA: CONSULTING SERVICES MARKET, 2010 � 2016
TABLE 71 OTHERS: SYSTEM INTEGRATION SERVICES MARKET, 2010 � 2016
TABLE 72 OTHERS: INFRASTRUCTURE INTEGRATION SERVICES MARKET, 2010 � 2016
TABLE 73 OTHERS: APPLICATION INTEGRATION SERVICES MARKET, 2010 � 2016
TABLE 74 OTHERS: CONSULTING SERVICES MARKET, 2010-2016
TABLE 75 MERGERS & ACQUISITIONS
TABLE 76 COLLABORATIONS, AGREEMENTS, & PARTNERSHIPS
TABLE 77 NEW PRODUCT OFFERINGS
TABLE 78 ACCENTURE: REVENUE, BY SEGMENTS, 2009 - 2010 ($MILLION)
TABLE 79 ACCENTURE: REVENUE, BY GEOGRAPHY, 2009 - 2010 ($MILLION)
TABLE 80 ALCATEL-LUCENT: REVENUE, BY SEGMENTS, 2009 � 2010 ($MILLION)
TABLE 81 BUSINESS CONNEXION GROUP LTD: REVENUES, BY SEGMENTS, 2009 - 2010 ($MILLION)
TABLE 82 DEUTSCHE TELEKOM: REVENUE, BY SEGMENTS, 2009 � 2010 ($MILLION)
TABLE 83 DEUTSCHE TELEKOM: REVENUE, BY GEOGRAPHY, 2009 � 2010 ($MILLION)
TABLE 84 ERICSSON: REVENUE, BY SEGMENTS, 2009 � 2010 ($MILLION)
TABLE 85 HEWLETT PACKARD: REVENUE, BY SEGMENTS, 2009 � 2010 ($MILLION)
TABLE 86 HEWLETT PACKARD: REVENUE, BY GEOGRAPHY, 2009 - 2010 ($MILLION)
TABLE 87 HONEYWELL INTERNATIONAL: REVENUE, BY SEGMENTS, 2009 � 2010 ($MILLION)
TABLE 88 HONEYWELL INTERNATIONAL:REVENUE, BY GEOGRAPHY, 2009 � 2010 ($MILLION)
TABLE 89 INTERNATIONAL BUSINESS MACHINES CORP: REVENUE, BY SEGMENTS, 2009 - 2010 ($MILLION)
TABLE 90 INTERNATIONAL BUSINESS MACHINES CORP: REVENUE, BY GEOGRAPHY, 2009 � 2010 ($MILLION)
TABLE 91 INFOSYS TECHNOLOGIES: REVENUE, BY SEGMENTS, MARCH 2010 - MARCH 2011 ($MILLION)
TABLE 92 INFOSYS TECHNOLOGIES: REVENUE, BY GEOGRAPHY, MARCH 2010 - MARCH 2011 ($MILLION)
TABLE 93 MAHINDRA SATYAM: REVENUE, BY GEOGRAPHY, 2009 � 2010 ($MILLION)
TABLE 94 MANNAI CORP QSC: REVENUE, BY SEGMENTS, 2009 - 2010 ($MILLION)
TABLE 95 NESS TECHNOLOGIES: REVENUE, BY SEGMENTS, 2009 - 2010 ($MILLION)
TABLE 96 NESS TECHNOLOGIES: REVENUE, BY GEOGRAPHY, 2009 - 2010 ($MILLION)
TABLE 97 ORACLE: REVENUE, BY SEGMENTS, 2009 � 2010 ($MILLION)
TABLE 98 ORACLE: REVENUE, BY GEOGRAPHY, 2009 � 2010 ($MILLION)
TABLE 99 TATA CONSULTANCY SERVICES LTD: REVENUE, BY SEGMENTS, 2009 - 2010 ($MILLION)
TABLE 100 TATA CONSULTANCY SERVICES LTD: REVENUE, BY SERVICES, 2010 - 2011 ($MILLION)
TABLE 101 TATA CONSULTANCY SERVICES LTD: REVENUE, BY GEOGRAPHY, 2010 � 2011 ($MILLION)
TABLE 102 WIPRO LTD: REVENUES, BY SEGMENTS, 2009 � 2010 ($MILLION)
TABLE 103 WIPRO LTD: REVENUE, BY GEOGRAPHY, 2009 � 2010 ($MILLION)
TABLE 104 DELOITTE LLP: REVENUE, BY SEGMENTS, 2009 - 2010 ($MILLION)
TABLE 105 DELOITTE LLP: REVENUE, BY GEOGRAPHY, 2009 - 2010 ($MILLION)
TABLE 106 BT GROUP PLC: REVENUE, BY SEGMENTS, 2010 - 2011 ($MILLION)
TABLE 107 BT GROUP PLC: REVENUE, BY PRODUCTS & SERVICES, 2010-2011 ($MILLION)
TABLE 108 BT GROUP PLC: REVENUE, BY GEOGRAPHY, 2010 - 2011 ($MILLION)
TABLE 109 DIMENSION DATAL: REVENUE, BY SEGMENTS, 2009 ($MILLION)
TABLE 110 DIMENSION DATAL: REVENUE, BY GEOGRAPHY, 2008 � 2009 ($MILLION)
TABLE 111 COMPUTER SCIENCES CORP: REVENUE, BY SEGMENTS, 2009 � 2010 ($MILLION)
TABLE 112 COMPUTER SCIENCES CORP: REVENUE, BY GEOGRAPHY, 2009 - 2010 ($MILLION)
TABLE 113 GIJIMA: REVENUE, BY SEGMENTS, 2009 - 2010 ($MILLION)
TABLE 114 GIJIMA: REVENUE, BY GEOGRAPHY, 2009 - 2010 ($MILLION)
TABLE 115 GIJIMA: REVENUE, BY VERTICALS, 2009 - 2010 ($MILLION)
LIST OF FIGURES
FIGURE 1 IT SERVICES MARKET SEGMENTATION
FIGURE 2 SYSTEM INTEGRATION SERVICES MARKET GROWTH TRENDS, BY GEOGRAPHY, 2011 - 2016
FIGURE 3 SYSTEM INTEGRATION SERVICES MARKET PROPORTION & FORECAST, BY GEOGRAPHY, 2011 VS 2016
FIGURE 4 MEA: SYSTEM INTEGRATION SERVICES MARKET OPPORTUNITY ANALYSIS, 2016
FIGURE 5 MARKET PRESENCE ANALYSIS: BASED ON STRATEGIC DEVELOPMENTS OF MARKET PLAYERS (MARCH 2008 � MAY 2011)
FIGURE 6 MARKET PRESENCE ANALYSIS BY NUMBER OF STRATEGIC DEVELOPMENTS (MARCH 2008 � MAY 2011)
FIGURE 7 DRIVING FACTOR IMPACT BY VERTICALS
FIGURE 8 MEA: CONSULTING SERVICES MARKET GROWTH TREND, BY GEOGRAPHY, 2011 � 2016 (Y-O-Y GROWTH RATE)
FIGURE 9 MEA: CONSULTING SERVICES MARKET PROPORTION & FORECAST, BY GEOGRAPHY, 2010 VS 2016
FIGURE 10 MEA: SYSTEM INTEGRATION SERVICES MARKET GROWTH TREND, BY INDUSTRIES, 2011 � 2016 (Y-O-Y GROWTH RATE)
FIGURE 11 MEA: SYSTEM INTEGRATION SERVICES MARKET PROPORTION & FORECAST, BY INDUSTRIES, 2011 VS 2016
FIGURE 12 ME: SYSTEM INTEGRATION SERVICES MARKET GROWTH TREND, BY INDUSTRIES, 2011 - 2016 (Y-O-Y GROWTH RATE)
FIGURE 13 ME: SYSTEM INTEGRATION SERVICES MARKET PROPORTION & FORECAST, BY INDUSTRIES, 2011 VS 2016
FIGURE 14 AFRICA: SYSTEM INTEGRATION SERVICES MARKET GROWTH TREND, BY INDUSTRIES, 2011 - 2016 (Y-O-Y GROWTH RATE)
FIGURE 15 AFRICA: SYSTEM INTEGRATION SERVICES MARKET PROPORTION & FORECAST, BY INDUSTRIES, 2011 VS 2016
FIGURE 16 ME: SYSTEM INTEGRATION SERVICES MARKET GROWTH TREND, BY TYPES, 2011 - 2016 (Y-O-Y GROWTH RATE)
FIGURE 17 ME: SYSTEM INTEGRATION SERVICES MARKET PROPORTION & FORECAST, BY TYPES, 2011 VS 2016
FIGURE 18 ME: SYSTEM INTEGRATION SERVICES MARKET GROWTH TREND, BY COUNTRIES, 2011 � 2016 (Y-O-Y GROWTH RATE)
FIGURE 19 ME: SYSTEM INTEGRATION SERVICES MARKET PROPORTION & FORECAST, 2011 - 2016
FIGURE 20 ME: INFRASTRUCTURE INTEGRATION SERVICES MARKET GROWTH TREND, BY COUNTRIES, 2011 � 2016 (Y-O-Y GROWTH RATE)
FIGURE 21 ME: INFRASTRUCTURE INTEGRATION SERVICES MARKET PROPORTION & FORECAST, BY COUNTRIES, 2011 VS 2016
FIGURE 22 ME: APPLICATION INTEGRATION SERVICES MARKET GROWTH TREND, BY COUNTRIES, 2011 � 2016 (Y-O-Y GROWTH RATE)
FIGURE 23 ME: APPLICATION INTEGRATION SERVICES MARKET PROPORTION & FORECAST, BY COUNTRIES, 2011 VS 2016
FIGURE 24 ME: CONSULTING SERVICES MARKET, BY COUNTRIES, 2011 � 2016 (Y-O-Y GROWTH RATE)
FIGURE 25 ME: CONSULTING SERVICES MARKET PROPORTION & FORECAST, BY COUNTRIES, 2011 VS 2016
FIGURE 26 AFRICA: SYSTEM INTEGRATION SERVICES MARKET GROWTH RATE, BY TYPES, 2011 VS 2016 (Y-O-Y GROWTH RATE)
FIGURE 27 AFRICA: SYSTEM INTEGRATION SERVICES MARKET, BY TYPES, 2011 VS 2016
FIGURE 28 AFRICA: SYSTEM INTEGRATION SERVICES MARKET GROWTH TREND, BY COUNTRIES, 2011 � 2016 (Y-O-Y GROWTH RATE)
FIGURE 29 AFRICA: SYSTEM INTEGRATION SERVICES MARKET PROPORTION AND FORECAST, BY COUNTRIES, 2010 VS 2016
FIGURE 30 AFRICA: INFRASTRUCTURE INTEGRATION SERVICES MARKET GROWTH TREND, BY COUNTRIES, 2011 � 2016 (Y-O-Y GROWTH RATE)
FIGURE 31 AFRICA: INFRASTRUCTURE INTEGRATION SERVICES MARKET PROPORTION AND FORECAST, BY COUNTRIES, 2011 VS 2016
FIGURE 32 AFRICA: APPLICATION INTEGRATION SERVICES MARKET GROWTH TREND, BY COUNTRIES, 2011 � 2016 (Y-O-Y GROWTH RATE)
FIGURE 33 AFRICA: APPLICATION INTEGRATION SERVICES MARKET PROPORTION & FORECAST, BY COUNTRIES, 2011 VS 2016
FIGURE 34 AFRICA: CONSULTING SERVICES MARKET GROWTH TREND, BY COUNTRIES, 2011 � 2016 (Y-O-Y GROWTH RATE)
FIGURE 35 AFRICA: CONSULTING SERVICES MARKET PROPORTION & FORECAST, BY COUNTRIES, 2011 VS 2016
FIGURE 36 INDUSTRY GROWTH STRATEGIES (MARCH 2008 - MAY 2011)


Growth opportunities and latent adjacency in System Integration Market
Interested in forecasted numbers
Interested in understanding Africa System Integration (SI) Services Market
Understand the growth in MEA IT /Cosulting services in 2019 from 2018. What new trends/technologies will impact this market.