Magnetic Flowmeter Market by Type (In-Line, Insertion, Low Flow), Component (Flow Tube, Sensing Electrodes), Application (Water & Wastewater, Food & Beverages, Chemicals, Pulp & Paper), and Geography - Global Trends & Forecasts from 2014 to 2020


The magnetic flowmeters are relatively cost-efficient and easy to install. The magmeters have no moving parts, due to which they are easy to maintain and offer good accuracy for most applications. Water & wastewater held the maximum market size of around 25% in 2013; this market is valued at $381.80 million in 2014 and is expected to reach $508.37 million by 2020.
The pulp & paper application is expected to witness the fastest growth among the other applications. This application is expected to grow at a CAGR of 4.70% during the forecast period, whereas the chemicals refineries are one of the prominent application segments; this segment is valued at a market size worth $223.26 million in 2014 and is expected to reach $293.29 million by 2020.
The magnetic flowmeters are one of the leading types of the flowmeters, which are used for measuring liquid flow. The major industries where magnetic flowmeters have been witnessing the maximum growth are the water & wastewater, chemicals, pulp & paper, and food & beverages industries. The recent development which favoured this continuous growth of the magnetic flowmeter market is the introduction of the two-wire magnetic flowmeter.
The report focuses on the magnetic flowmeter industry, which accounted for a share of 60% of the overall flowmeter market share. It deals with all driving factors, restraints, and opportunities, with respect to the magnetic flowmeter market, which are helpful in identifying the trends and key success factors for the magnetic flowmeter industry. One of the major driving factors for the market is the elimination of the wiring constraint. The wireless transmission system reduces the complexity of monitoring rotating equipment, which would promote the magnetic flowmeter industry. The major companies operating in the market are Emerson Electric Co. (U.S.), Endress+Hauser AG (Germany), ABB Ltd. (Switzerland), and Krohne Messtechnik GmbH (Germany), among others.
The magnetic flowmeter market report provides the competitive landscape of the key players, which covers their key growth strategies. It also formulates the entire value chain of the market, along with the industry trends in the magnetic flowmeter market, with emphasis on the market timeline, technology roadmaps, and product life cycle analysis. This report provides a geographic analysis, which contains the in-depth classification for North America, Europe, and APAC that cover the market. The Middle East and Latin America have been classified under RoW. The sections and the sub-segments in the report contain the drivers, restraints, opportunities, current market trends, and the technologies expected to revolutionize the flowmeters.
The report focuses on giving an insight of the complete magnetic flowmeter market, with detailed market segmentations, combined with the qualitative analysis of each and every aspect of the market, which is classified on the basis of the types, technologies, applications, and geographies. All the numbers, at every level of detail, are forecast till 2020 to give a glimpse of the potential revenue base in this market.
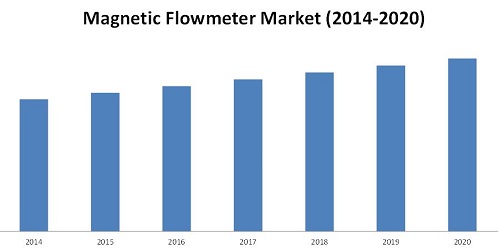
The global Magnetic Flowmeter Market size is estimated to grow from $1,464.87 million in 2014 to $1,916.94 million by 2020 at a CAGR of 4.58% from 2014 to 2020. The in-line flowmeters are expected to grow at a CAGR of 4.29%; this growth is heralded by the water & wastewater, chemicals, and food & beverages industries. APAC holds the largest market, followed by North America and Europe.
The global magnetic flowmeter market for the magnetic flowmeter application is mainly categorized into water & wastewater, oil & gas, food & beverages, chemicals, energy generation, metals & mining, pulp & paper, pharmaceuticals, and others.
The technology market includes profibus, modbus, fieldbus, HART, and others. This report covers geographic regions which include North America, Europe, Asia-Pacific, and the Rest of the World (RoW). APAC is the largest geography in terms of market size for the global magnetic flowmeter market. North America, Europe, and RoW are also considered as the promising markets, along with the U.S., Mexico, Germany, and the Middle East, which provide impetus to the growth. The report also discusses the future of the global market with the road-maps, upcoming technologies, markets, and applications with respect to the magnetic flowmeter market.
Source: MarketsandMarkets Analysis
The global Magnetic Flowmeter Market is expected to reach $1,916.94 million by 2020, at a CAGR of 4.58%. The technology market includes profibus, modbus, fieldbus, HART, and others; whereas the market for the application is mainly categorized into water & wastewater, oil & gas, food & beverages, chemicals, energy generation, metals & mining, pulp & paper, pharmaceuticals, and others. The major companies operating in the market are Emerson Electric Co. (U.S.), Endress+Hauser AG (Germany), ABB Ltd. (Switzerland), and Krohne Messtechnik GmbH (Germany), among others.
 Exclusive indicates content/data unique to MarketsandMarkets and not available with any competitors.
Table of Contents
1 Introduction (Page No. - 15)
1.1 Objectives of the Study
1.2 Market Definition
1.3 Study Scope
1.4 Currency
1.5 Limitations
1.6 Stakeholders
2 Research Methodology (Page No. - 20)
2.1 Demand-Side Analysis
2.2 Market Size Estimation
2.3 Market Breakdown and Data Triangulation
2.4 Market Share Estimation
2.4.1 Key Data From Primary Sources
2.4.1.1 Key industry insights
2.4.2 assumptions
3 Executive Summary (Page No. - 31)
4 Premium insights (Page No. - 35)
4.1 attractive Market Opportunities in the Magnetic Flowmeter Market
4.2 Market � Product Types
4.3 Market in asia-Pacific
4.4 China, South Korea, and Japan Are Expected To Lead the Market
4.5 Market: Major Applications (2020)
4.6 Market: Developed vs. Developing Nations
4.7 Life Cycle Analysis, By Geography, 2013
5 Market Overview (Page No. - 42)
5.1 Introduction
5.2 Market Segmentation
5.3 Market Dynamics
5.3.1 Drivers
5.3.1.1 Strong Position in the Emerging Market
5.3.1.2 the Growing Demand for the Magnetic Flowmeters in the Water & Wastewater industry
5.3.2 Restraints
5.3.2.1 Inability To Measure Hydrocarbons (Nonconductive)
5.3.2.2 High Costs of the New Generation Magnetic Flowmeters
5.3.3 Opportunities
5.3.3.1 Expanding Magnetic Flowmeters in the Untapped Regions
5.3.4 Challenges
5.3.4.1 Instability in the Magnetic Flowmeter
5.3.4.2 Product Differentiation By Vendors
5.4 Value Chain Analysis
5.5 Supply Chain Analysis
5.5.1 Key influencers
6 Magnetic Flowmeter Market, By Component (Page No. - 52)
6.1 Introduction
6.2 Magnetic Coils
6.3 Sensing Electrodes
6.4 Transmitters
6.5 Non-Magnetic Flow Tubes
7 Market Analysis, By Product (Page No. - 56)
7.1 Introduction
7.2 In-Line Magnetic Flowmeters
7.3 Insertion Magnetic Flowmeters
7.4 Low Flow Magnetic Flowmeters
8 Magnetic Flowmeter Market, By Technology (Page No. - 79)
8.1 Introduction
8.2 Profibus
8.3 Modbus
8.4 Fieldbus
8.5 Hart
9 Magnetic Flowmeter Market, By Application (Page No. - 83)
9.1 Introduction
9.2 Water & Wastewater
9.3 Oil & Gas
9.4 Chemicals & Petrochemicals
9.5 Food & Beverages
9.6 Power Generation
9.7 Pulp & Paper
9.8 Metals & Mining
9.9 Pharmaceuticals
9.1 Others
10 Geographic Analysis (Page No. - 103)
10.1 Introduction
10.2 North America
10.3 Europe
10.4 APAC
10.5 Rest of the World (ROW)
11 Competitive Landscape (Page No. - 115)
11.1 Overview
11.2 Market Share Analysis
11.3 Competitive Situation and Trends
11.3.1 New Product Launches
11.3.2 Agreements, Collaborations, Contracts & Joint Ventures
11.3.3 Mergers and Acquisitions
12 Company Profile (Page No. - 123)
12.1 Introduction
12.2 ABB Ltd.
12.3 Azbil Corporation
12.4 Endress+Hausar Ag
12.5 Emerson Electric Corporation
12.6 General Electric
12.7 Honeywell international inc.
12.8 Krohne Messtechnik Gmbh
12.9 Omega Engineering inc.
12.1 Siemens Ag
12.11 Yokogawa Electric Corporation
13 Appendix (Page No. - 155)
13.1 Insights of industry Experts
13.2 Discussion Guide
13.3 Introducing Rt: Real-Time Market intelligence
13.4 Available Customizations
13.5 Related Reports
List of Tables(92 tables)
Table 1 Magnetic Flowmeter Market Size, By Product Type, 2013�2020 ($Million)
Table 2 Driver Analysis
Table 3 Restraint Analysis
Table 4 Opportunity Analysis
Table 5 Challenge Analysis
Table 6 Magnetic Flowmeter Market Size, By Component, 2014�2020 ($Million)
Table 7 In-Line Magnetic Flowmeter Market Size, By Application, 2013�2020 ($Million)
Table 8 Inflow Magnetic Flowmeter Market Size, By Region ,2013�2020 ($Million)
Table 9 In-Line Magnetic Flowmeter Market for Water & Wastewater, By Region, 2013�2020 ($Million)
Table 10 In-Line Market for Oil & Gas, By Region, 2013�2020 ($Million)
Table 11 In-Line Market for Chemicals, By Region, 2013�2020 ($Million)
Table 12 In-Line Market for Food & Beverages, By Region, 2013�2020 ($Million)
Table 13 In-Line Market for Pulp & Paper, By Region, 2013�2020 ($Million)
Table 14 In-Line Market for Metals & Mining, By Region, 2013�2020 ($Million)
Table 15 In-Line Market for Power Generation, By Region, 2013�2020 ($Million)
Table 16 In-Line Market for Pharmaceuticals, By Region,2013�2020 ($Million)
Table 17 In-Line Market for Others, By Region,2013�2020 ($Million)
Table 18 Insertion Flow Meter Market Size, By Application, 2013�2020 ($Million)
Table 19 Insertion Magnetic Flowmeter Market Size, By Region ,2013�2020 ($Million)
Table 20 Insertion Market for Water & Wastewater,By Region, 2013�2020 ($Million)
Table 21 Insertion Market for Oil & Gas, By Region, 2013�2020 ($Million)
Table 22 Insertion Market for Chemicals, By Region, 2013�2020 ($Million)
Table 23 Insertion Market for Food & Beverages, By Region, 2013�2020 ($Million)
Table 24 Insertion Market for Pulp & Paper, By Region, 2013�2020 ($Million)
Table 25 Insertion Market for Metals & Mining, By Region, 2013�2020 ($Million)
Table 26 Insertion Market for Power Generation, By Region, 2013�2020 ($Million)
Table 27 Insertion Market for Pharmaceutical, By Region, 2013�2020 ($Million)
Table 28 Insertion Market for Others, By Region, 2013�2020 ($Million)
Table 29 Low Flowmeter Market Size, By Application,2013�2020 ($Million)
Table 30 Low Flowmeter Market Size, By Region ,2013�2020 ($Million)
Table 31 Low Flow Magnetic Flowmeter Market for Water & Wastewater, By Region, 2013�2020 ($Million)
Table 32 Low Flow Magnetic Flowmeter Market for Oil & Gas, By Region, 2013�2020 ($Million)
Table 33 Low Flow Magnetic Flowmeter Market for Chemicals, By Region, 2013�2020 ($Million)
Table 34 Low Flow Magnetic Flowmeter Market for Food & Beverages, By Region, 2013�2020 ($Million)
Table 35 Low Flow Magnetic Flowmeter Market for Pulp & Paper, By Region, 2013�2020 ($Million)
Table 36 Low Flow Magnetic Flowmeter Segment for Metals & Mining, By Region, 2013�2020 ($Million)
Table 37 Low Flow Magnetic Flowmeter Market for Power Generation, By Region, 2013�2020 ($Million)
Table 38 Low Flow Magnetic Flowmeter Segment for Pharmaceuticals, By Region, 2013�2020 ($Million)
Table 39 Low Flow Magnetic Flowmeter Market for Others, By Region, 2013�2020 ($Million)
Table 40 Magnetic Flowmeter Market Size, By Application, 2013�2020 ($Million)
Table 41 Market Size for Water & Wastewater, By Region, 2013�2020 ($Million)
Table 42 Market Size for Water & Wastewater, By Product Type, 2013�2020 ($Million)
Table 43 Market Size for Oil & Gas, By Region, 2013�2020 ($Million)
Table 44 Market Size for Oil & Gas, By Product Type, 2013�2020 ($Million)
Table 45 Market Size for Chemicals, By Region, 2013�2020 ($Million)
Table 46 Market Size for Chemicals, By Product Type, 2013�2020 ($Million)
Table 47 Market Size for Food & Beverages, By Region, 2013�2020 ($Million)
Table 48 Market Size for Food & Beverages, By Product Type, 2013�2020 ($Million)
Table 49 Market Size for Power Generation, By Region, 2013�2020 ($Million)
Table 50 Market Size for Power Generation, By Product Type, 2013�2020 ($Million)
Table 51 Market Size for Pulp & Paper, By Region, 2013�2020 ($Million)
Table 52 Market Size for Pulp & Paper, By Product Type, 2013�2020 ($Million)
Table 53 Market Size for Metals & Mining, By Region, 2013�2020 ($Million)
Table 54 Market for Metals & Mining Market Size, By Product Type, 2013�2020 ($Million)
Table 55 Market Size for Pharmaceuticals, By Region, 2013�2020 ($Million)
Table 56 Market Size for Pharmaceuticals, By Product Type, 2013�2020 ($Million)
Table 57 Market Size for Others, By Region, 2013�2020 ($Million)
Table 58 Market Size for Others, By Product Type, 2013�2020 ($Million)
Table 59 Market Size, By Region, 2013�2020 ($Million)
Table 60 North American Magnetic Flowmeter Market Size, By Product Type, 2013�2020 ($Million)
Table 61 North American Market Size, By Application, 2013�2020 ($Million)
Table 62 North American Market Size, By Country, 2013�2020 ($Million)
Table 63 European Magnetic Flowmeter Market Size, By Product Type, 2013�2020 ($Million)
Table 64 European Market Size, By Application, 2013�2020 ($Million)
Table 65 European Market Size, By Country, 2013�2020 ($Million)
Table 66 APAC Magnetic Flowmeter Market Size, By Product Type, 2013�2020 ($Million)
Table 67 APAC Market Size, By Application, 2013�2020 ($Million)
Table 68 APAC Market Size, By Country, 2013�2020 ($Million)
Table 69 ROW Magnetic Flowmeter Market Size, By Product Type, 2013�2020 ($Million)
Table 70 ROW Market Size, By Application, 2013�2020 ($Million)
Table 71 ROW Market Size, By Country, 2013�2020 ($Million)
Table 72 New Product Launches, 2011�2014
Table 73 Agreements, Collaborations & Joint Ventures, 2011�2014
Table 74 Mergers and Acquisitions, 2011�2014
Table 75 Expansions, 2012�2014
Table 76 ABB Ltd. Product Portfolio
Table 77 Azbil Corporation: Product Portfolio
Table 78 Azbil Corporation: Recent Developments
Table 79 Endress+Hausar Ag: Product Portfolio
Table 80 Emerson Electric Co.: Product Portfolio
Table 81 Emerson Electric Co.: Recent Developments
Table 82 General Electric: Product Portfolio
Table 83 General Electric: Recent Developments
Table 84 Honeywell international inc.: Product Portfolio
Table 85 Honeywell international inc.: Recent Developments
Table 86 Krohne Messtechnik Gmbh: Product Portfolio
Table 87 Krohne Messtechnik Gmbh: Recent Developments
Table 88 Omega Engineering inc.: Product Portfolio
Table 89 Siemens Ag: Product Portfolio
Table 90 Siemens Ag: Recent Developments
Table 91 Yokogawa Electric Corporation: Product Portfolio
Table 92 Yokogawa Electric Corporation: Recent Developments
List of Figures(65 figures)
Figure 1 Markets Covered
Figure 2 Global Market: Research Design
Figure 3 Wastewater Discharged in China From 2005 To 2012
Figure 4 The European industrial Process Water and Wastewater Treatment Equipment Markets in 2008
Figure 5 The Overall Magnetic Flowmeter Market (2008�2013)
Figure 6 Market Size Estimation Methodology: Bottom-Up Approach
Figure 7 Market Size Estimation Methodology: Top-Down Approach
Figure 8 Breakdown of Primary interviews: By Company Type, Designation, and Region
Figure 9 Market: Data Triangulation Model
Figure 10 The Water & Wastewater industry is Expected To Grow at the Highest Cagr During the forecast Period
Figure 11 The Chemical and Water & Wastewater industries Are the Best Markets To invest in From 2014 to 2020
Figure 12 APAC Accounted for the Largest Share for the Market in 2013
Figure 13 The Emerging Economies Have Several Untapped & Unexplored Opportunities
Figure 14 The Insertion Magnetic Flow meters Are Expected To Grow at the Highest Cagr Among All the Types in the agnetic Flowmeter Market
Figure 15 The Water & Wastewater Segment for the Market Accounted for the Largest Share in the Asia-Pacific Region
Figure 16 The U.S. Accounted for the Largest Share in the Market
Figure 17 APAC is Expected To Dominate the Market for the Application Segment By 2020
Figure 18 China, as A Developing Economy, is Expected To Grow at A Higher Cagr Than the Developed Countries in the Magnetic Flow meter Market
Figure 19 The APAC Market is in the Growth Phase, Whereas North America is in the Maturity Phase
Figure 20 Magnetic Flowmeter Market � Segmentation
Figure 21 Drivers, Restraints, Opportunities, and Challenges for the Magnetic Flow meters
Figure 22 Value Chain Analysis
Figure 23 Supply Chain Analysis
Figure 24 Global Market, By Component
Figure 25 Global Market, By Type
Figure 26 Insertion Type To Grow at the Highest Rate in the Magnetic Flow meter Maket
Figure 27 The Market for the Water & Wastewater Application Witnessed the Highest Growth Rate in the inflow Magentic Flowmeter Market
Figure 28 The Market for the Water & Wastewater Application Witnessed the Highest Growth Rate in the insertion Magnetic Flowmeter Market
Figure 29 The Water & Wastewater Application Market Witnessed the Highest Growth Rate in the Low Flow Magentic Flowmeter Market
Figure 30 Global Magnetic Flowmeter Market, By Technology
Figure 31 Global Magnetic Flowmeter Market, By Application
Figure 32 The insertion Product Type To Grow the Fastest in the Water & Wastewater Application in the Market
Figure 33 The APAC Region To Lead in the Oil & Gas Application Market
Figure 34 Insertion Product Type To Grow the Fastest in the Market for the Chemical Application
Figure 35 The European Region To Lead in the Market for the Food & Beverages Application
Figure 36 Insertion Product Type Lead the Market for the Power Generation Application
Figure 37 The APAC Region To Lead in the Market for the Pulp & Paper Application
Figure 38 The insertion Product Type Lead the Market for the Metals & Mining Application
Figure 39 The North American Region To Lead the Market for the Pharmaceutical Application
Figure 40 Geographic Snapshot (2014) � the Rapidly Growing Markets Are Emerging as the New Hotspots
Figure 41 Region-Wise Growth for the Magnetic Flowmeter Applications
Figure 42 North America Market Snapshot, 2013
Figure 43 The APAC Market Snapshot
Figure 44 The Players in the Magnetic Flow Meters industry Adopted New Product Launches as A Key Strategy From 2011 to 2014
Figure 45 Emerson Electric Corporation and ABB Ltd. Grew at A Faster Rate From 2009 To 2013
Figure 46 Global Market Share, By Key Player, 2013
Figure 47 Market Evolution Framework � Significant New Product Developments Have Fueled Growth and innovation in 2011 and 2014
Figure 48 Battle for Market Share: New Product Launches Was the Key Strategy
Figure 49 Geographic Mix of the Top Players
Figure 50 Competitive Benchmarking of the Key Market Players: Emerson Electric Corporation Emerged as the Champion with a High Growth Rate in 2013
Figure 51 ABB Ltd.: Business Overview
Figure 52 ABB Ltd.: SWOT Analysis
Figure 53 Azbil Corporation: Business Overview
Figure 54 Endress+Hauser AG.: Business Overview
Figure 55 Endress+Hauser AG.: SWOT Analysis
Figure 56 Emerson Electric CO.: Business Overview
Figure 57 General Electric: Business Overview
Figure 58 Honeywell international inc.: Business Overview
Figure 59 Honeywell international inc.: SWOT Analysis
Figure 60 Krohne Messtechnik Gmbh: Business Overview
Figure 61 Omega Engineering inc.: Business Overview
Figure 62 Siemens AG: Business Overview
Figure 63 Siemens AG: SWOT Analysis
Figure 64 Yokogawa Electric Corporation: Business Overview
Figure 65 Yokogawa Electrical Corporation: SWOT Analysis


Growth opportunities and latent adjacency in Magnetic Flowmeter Market