Low Noise Amplifier (LNA) Market by Frequency (<6 GHz, 6¢60 GHz, and >60 GHz), Material (Silicon, Silicon Germanium, Gallium Arsenide), Vertical (Consumer, Telecom, Military, Industrial, Automotive and Medical), and Geography - Global Forecast to 2023


[142 Pages Report] The low noise amplifier (LNA) market is expected to grow from USD 1.17 Billion in 2016 to USD 3.00 Billion by 2023, at a CAGR of 13.8% between 2017 and 2023. This report provides a detailed analysis of the LNA market based on frequency, material, vertical, and geography. The growing demand from the smartphone market, increasing usage of the long-term evolution (LTE) technology, and adoption of E Band to meet growing bandwidth demand are driving the driving factors for the market.
Years considered for this report are as follows:
2016: Base year
2017: Estimated year
2023: Forecast year
2017–2023: Forecast period
The objectives of the report are as follows:
- To define, describe, and forecast the global low noise amplifier (LNA) market, in terms value, on the basis of frequency, material, vertical, and geography
- To define, describe, and forecast the LNA market based on frequency, vertical, and geography, in terms of volume
- To forecast the market size, in terms of value, for the vertical segment with regard to four main regions, namely, Americas, Europe, APAC, and RoW
- To strategically analyze the micromarkets with regard to the individual growth trends, prospects, and contribution to the LNA market
- To provide detailed information regarding the major factors (drivers, restraints, opportunities, and industry-specific challenges) influencing the growth of the LNA market
- To analyze opportunities in the market for stakeholders and the details of the competitive landscape for leaders in the market
- To provide a detailed overview of the value chain in the LNA industry
- To benchmark the players in the market using proprietary vendor DIVE framework, which analyzes market players on various parameters within the broad categories of business and product strategy
- To analyze competitive developments such as mergers, acquisitions, partnerships, agreements, and collaborations, and product launches, along with research and development (R&D) in the low noise amplifier (LNA) market
- To strategically profile key players of the LNA market and comprehensively analyze their market shares and core competencies
The low noise amplifier (LNA) market is expected to grow from USD 1.17 Billion in 2016 to USD 3.00 Billion by 2023, at a CAGR of 13.8% between 2017 and 2023. The drivers for this market are the huge demand from the smartphone market, increasing defense expenditure globally, adoption of E Band to meet growing bandwidth demand, and increasing usage of the long-term evolution (LTE) technology.
Among all the major verticals considered for the low noise amplifier (LNA) market study, the consumer electronics vertical held the largest share in 2016. The growth is attributed to the growing adoption of consumer electronics devices such as wearable devices; smartphones, tablets, and laptops; portable navigation devices; portable media players; digital cameras; and gaming consoles; as well as an increase in the number of e-readers. The LNA market for the industrial vertical is expected to grow at the highest CAGR during the forecast period because of the high rate of adoption of Industry 4.0 in the industries worldwide, along with the increasing needs for high-performance portable instruments, and flexible and fast production test systems; and a continuing demand for the highest performance in laboratory instruments.
The low noise amplifier (LNA) market for silicon held the largest share in 2016. Silicon devices are typically much cheaper to manufacture. The dielectric constant of silicon devices is high and undergoes minimal changes with a change in temperature. The silicon-based LNAs are used mainly in DC to 6 GHz frequency spectrum, which accounts for the largest share of the overall LNA market based on frequency. The LNA market for silicon germanium is expected to grow at the highest CAGR during the forecast period. The devices based on silicon germanium exceed the performance in low-power, high-frequency applications compared with other materials such as silicon and gallium arsenide.
The DC to 6 GHz frequency segment held the largest share LNA market in 2016. This can be attributed to growing demand for smartphones, evolution of LTE technology, and growing demand for wideband-intensive applications. The low noise amplifier (LNA) market for the greater than 60 GHz frequency segment is expected to grow at the highest CAGR between 2017 and 2023. This growth is attributed to the adoption of E band. E band is gaining momentum as an attractive high-capacity solution relevant to mobile carriers due to increasing scarcity of other microwave bands.
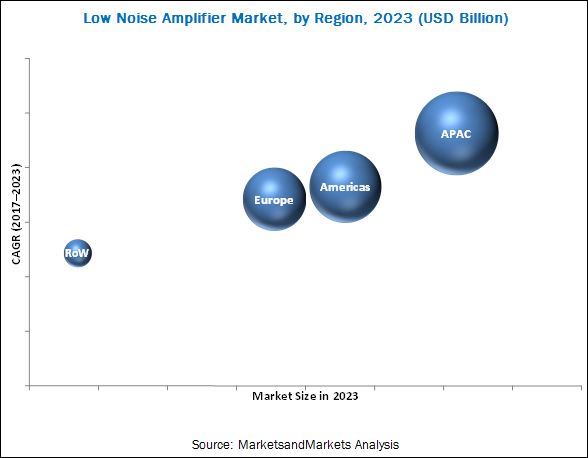
In terms of the different regions, Asia Pacific (APAC) held the largest share of the LNA market in 2016, and the market in APAC is expected to grow at the highest CAGR during the forecast period. The growth is due to high rate of adoption of smartphones; dramatic shift toward higher speed mobile technology from 3G to 4G; higher increasing range of mobile services consumed, including video, social media, e-commerce, and financial services; and high military expenditures by countries such as China, India, Japan, and South Korea.
The low noise amplifier (LNA) market is highly fragmented, which reduces the price margin for the LNA manufacturers. The LNA market has a presence of a number of small- to medium-sized firms. The lower price margin for the LNAs acts a restraint for the growth of this market. Moreover, the increasing competition and cost-driven consumer market have led to price wars, ultimately leading to a reduction in the prices of LNAs.
The major players of the low noise amplifier (LNA) market are NXP Semiconductors N.V. (Netherlands), Analog Devices, Inc. (US), Infineon Technologies AG (Germany), L3 Narda-MITEQ (US), Qorvo, Inc. (US), Skyworks Solutions, Inc. (US), ON Semiconductor Corp. (US), Panasonic Corp. (Japan), Texas Instruments, Inc. (US), and Teledyne Microwave Solutions (US). Most of the leading companies have followed the organic strategy of product launches to boost the revenue of the company.
To speak to our analyst for a discussion on the above findings, click Speak to Analyst
 Exclusive indicates content/data unique to MarketsandMarkets and not available with any competitors.
Table of Contents
1 Introduction (Page No. - 14)
1.1 Objectives of Study
1.2 Definition
1.3 Study Scope
1.3.1 Markets Covered
1.3.2 Geographic Scope
1.4 Years Considered for Study
1.5 Currency
1.6 Package Size
1.7 Limitations
1.8 Market Stakeholders
2 Research Methodology (Page No. - 18)
2.1 Research Data
2.1.1 Secondary Data
2.1.1.1 List of Major Secondary Sources
2.1.1.2 Secondary Sources
2.1.2 Primary Data
2.1.2.1 Primary Interviews With Experts
2.1.2.2 Key Data From Primary Sources
2.1.2.3 Key Industry Insights
2.1.2.4 Breakdown of Primaries
2.1.3 Secondary and Primary Research
2.2 Market Size Estimation
2.2.1 Bottom-Up Approach
2.2.1.1 Approach for Capturing the Market Share By Bottom-Up Analysis (Demand Side)
2.2.2 Top-Down Approach
2.2.2.1 Approach for Capturing the Market Share By Top-Down Analysis (Supply Side)
2.3 Market Ranking Estimation
2.4 Market Breakdown and Data Triangulation
2.5 Research Assumptions
3 Executive Summary (Page No. - 29)
4 Premium Insights (Page No. - 34)
4.1 Attractive Market Opportunities in LNA Market
4.2 Low Noise Amplifier (LNA) Market, By Material and Vertical
4.3 Market, By Frequency
4.4 Country-Wise Analysis of LNA Market
4.5 Market Size, By Region
5 Market Overview (Page No. - 37)
5.1 Introduction
5.2 Market Dynamics
5.2.1 Drivers
5.2.1.1 Huge Demand From Smartphone Market
5.2.1.2 Increasing Usage of Long-Term Evolution (LTE) Technology
5.2.1.3 Adoption of E Band to Meet Growing Bandwidth Demand
5.2.1.4 Increasing Defense Expenditure Globally
5.2.2 Restraints
5.2.2.1 Reduced Price Margin Due to Highly Fragmented Market
5.2.3 Opportunities
5.2.3.1 Rapid Development of Space Programs Worldwide
5.2.3.2 Evolution of 5g Technology
5.2.3.3 Commercialization of Iot
5.2.3.4 Growing Demand From Automotive Sector
5.2.4 Challenges
5.2.4.1 Designing Robust LNAs
5.3 Value Chain Analysis
6 Low Noise Amplifier (LNA) Market, By Frequency (Page No. - 47)
6.1 Introduction
6.2 DC to 6 GHz
6.3 6 GHz to 60 GHz
6.4 Greater Than 60 GHz
7 LNA Market, By Material (Page No. - 54)
7.1 Introduction
7.2 Silicon
7.3 Silicon Germanium
7.4 Gallium Arsenide
7.5 Others
8 Low Noise Amplifier (LNA) Market, By Vertical (Page No. - 62)
8.1 Introduction
8.2 Consumer Electronics
8.3 Telecom and Datacom
8.4 Medical
8.5 Military and Space
8.6 Industrial
8.7 Automotive
9 Geographic Analysis (Page No. - 79)
9.1 Introduction
9.2 Americas
9.2.1 US
9.2.2 Canada
9.2.3 Mexico
9.2.4 Brazil
9.2.5 Rest of Americas
9.3 Europe
9.3.1 Germany
9.3.2 France
9.3.3 UK
9.3.4 Italy
9.3.5 Rest of Europe
9.4 Asia Pacific
9.4.1 China
9.4.2 Japan
9.4.3 South Korea
9.4.4 India
9.4.5 Rest of APAC
9.5 Rest of the World
9.5.1 Middle East
9.5.2 Africa
10 Competitive Landscape (Page No. - 99)
10.1 Overview
10.2 Market Ranking Analysis
10.3 LNA Market Competitive Leadership Mapping, 2017
10.3.1 Visionary Leaders
10.3.2 Dynamic Differentiators
10.3.3 Innovators
10.3.4 Emerging Companies
10.4 Strength of Product Portfolio (For All 25 Players)
10.5 Business Strategy Excellence (For All 25 Players)
Top 25 Companies Analyzed for This Study are - Amplitech, Inc., Analog Devices, Inc., API Technologies Corp., B&Z Technologies, LLC, Broadcom Ltd., Ciao Wireless, Inc., CTT Inc., Custom Mmic Design Services, Inc., Dbwave Technologies Co., Ltd., Infineon Technologies Ag, L3 Narda-Miteq, Macom Technology Solutions Holdings, Inc., Northrop Grumman Corp., Microwave Dynamics, NEC Space Technologies, Ltd., Nxp Semiconductors N.V., on Semiconductor Corp., Panasonic Corp., Qorvo, Inc., Sage Millimeter, Inc., Skyworks Solutions, Inc., Teledyne Microwave Solutions, Texas Instruments Inc., Toshiba Corp., Wantcom Inc.
10.6 Competitive Scenario
11 Company Profiles (Page No. - 106)
(Business Overview, Strength of Service Portfolio, Business Strategy Excellence, Recent Developments)*
11.1 Introduction
11.2 Nxp Semiconductors N.V.
11.3 Analog Devices, Inc.
11.4 Infineon Technologies AG
11.5 L3 Narda-Miteq
11.6 Qorvo, Inc.
11.7 Skyworks Solutions, Inc.
11.8 on Semiconductor Corp.
11.9 Panasonic Corp.
11.10 Texas Instruments Inc.
11.11 Teledyne Microwave Solutions
11.12 Key Innovators
11.12.1 Custom Mmic Design Services, Inc.
11.12.2 Macom Technology Solutions Holdings, Inc.
11.12.3 Sage Millimeter, Inc.
11.12.4 Wantcom Inc.
11.12.5 Dbwave Technologies Co., Ltd.
*Details on Business Overview, Strength of Service Portfolio, Business Strategy Excellence, Recent Developments Might Not Be Captured in Case of Unlisted Companies.
12 Appendix (Page No. - 135)
12.1 Discussion Guide
12.2 Knowledge Store: Marketsandmarkets’ Subscription Portal
12.3 Introducing RT: Real-Time Market Intelligence
12.4 Available Customizations
12.5 Related Reports
12.6 Author Details
List of Tables (71 Tables)
Table 1 Low Noise Amplifier (LNA) Market, By Frequency, 2015–2023 (USD Million)
Table 2 LNA Market, By Frequency, 2015–2023 (Million Units)
Table 3 Market for DC to 6 GHz, By Material, 2015–2023 (USD Million)
Table 4 Market for DC to 6 GHz, By Vertical, 2015–2023 (USD Million)
Table 5 Market for DC to 6 GHz, By Vertical, 2015–2023 (Million Units)
Table 6 Market for 6 GHz to 60 GHz, By Material, 2015–2023 (USD Million)
Table 7 Market for 6 GHz to 60 GHz, By Vertical, 2015–2023 (USD Million)
Table 8 Market for 6 GHz to 60 GHz, By Vertical, 2015–2023 (Million Units)
Table 9 Market for Greater Than 60 GHz, By Material, 2015–2023 (USD Million)
Table 10 Market for Greater Than 60 GHz, By Vertical, 2015–2023 (USD Million)
Table 11 LNA Market for Greater Than 60 GHz, By Vertical, 2015–2023 (Million Units)
Table 12 Low Noise Amplifier (LNA) Market, By Material, 2015–2023 (USD Million)
Table 13 LNA Market for Silicon, By Frequency, 2015–2023 (USD Million)
Table 14 Market for Silicon, By Vertical, 2015–2023 (USD Million)
Table 15 Market for Silicon Germanium, By Frequency, 2015–2023 (USD Million)
Table 16 Market for Silicon Germanium, By Vertical, 2015–2023 (USD Million)
Table 17 Market for Gallium Arsenide, By Frequency, 2015–2023 (USD Million)
Table 18 Market for Gallium Arsenide, By Vertical, 2015–2023 (USD Million)
Table 19 Market for Others, By Frequency, 2015–2023 (USD Million)
Table 20 Market for Others, By Vertical, 2015–2023 (USD Million)
Table 21 Market, By Vertical, 2015–2023 (USD Million)
Table 22 Market, By Vertical, 2015–2023 (Million Units)
Table 23 Market for Consumer Electronics, By Frequency, 2015–2023 (USD Million)
Table 24 Market for Consumer Electronics, By Frequency, 2015–2023 (Million Units)
Table 25 Market for Consumer Electronics, By Material, 2015–2023 (USD Million)
Table 26 Market for Consumer Electronics, By Region, 2015–2023 (USD Million)
Table 27 Market for Consumer Electronics, By Region, 2015–2023 (Million Units)
Table 28 LNA Market for Telecom and Datacom, By Frequency, 2015–2023 (USD Million)
Table 29 Low Noise Amplifier (LNA) Market for Telecom and Datacom, By Frequency, 2015–2023 (Million Units)
Table 30 Market for Telecom and Datacom, By Material, 2015–2023 (USD Million)
Table 31 Market for Telecom and Datacom, By Region, 2015–2023 (USD Million)
Table 32 Market for Telecom and Datacom, By Region, 2015–2023 (Million Units)
Table 33 Market for Medical, By Frequency, 2015–2023 (USD Million)
Table 34 Market for Medical, By Frequency, 2015–2023 (Million Units)
Table 35 Market for Medical, By Material, 2015–2023 (USD Million)
Table 36 Market for Medical, By Region, 2015–2023 (USD Million)
Table 37 Market for Medical, By Region, 2015–2023 (Million Units)
Table 38 Market for Military and Space, By Frequency, 2015–2023 (USD Million)
Table 39 Market for Military and Space, By Frequency, 2015–2023 (Million Units)
Table 40 Low Noise Amplifier (LNA) Market for Military and Space, By Material, 2015–2023 (USD Million)
Table 41 Market for Military and Space, By Region, 2015–2023 (USD Million)
Table 42 Market for Military and Space, By Region, 2015–2023 (Million Units)
Table 43 Market for Industrial, By Frequency, 2015–2023 (USD Million)
Table 44 Market for Industrial, By Frequency, 2015–2023 (Million Units)
Table 45 Market for Industrial, By Material, 2015–2023 (USD Million)
Table 46 Market for Industrial, By Region, 2015–2023 (USD Million)
Table 47 Market for Industrial, By Region, 2015–2023 (Million Units)
Table 48 Market for Automotive, By Frequency, 2015–2023 (USD Million)
Table 49 Market for Automotive, By Frequency, 2015–2023 (Million Units)
Table 50 Market for Automotive, By Material, 2015–2023 (USD Million)
Table 51 Market for Automotive, By Region, 2015–2023 (USD Million)
Table 52 Market for Automotive, By Region, 2015–2023 (Million Units)
Table 53 Market, By Region, 2015–2023 (USD Million)
Table 54 Market, By Region, 2015–2023 (Million Units)
Table 55 Market in Americas, By Vertical, 2015–2023 (USD Million)
Table 56 Market in Americas, By Vertical, 2015–2023 (Million Units)
Table 57 Market in Americas, By Country, 2015–2023 (USD Million)
Table 58 Market in Americas, By Country, 2015–2023 (Million Units)
Table 59 Market in Europe, By Vertical, 2015–2023 (USD Million)
Table 60 Market in Europe, By Vertical, 2015–2023 (Million Units)
Table 61 Market in Europe, By Country, 2015–2023 (USD Million)
Table 62 Market in Europe, By Country, 2015–2023 (Million Units)
Table 63 Market in APAC, By Vertical, 2015–2023 (USD Million)
Table 64 LNA Market in APAC, By Vertical, 2015–2023 (Million Units)
Table 65 Low Noise Amplifier (LNA) Market in APAC, By Country, 2015–2023 (USD Million)
Table 66 Market in APAC, By Country, 2015–2023 (Million Units)
Table 67 Market in RoW, By Vertical, 2015–2023 (USD Million)
Table 68 Market in RoW, By Vertical, 2015–2023 (Million Units)
Table 69 Market in RoW, By Region, 2015–2023 (USD Million)
Table 70 LNA Market in RoW, By Region, 2015–2023 (Million Units)
Table 71 Market Ranking of Top 5 Players in LNA Market, 2016
List of Figures (45 Figures)
Figure 1 Low Noise Amplifier (LNA) Market: Research Design
Figure 2 Process Flow
Figure 3 Market Size Estimation Methodology: Bottom-Up Approach
Figure 4 Market Size Estimation Methodology: Top-Down Approach
Figure 5 Market Breakdown and Data Triangulation
Figure 6 Assumptions of the Research Study
Figure 7 LNA Market for Greater Than 60 GHz Segment to Grow at Highest CAGR During Forecast Period
Figure 8 Silicon to Hold Major Share of LNA Market in 2017
Figure 9 Industrial and Automotive: Most Promising Verticals for LNA Market
Figure 10 APAC to Be Fastest-Growing Region in LNA Market During Forecast Period
Figure 11 Growing Use of LTE Technology Driving LNA Market
Figure 12 Silicon Material and Consumer Electronics Vertical Hold Largest Market Shares
Figure 13 DC to 6 GHz Segment to Hold Largest Size of LNA Market By 2023
Figure 14 US Held Largest Share of LNA Market in 2017
Figure 15 LNA Market in APAC to Grow at Highest CAGR During Forecast Period
Figure 16 Huge Demand From Smartphone Market and Adoption of E-Band to Meet Growing Bandwidth Demand Contribute to Growth of LNA Market
Figure 17 Total Smartphone Users in World (2013–2020)
Figure 18 Global Mobile Data Traffic (2016–2021)
Figure 19 Defense Expenditure By Top 10 Countries in 2016
Figure 20 Number of Connected Devices to Reach ~50 Billion By 2020: Cisco Perspective
Figure 21 Increasing Penetration Rate of Connected Objects (2012–2020)
Figure 22 Value Chain Analysis: Major Value Added During Original Equipment Manufacturer and System Integrator Phases
Figure 23 DC to 6 GHz Segment to Hold to Largest Share of LNA Market During Forecast Period
Figure 24 LNA Market for Silicon Germanium to Grow at Highest CAGR During Forecast Period
Figure 25 LNA Market for Industrial Vertical to Grow at Highest CAGR During Forecast Period
Figure 26 LNA Market: Geographic Snapshot
Figure 27 Americas: LNA Market Snapshot
Figure 28 Europe: LNA Market Snapshot
Figure 29 APAC: LNA Market Snapshot
Figure 30 RoW: LNA Market Snapshot
Figure 31 Companies in LNA Market Adopted Product Launches as Key Growth Strategy Between January 2014 and March 2017
Figure 32 Competitive Leadership Mapping
Figure 33 LNA Market Evaluation Frame
Figure 34 Product Launches as Prominent Strategy Adopted By Major Players in LNA Market
Figure 35 Geographic Revenue Mix for Major Market Players
Figure 36 NXP Semiconductors N.V.: Company Snapshot
Figure 37 Analog Devices, Inc.: Company Snapshot
Figure 38 Infineon Technologies AG: Company Snapshot
Figure 39 L3 Narda-Miteq: Company Snapshot
Figure 40 Qorvo, Inc.: Company Snapshot
Figure 41 Skyworks Solutions, Inc.: Company Snapshot
Figure 42 On Semiconductor Corp.: Company Snapshot
Figure 43 Panasonic Corp.: Company Snapshot
Figure 44 Texas Instruments Inc.: Company Snapshot
Figure 45 Teledyne Microwave Solutions: Company Snapshot
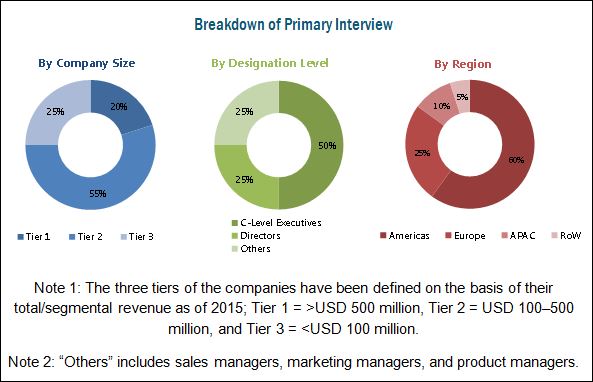
The research methodology used to estimate and forecast the low noise amplifier (LNA) market begins with capturing data on key vendor revenue through secondary sources such as Semiconductor Industry Association, Global Semiconductor Alliance, Electronic Components Industry Association (ECIA), and Semiconductor Portal Inc. Moreover, the vendor offerings are considered to determine the market segmentation. The top-down and bottom-up procedures have been employed in combination to arrive at the overall size of the LNA market on the basis of the revenues of the key players in the market. After arriving at the overall market size, the total market has been split into several segments and subsegments, which have been verified through primary research by conducting extensive interviews with the key officials such as CEOs, VPs, directors, and executives. The market breakdown and data triangulation procedures have been employed to complete the overall market engineering process and arrive at the exact statistics for all segments and subsegments. The breakdown of the profiles of primaries is depicted in the following figure.
To know about the assumptions considered for the study, download the pdf brochure
This report provides valuable insights on the LNA ecosystem including raw material suppliers, LNA manufacturers, system integrators, and end users. The main raw material suppliers include TSMC, Ltd. (Taiwan), Global Foundries Inc. (US), UMC Group (Taiwan), and Tower Semiconductor Ltd. (TowerJazz) (Israel). Some of the major OEMs of the LNA market are Analog Devices Inc. (US), NXP Semiconductors N.V. (Netherlands), Skyworks Solutions, Inc. (US), and Qorvo, Inc. (US), among others. The system integrators include Broadcom Ltd. (US), MACOM Technology Solutions Holdings, Inc. (US), and Microsemi Corp. (US). The end users of the LNA market include Samsung Electronics Co., Ltd. (South Korea), Apple Inc. (US), Audi AG (Germany), General Motors Co. (US), NEC Corp. (Japan), BridgeWave Communications Inc. (US), and Qualcomm Inc. (US).
Scope of the Report:
|
Report Metric |
Details |
|
Base year |
2016 |
|
Forecast period |
2017–2023 |
|
Units |
Value (USD) |
|
Segments covered |
Type, End User, Offerings, and Region |
|
Geographic regions covered |
North America, APAC, Europe, and RoW |
|
Companies covered |
NXP Semiconductors N.V. (Netherlands), Analog Devices, Inc. (US), Infineon Technologies AG (Germany), L3 Narda-MITEQ (US), Qorvo, Inc. (US), Skyworks Solutions, Inc. (US), ON Semiconductor Corp. (US), Panasonic Corp. (Japan), Texas Instruments, Inc. (US), and Teledyne Microwave Solutions (US). The key innovators of the market are Custom MMIC (US), MACOM Technology Solutions Holdings, Inc. (US), SAGE Millimeter, Inc. (US), WanTcom Inc. (US), and DBWave Technologies Co., Ltd. (China) |
Key Target Audience:
- Raw material suppliers
- Electronic design automation (EDA) and design tool vendors
- Original equipment manufacturers (OEMs)
- Integrated device manufacturers (IDMs)
- Original design manufacturers (ODMs)
- ODM and OEM technology solution providers
- Assembly, testing, and packaging vendors
- Technology, service, and solution providers
- Intellectual property (IP) core and licensing providers
- Suppliers and distributors
- Government and other regulatory bodies
- Technology investors
- Research institutes and organizations
- Market research and consulting firms
The study answers several questions for the stakeholders, primarily, which market segments to focus on in the next 2–5 years (depends on the range of forecast period) for prioritizing the efforts and investments.
Report Scope:
In this report, the low noise amplifier (LNA) market has been segmented into the following categories in addition to the industry trends, which have also been detailed below:
-
Low Noise Amplifier (LNA) Market, by Frequency
- DC to 6 GHz
- 6 GHz to 60 GHz
- Greater than 60 GHz
-
Low Noise Amplifier (LNA) Market, by Material
- Silicon
- Silicon Germanium
- Gallium Arsenide
- Others
-
Low Noise Amplifier (LNA) Market, by Vertical
- Consumer Electronics
- Telecom & Datacom
- Medical
- Military & Space
- Industrial
- Automotive
-
Low Noise Amplifier (LNA) Market, by Geography
-
Americas:
- US
- Canada
- Mexico
- Brazil
- Rest of Americas
-
Europe:
- Germany
- UK
- France
- Italy
- Rest of Europe
-
Asia Pacific (APAC):
- Japan
- China
- South Korea
- India
- Rest of APAC
-
Rest of the World (RoW):
- Middle East
- Africa
- Competitive Landscape
- Company Profiles: Detailed analysis of the major companies present in the LNA market.
-
Americas:
Available Customizations:
With the given market data, MarketsandMarkets offers customizations according to the company’s specific needs. The following customization options are available for the report:
Product analysis
- Product matrix that provides a detailed comparison of product portfolio of each company
Company information
- Detailed analysis and profiling of additional market players (up to 5).


Growth opportunities and latent adjacency in Low Noise Amplifier (LNA) Market