Liquid Silicone Rubber Market by Grade (Industrial, Medical, Food), Application (Automotive, Medical (Implants, Medical Devices), Electrical & Electronics (Insulation, and Electrical & Optical), Consumer Goods), Region - Global Forecast to 2026


[145 Pages Report] The global liquid silicone rubber (LSR) market is projected to reach USD 3.82 Billion by 2026 at a CAGR of 8.3% from 2016 to 2026.
In this study, the years considered to estimate the market size of LSR are:
- Base Year � 2015
- Estimated Year � 2016
- Projected Years � 2021 and 2026
- Forecast Periods � 2016-2021 (midterm) and 2016-2026 (long term)
2015 has been considered the base year for company profiles. Whenever information was unavailable for the base year, the prior year has been considered.
Objectives of the Study
- To forecast the liquid silicone rubber market sizes in terms of values of segments with respect to the five key regions (along with the countries) which are, North America, Europe, Asia-Pacific, Middle East & Africa, and South America
- To strategically analyze the market segments with respect to the grade, technology, and application.
- To provide detailed information regarding the key factors influencing the growth of the market (drivers, restraints, opportunities, and challenges)
- To analyze the opportunities in the liquid silicone rubber market for stakeholders and draw the competitive landscape for market leaders
- To track and analyze competitive developments such as, collaborations, partnerships, and joint ventures, mergers & acquisitions, new product developments, and investments & expansions in the LSR market
- To strategically profile key players and their core competencies in the liquid silicone rubber market
In the secondary research process, various sources have been referred to for the identification and collection of information for this study. These secondary sources include annual reports, press releases, and investor presentations of companies, white papers & certified publications, Factiva, Bloomberg, Businessweek, Food & Drug Association (FDA) ingredient certifications, and articles from recognized authors. In the primary research process, sources from both, the supply and demand sides have been interviewed to obtain qualitative and quantitative information. The bottom-up approach has been used to estimate the LSR market size, in terms of value, on the basis of the grade, application, and region. The top-down approach has been implemented to validate the market size, in terms of value. Through the data triangulation procedure, and the validation of data from the primary interviews, the exact values of the overall parent market size and individual market sizes have been determined and confirmed in the study.
The figure below provides a break-up of the primaries.
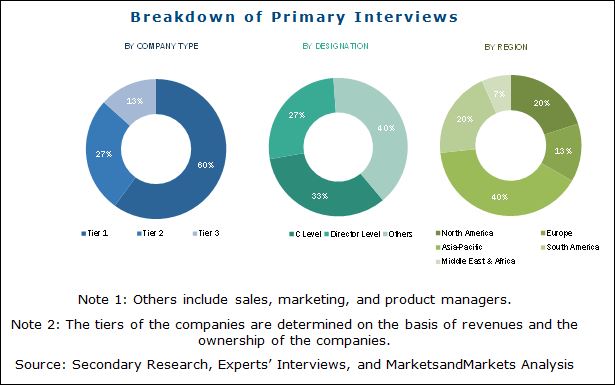
To know about the assumptions considered for the study, download the pdf brochure
MnM helped a top European chemical company identify a revenue growth opportunity of USD 900 million (over a period of 5 years) by replacing traditional hevea-based rubber in certain end-use applications with guayule-based rubber.
Client�s Problem Statement
Our client, a top European chemical company, was keen to collaborate with end-use customers of hevea rubber to help them replace it with guayule rubber as a sustainable raw material. The senior management needed to understand which application to focus on and what technical attributes of guayule rubber could provide potential for the company to collaborate with target customers.
MnM Approach
For each potential end-use application (in industries such as sports, healthcare, biofuel, pharmaceuticals, cosmetics, etc.) of guayule natural rubber, latex, resin, and bagasse across globe, we provided the client with an in-depth understanding of techno-commercial potential, end-use customers/potential partners, and factors impacting growth. This helped our client identify the potential customers in each application to commercialize the use of guayule rubber, latex, resin, and bagasse.
Revenue Impact (RI)
Our findings helped the client to penetrate a USD 35 billion market, with projected revenue of USD 900 million in 5 years. The client was able to reach out to the customers of hevea rubber with the technical attributes of guayule-based products.
LSRs follow a chain of independent activities that add greater value to the final product. The value chain covers all stages, beginning from the sourcing of raw materials to the delivery of the finished product, which is used in various LSR application areas. Raw material is the first node of the value chain of the LSR market. Raw material for LSR manufacturing includes silicon oxide, sand, and methyl chloride. The next node comprises of the LSR manufacturers including, Dow Corning (U.S.), Wacker Chemie AG (Germany), Shin-Etsu (Japan), Bluestar Silicones (France), and Momentive Performance Materials (U.S.). This LSR undergoes various tests and quality checks, depending upon the grade and the industry applications. The third node of the value chain comprises the Liquid Injection Molding System (LIMS) processors and fabricators. Companies such as, Simtec Silicone Parts, LLC (U.S.) and Stockwell Elastomerics Inc. (U.S.) process the LSR, using the Liquid Injection Molding System (LIMS) technology and manufacture various components. The last node comprises of the various applications of LSRs.
�This study answers several questions for stakeholders, primarily which market segments they should focus upon during the next two to five years to prioritize their efforts and investments�
Target Audience:
- Silicone elastomer manufacturers
- LSR manufacturers
- LSR traders, distributors, and suppliers
- Liquid Injection Molding System (LIMS) fabricators and processors
- Raw material suppliers
- Government and research organizations
- FDA and other regulatory bodies
Scope of the Report:
The report segments the global market of LSRs on the basis of grade, application, and region. It provides a forecast of the market size, in terms of value and volume, and an analysis of trends in each of the submarkets.
On the basis of Application:
- Electrical & Electronics
- Insulation
- Electronic Potting
- Electrical & Optical Components
- LED Light Components
- Lighted Panel Buttons
- Insulation
- Automotive
- Components
- Harness Components
- Self-Lubricating Components
- Automotive Parts
- Membranes and Valves
- Dampers and Noise Reduction Folds
- Seals and Gaskets
- Components
- Medical
- Implants
- Medical Devices
- Skin Contact Devices
- Infusion Pumps and Dialysis Filters
- Medical Equipment Parts
- Flow Control Valves
- Sterilized Parts
- Syringe Stoppers
- Precision Equipment Vibration Dampers
- Consumer Goods
- Food Contact Products
- Baking Molds
- Ice Cube Trays
- Home Appliance Components
- O-rings, Gaskets and Other Seals
- Others (Knife Holders, Spatula)
- Water Contact
- Sanitary Applications
- Drinking Water Cans
- Baby Care Products
- Nipples
- Toys
- Food Contact Products
- Others
- Cosmetic Applications
- Building & Construction
- Aerospace & Aeronautics
- Industrial Components
- Irrigation and Filtration Components
- Overmolded Parts
On the basis of Grade:
- Industrial Grade
- Medical Grade
- Food Grade
On the basis of Technology:
- Liquid Injection Molding System
On the basis of region:
- North America
- Europe
- Asia-Pacific
- Middle East & Africa
- South America
Available Customizations: The following customization options are available for this report:
- Company information
Analysis and profiles of additional global as well as regional market players (Up to three)
- Country-level information
Market analysis for additional countries
- Pricing analysis
Detailed pricing analysis for each type of LSR product
The global Liquid Silicone Rubber (LSR) market, in terms of value, is projected to reach USD 3.82 Billion by 2026, at a CAGR of 8.3%, from 2016 to 2026. High-growth in the electrical & electronics and medical applications, and rapid growth in the demand for medical grade LSRs are the key factors driving the global LSR market. The use of medical grade LSR reduces the risk of bacterial infections and is hence used in skin medications to aid absorption and functionality. In the electrical & electronics application, they are widely used in electrical insulation and electrical potting. Since LSRs are chemically inert and extreme temperature resistant, they are used in the manufacture of LED lights.
Medical is the fastest growing application in the Liquid Silicone Rubber (LSR) market. The growing demand for LSR based products in the healthcare industry is fueling the demand for LSR globally. This application is projected to lead the LSR market, in terms of value and volume, from 2016 to 2026. The increase in the demand for disposable medical devices and implants is expected to drive the LSR medical application.
The medical grade liquid silicone rubber (LSR) market is expected to grow at the highest rate from 2016 to 2026. This is due to the increasing aging population, worldwide, along with increasing awareness about health concerns, which is driving the medical applications of liquid silicone rubber. Since this grade requires various approvals and regulations for use in the medical field, these are costlier than the other grades. Thus, the medical grade LSR market is expected to be the largest in terms of value, during the forecast period.
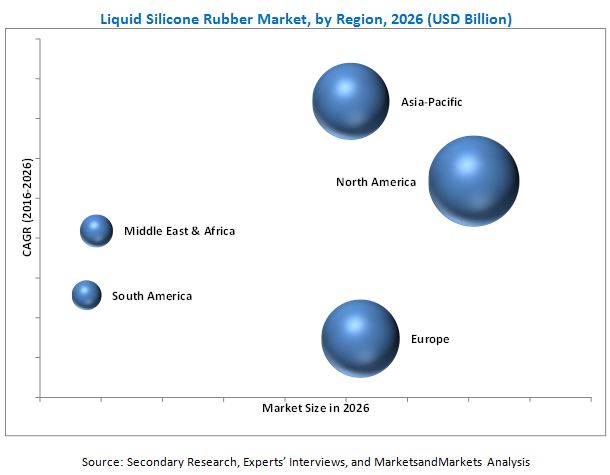
The Asia-Pacific is the fastest growing region of the liquid silicone rubber market. India and China are the leading countries in this region, wherein, China is the largest market and India the fastest growing market. Global companies are establishing distribution networks and R&D centers in this region. The rapidly growing demand in healthcare applications, competitive manufacturing costs, and high economic growth rate favor the growth of the LSR market in the Asia-Pacific region.
North America is the largest market for liquid silicone rubber, and the U.S is the largest and the fastest-growing market in this region. The healthcare industry in the U.S. and the rising demand for disposable medical devices, implants, and equipment, is driving the LSR market in this region. The major players of the LSR market such as, Dow Corning (U.S.), Momentive Performance Materials Inc. (U.S.), NuSil Technology LLC (U.S.), Simtec Silicone Parts, LLC (U.S.), and Stockwell Elastomerics Inc. (U.S), are U.S.-based companies and supply their products across the globe.
Although the LSR market is growing at a significant rate, certain factors could hinder market growth. Stringent regulations associated with the manufacture and supply of LSRs is posing a threat to the market.
Companies such as, Dow Corning Corporation (U.S.), Wacker Chemie AG (Germany), Momentive Performance Materials (U.S.), Shin-Etsu Chemical Co., Ltd. (Japan), and Bluestar Silicones (France), contribute about 50% share to the LSR market. These companies have strengthened their market positions through diverse product portfolios, strategically positioned R&D centers, consistent strategic development activities, and technological advancements. They have been adopting various organic and inorganic growth strategies, such as, investments & expansions, mergers & acquisitions, and new product launches & developments to strengthen their market shares.
To speak to our analyst for a discussion on the above findings, click Speak to Analyst
 Exclusive indicates content/data unique to MarketsandMarkets and not available with any competitors.
Table of Contents
1 Introduction (Page No. - 14)
1.1 Objectives of the Study
1.2 Market Definition
1.3 Market Scope
1.3.1 Years Considered for the Study
1.4 Currency
1.5 Package Size
1.6 Limitations
1.7 Stakeholders
2 Research Methodology (Page No. - 18)
2.1 Research Data
2.1.1 Secondary Data
2.1.1.1 Key Data From Secondary Sources
2.1.2 Primary Data
2.1.2.1 Key Data From Primary Sources
2.1.2.2 Breakdown of Primary Interviews
2.2 Market Size Estimation
2.2.1 Bottom-Up Approach
2.2.2 Top-Down Approach
2.3 Data Triangulation
2.4 Research Assumptions
2.4.1 Assumptions
3 Executive Summary (Page No. - 26)
4 Premium Insights (Page No. - 31)
4.1 LSR Market Overview, 2016 & 2021
4.2 LSR Market Growth, By Application (2014-2026)
4.3 LSR Market Share in Asia-Pacific, By Application and By Country
4.4 LSR Market Attractiveness
4.5 LSR Market Share, By Application and Region, 2015
5 Market Overview (Page No. - 35)
5.1 Introduction
5.2 Market Segmentation
5.2.1 By Grade
5.2.2 By Application
5.2.3 By Region
5.3 Market Dynamics
5.3.1 Drivers
5.3.1.1 Increasing Demand for LSR-Based Products in the Healthcare Industry
5.3.1.2 Increase in Demand for LSR in the Electrical & Electronics Industry
5.3.2 Restraints
5.3.2.1 Stringent Regulatory Policies
5.3.3 Opportunities
5.3.3.1 High Demand for Transparent LSR in Optical Applications
5.3.4 Challenges
5.3.4.1 Variations of Regulations Across Countries
6 Industry Trends (Page No. - 41)
6.1 Introduction
6.2 Value Chain Analysis
6.2.1 Raw Materials
6.2.2 LSR Manufacturers
6.2.3 Lims Processors & Fabricators
6.2.4 Application
6.3 Cost Structure Analysis
6.4 Porter�s Five Forces Analysis
6.4.1 Threat of New Entrants
6.4.2 Bargaining Power of Suppliers
6.4.3 Threat of Substitutes
6.4.4 Bargaining Power of Buyers
6.4.5 Intensity of Rivalry
7 Macroeconomic Overview and Key Trends (Page No. - 48)
7.1 Introduction
7.2 Trends of the Automotive Industry
8 LSR Molding Technology (Page No. - 50)
8.1 Introduction
8.2 Liquid Injection Molding System
8.2.1 Molding Process
9 LSR Market, By Grade (Page No. - 52)
9.1 Introduction
9.2 Industrial Grade
9.3 Medical Grade
9.4 Food Grade
10 LSR Market, By Application (Page No. - 55)
10.1 Introduction
10.2 Automotive
10.2.1 Components
10.2.1.1 Harness Components
10.2.1.2 Self-Lubricating Components
10.2.2 Automotive Parts
10.2.2.1 Membranes & Valves
10.2.2.2 Dampers and Noise Reduction Folds
10.2.2.3 Seals & Gaskets
10.3 Medical
10.3.1 Implants
10.3.2 Medical Devices
10.3.2.1 Skin Contact Devices
10.3.2.2 Infusion Pumps and Dialysis Filters
10.3.3 Medical Equipment Parts
10.3.3.1 Flow Control Valves
10.3.3.2 Sterilized Parts
10.3.3.3 Syringe Stoppers
10.3.3.4 Precision Equipment Vibration Dampers
10.4 Electrical & Electronics
10.4.1 Electrical Insulation
10.4.1.1 Electronic Potting
10.4.2 Electrical & Optical Components
10.4.2.1 LED Light Components
10.4.2.2 Lighted Panel Buttons
10.5 Consumer Goods
10.5.1 Home Appliance Components
10.5.1.1 O-Rings and Gaskets
10.5.1.2 Others (Knife Holders, Spatulas)
10.5.2 Food Contact Products
10.5.2.1 Baking Molds
10.5.2.2 ICE Cube Trays
10.5.3 Water Contact Products
10.5.3.1 Sanitary Applications
10.5.3.2 Drinking Water Cans
10.5.4 Infant Care Products
10.5.4.1 Infant Nipples
10.5.4.2 Toys
10.6 Others
10.6.1 Cosmetic Applications
10.6.2 Building & Construction
10.6.3 Aerospace & Aeronautics
10.6.4 Industrial Components
10.6.4.1 Irrigation and Filtration Components
10.6.4.2 Overmolded Parts
11 LSR Market, By Region (Page No. - 64)
11.1 Introduction
11.2 North America
11.2.1 U.S.
11.2.2 Canada
11.2.3 Mexico
11.3 Asia-Pacific
11.3.1 China
11.3.2 Japan
11.3.3 India
11.3.4 South Korea
11.3.5 Thailand
11.3.6 Malaysia
11.3.7 Rest of Asia-Pacific
11.4 Europe
11.4.1 Germany
11.4.2 France
11.4.3 U.K.
11.4.4 Italy
11.4.5 Spain
11.4.6 Russia
11.4.7 Rest of Europe
11.5 South America
11.5.1 Brazil
11.5.2 Argentina
11.5.3 Chile
11.5.4 Rest of South America
11.6 Middle East & Africa
11.6.1 Saudi Arabia
11.6.2 Egypt
11.6.3 South Africa
11.6.4 Nigeria
11.6.5 Rest of Middle East & Africa
12 Competitive Landscape (Page No. - 106)
12.1 Overview
12.2 Market Share Analysis
12.2.1 DOW Corning (U.S.)
12.2.2 Wacker Chemie AG (Germany)
12.2.3 Momentive Performance Materials Inc.
12.2.4 Shin-Etsu Chemical Co. Ltd (Japan)
12.2.5 Bluestar Silicones (France)
12.3 Competitive Situations and Trends
12.3.1 New Product Launches
12.3.2 Investments & Expansions
12.3.3 Partnerships, Joint Ventures & Collaborations
12.3.4 Mergers & Acquisitions
13 Company Profiles (Page No. - 112)
(Overview, Financial*, Products & Services, Strategy, and Developments)
13.1 DOW Corning
13.2 Wacker Chemie AG
13.3 Momentive Performance Materials Inc.
13.4 Shin-Etsu Chemical Co., Ltd.
13.5 Bluestar Silicones (Elkem Group)
13.6 KCC Corporation
13.7 Nusil Technology LLC
13.8 Simtec Silicone Parts, LLC
13.9 Stockwell Elastomerics Inc.
13.10 Zhejiang Xinan Chemical Industrial Group Co., Ltd.
13.11 Other Companies
13.11.1 Reiss Manufacturing Inc.
13.11.2 Applied Silicone
13.11.3 Mesgo S.P.A.
13.11.4 Accurate Products
13.11.5 Innovative Silicones
*Details Might Not Be Captured in Case of Unlisted Companies.
14 Appendix (Page No. - 138)
14.1 Discussion Guide
14.2 Knowledge Store: Marketsandmarkets Subscription Portal
14.3 Introducing RT: Real-Time Market Intelligence
14.4 Available Customizations
14.5 Related Reports
14.6 Author Details
List of Tables (80 Tables)
Table 1 LSR: Cost Structure Analysis
Table 2 Automotive Production, 2011-2015 (Million Units)
Table 3 LSR Market Size, By Grade, 2014�2026 (USD Million)
Table 4 LSR Market Size, By Grade, 2014�2026 (Ton)
Table 5 LSR Market Size, By Application, 2014�2026 (USD Million)
Table 6 LSR Market Size, By Application, 2014�2026 (Ton)
Table 7 LSR Market Size, By Region, 2014�2026 (USD Million)
Table 8 LSR Market Size, By Region, 2014�2026 (Ton)
Table 9 North America: By Market Size, By Country, 2014�2026 (USD Million)
Table 10 North America: By Market Size, By Country, 2014�2026 (Ton)
Table 11 North America: By Market Size, By Application, 2014�2026 (USD Million)
Table 12 North America: By Market Size, By Application, 2014�2026 (Ton)
Table 13 U.S.: By Market Size, By Application, 2014�2026 (USD Million)
Table 14 U.S.: By Market Size, By Application, 2014�2026 (Ton)
Table 15 Canada: By Market Size, By Application, 2014�2026 (USD Million)
Table 16 Canada: By Market Size, By Application, 2014�2026 (Ton)
Table 17 Mexico: By Market Size, By Application, 2014�2026 (USD Million)
Table 18 Mexico: By Market Size, By Application, 2014�2026 (Ton)
Table 19 Asia-Pacific: By Market Size, By Country, 2014�2026 (USD Million)
Table 20 Asia-Pacific: By Market Size, By Country, 2014�2026 (Ton)
Table 21 Asia-Pacific: By Market Size, By Application, 2014�2026 (USD Million)
Table 22 Asia-Pacific: By Market Size, By Application, 2014�2026 (Ton)
Table 23 China: By Market Size, By Application, 2014�2026 (USD Million)
Table 24 China: By Market Size, By Application, 2014�2026 (Ton)
Table 25 Japan: By Market Size, By Application, 2014�2026 (USD Million)
Table 26 Japan: By Market Size, By Application, 2014�2026 (Ton)
Table 27 India: By Market Size, By Application, 2014�2026 (USD Million)
Table 28 India: By Market Size, By Application, 2014�2026 (Ton)
Table 29 South Korea: By Market Size, By Application, 2014�2026 (USD Million)
Table 30 South Korea: By Market Size, By Application, 2014�2026 (Ton)
Table 31 Thailand: By Market Size, By Application, 2014�2026 (USD Million)
Table 32 Thailand: By Market Size, By Application, 2014�2026 (Ton)
Table 33 Malaysia: By Market Size, By Application, 2014�2026 (USD Million)
Table 34 Malaysia: By Market Size, By Application, 2014�2026 (Ton)
Table 35 Rest of Asia-Pacific: By Market Size, By Application, 2014�2026 (USD Million)
Table 36 Rest of Asia-Pacific: By Market Size, By Application, 2014�2026 (Ton)
Table 37 Europe: By Market Size, By Country, 2014�2026 (USD Million)
Table 38 Europe: By Market Size, By Country, 2014�2026 (Ton)
Table 39 Europe: By Market Size, By Application, 2014�2026 (USD Million)
Table 40 Europe: By Market Size, By Application, 2014�2026 (Ton)
Table 41 Germany: By Market Size, By Application, 2014�2026 (USD Million)
Table 42 Germany: By Market Size, By Application, 2014�2026 (Ton)
Table 43 France: By Market Size, By Application, 2014�2026 (USD Million)
Table 44 France: By Market Size, By Application, 2014�2026 (Ton)
Table 45 U.K.: By Market Size, By Application, 2014�2026 (USD Million)
Table 46 U.K.: By Market Size, By Application, 2014�2026 (Ton)
Table 47 Italy: By Market Size, By Application, 2014�2026 (USD Million)
Table 48 Italy: By Market Size, By Application, 2014�2026 (Ton)
Table 49 Spain: By Market Size, By Application, 2014�2026 (USD Million)
Table 50 Spain: By Market Size, By Application, 2014�2026 (Ton)
Table 51 Russia: By Market Size, By Application, 2014�2026 (USD Million)
Table 52 Russia: By Market Size, By Application, 2014�2026 (Ton)
Table 53 Rest of Europe: By Market Size, By Application, 2014�2026 (USD Million)
Table 54 Rest of Europe: By Market Size, By Application, 2014�2026 (Ton)
Table 55 South America: By Market Size, By Country, 2014�2026 (USD Million)
Table 56 South America: By Market Size, By Country, 2014�2026 (Ton)
Table 57 South America: By Market Size, By Application, 2014�2026 (USD Million)
Table 58 South America: By Market Size, By Application, 2014�2026 (Ton
Table 59 Brazil: By Market Size, By Application, 2014�2026 (USD Million)
Table 60 Brazil: By Market Size, By Application, 2014�2026 (Ton)
Table 61 Argentina: By Market Size, By Application, 2014�2026 (USD Million)
Table 62 Argentina: By Market Size, By Application, 2014�2026 (Ton)
Table 63 Chile: By Market Size, By Application, 2014�2026 (USD Million)
Table 64 Chile: By Market Size, By Application, 2014�2026 (Ton)
Table 65 Rest of South America: By Market Size, By Application, 2014�2026 (USD Million)
Table 66 Rest of South America: By Market Size, By Application, 2014�2026 (Ton)
Table 67 Middle East & Africa: By Market Size, By Country, 2014�2026 (USD Million)
Table 68 Middle East & Africa: By Market Size, By Country, 2014�2026 (Ton)
Table 69 Middle East & Africa: By Market Size, By Application, 2014�2026 (USD Million)
Table 70 Middle East & Africa: By Market Size, By Application, 2014�2026 (Ton)
Table 71 Saudi Arabia: By Market Size, By Application, 2014�2026 (USD Million)
Table 72 Saudi Arabia: By Market Size, By Application, 2014�2026 (Ton)
Table 73 Egypt: By Market Size, By Application, 2014�2026 (USD Million)
Table 74 Egypt: By Market Size, By Application, 2014�2026 (Ton)
Table 75 South Africa: By Market Size, By Application, 2014�2026 (USD Million)
Table 76 South Africa: By Market Size, By Application, 2014�2026 (Ton)
Table 77 Nigeria: By Market Size, By Application, 2014�2026 (USD Million)
Table 78 Nigeria: By Market Size, By Application, 2014�2026 (Ton)
Table 79 Rest of Middle East & Africa: By Market Size, By Application, 2014�2026 (USD Million)
Table 80 Rest of Middle East & Africa: By Market Size, By Application, 2014�2026 (Ton)
List of Figures (40 Figures)
Figure 1 LSR Market Segments
Figure 2 LSR: Research Design
Figure 3 Market Size Estimation: Bottom-Up Approach
Figure 4 Market Size Estimation: Top-Down Approach
Figure 5 LSR Market: Data Triangulation
Figure 6 Medical Grade to Lead the LSR Market From 2016 to 2021
Figure 7 Medical Application to Surpass the Automotive Application By 2021
Figure 8 Asia-Pacific to Register the Highest CAGR in the Market From 2016 to 2021
Figure 9 U.S. to Lead the Global LSR Market Through 2021
Figure 10 North America LED the Global LSR Market, 2015
Figure 11 LSR Market to Witness Rapid Growth From 2016 to 2021
Figure 12 Asia-Pacific to Witness the Highest Growth Rate During the Forecast Period
Figure 13 China Accounted for the Largest Share in Asia-Pacific, 2015
Figure 14 Asia-Pacific to Be the Fastest-Growing LSR Market From 2016 to 2021
Figure 15 Medical Application in All the Regions Accounted for the Largest Market Share, 2015
Figure 16 Impact Analysis of Short-, Medium-, and Long-Term Drivers and Restraints
Figure 17 LSR Market: Drivers, Restraints, Opportunities & Challenges
Figure 18 Value Chain of the LSR Market
Figure 19 LSR: Cost Structure Analysis
Figure 20 Porter�s Five Forces Analysis
Figure 21 LIMS Revilutionizing the LSR Molding Process
Figure 22 Medical Segment to Lead the LSR Market, By Application (2016-2021)
Figure 23 Regional Snapshot (2016�2021): North America Accounted for the Largest Share in Global LSR Market
Figure 24 North American Market Snapshot: U.S. Accounted for the Largest LSR Market, 2016�2021
Figure 25 China and India are the Major LSR Markets in Asia-Pacific
Figure 26 Germany Leads the LSR Market in Europe From 2016 to 2021
Figure 27 Brazil Leads the LSR Market in South America
Figure 28 Saudi Arabia LED the LSR Market in Middle East & Africa in 2015
Figure 29 New Product Launches Was the Key Growth Strategy Adopted By Leading Companies
Figure 30 DOW Corning Accounted for the Largest Share of the LSR Market
Figure 31 Battle for Developmental Market Share: New Product Launch is the Key Strategy
Figure 32 DOW Corning: Company Snapshot
Figure 33 DOW Corning: SWOT Analysis
Figure 34 Wacker Chemie AG: Company Snapshot
Figure 35 Wacker Chemie AG: SWOT Analysis
Figure 36 Momentive Performance Materials Inc.: Company Snapshot
Figure 37 Momentive Performance Materials Inc.: SWOT Analysis
Figure 38 Shin-Etsu Chemical Co., Ltd.: Company Snapshot
Figure 39 Shin-Etsu Chemical Co., Ltd.: SWOT Analysis
Figure 40 KCC Corporation: Company Snapshot


Growth opportunities and latent adjacency in Liquid Silicone Rubber Market