Liquid Packaging Market by Packaging Type (Flexible, Rigid), Resin (Polyethylene, Polypropylene), End-use Industries (Food & Beverage, Industrial), Technique (Aseptic Liquid Packaging, Blow Molding, Form Fill Seal Technology) - Global Forecast to 2021


The liquid packaging market is projected to be worth USD 370.75 Billion by 2021, at a CAGR of 5.4%. In this study, 2015 has been considered as the base year and 2016 to 2021 as the forecast period for estimating the market size of liquid packaging. The growing demand in Asia-Pacific, Latin America, and Middle East & Africa, coupled with improving economic conditions is expected to drive the liquid packaging market during the forecast period.
Liquid Packaging Market Report Objectives of the Study
- To define and segment the market for liquid packaging by packaging type, resin, end-use industry, technique, and region
- To estimate and forecast the market for liquid packaging in terms of value
- To analyze significant region-specific trends of the liquid packaging market in North America, Western Europe, Central & Eastern Europe, Asia-Pacific, South America, and Middle East & Africa
- To estimate and forecast the market for liquid packaging by packaging type, resin, and end-use industry at the country level in each of the regions
- To identify and analyze the key drivers, restraints, and opportunities influencing the liquid packaging market
- To analyze recent market developments and competitive strategies such as alliances, joint ventures, and mergers & acquisitions to draw a competitive landscape of the liquid packaging market
- To strategically identify and profile the key market players and analyze their core competencies
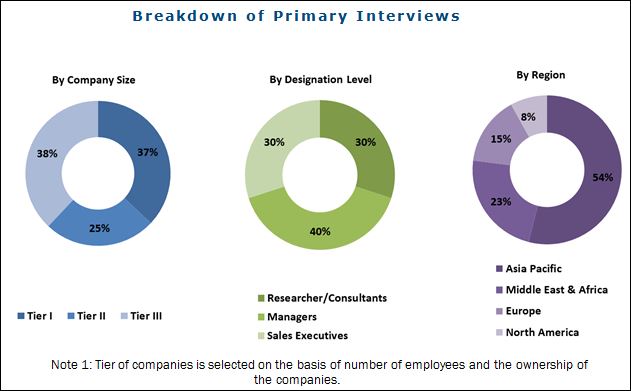
This research study involved the use of extensive secondary sources, directories, and databases, such as Hoovers, Bloomberg Businessweek, and Factiva to identify and collect information useful for a technical, market-oriented, and commercial study of the liquid packaging market. The primary sources are mainly several industry experts from core and related industries and preferred suppliers, manufacturers, distributors, service providers, and organizations related to all segments of the industry’s supply chain. The bottom-up approach has been used to estimate market size of liquid packaging on the basis of packaging type, resin, end-use industry, and region, in terms of value. The top-down approach has been implemented to validate the market size, in terms of value. With the data triangulation procedure and validation of data through primary interviews, the exact values of the overall parent market size and individual market sizes have been determined and confirmed in this study.
To know about the assumptions considered for the study, download the pdf brochure
Key Players in Liquid Packaging Market
A resin and substrate are the primary raw materials required for the manufacture of liquid packaging. Raw material suppliers to liquid packaging manufacturers are mainly categorized into two groups, namely, basic resin companies and companies supplying substrates used in the formulation of liquid packaging. Companies supplying resins include The Dow Chemical Company (U.S.), Akzo Nobel N. V. (Netherlands), Mondi Plc. (Austria), Exxon Mobil Corporation (U.S.), Bobst Group SA (Switzerland), Borealis AG (Austria), and LyondellBasell (Netherlands).
Target Audience in Liquid Packaging Market
- Liquid Packaging Manufacturers
- Liquid Packaging Traders, Distributors, and Suppliers
- End Users
- Government and Research Organizations
- Associations and Industrial Bodies
- Research and Consulting Firms
- R&D Institutions
- Environment Support Agencies
- Investment Banks and Private Equity Firms
“This study answers several questions for the stakeholders, primarily which market segments need to be focused in next two to five years for prioritizing their efforts and investments”.
Liquid Packaging Market Report Scope
This research report categorizes the market for liquid packaging based on packaging type, resin, end-use industry, and region and forecasts revenue growth and analysis of trends in each of the submarkets.
On the Basis of Packaging Type:
-
Flexible Liquid Packaging
- Stand-Up Pouch
- Bag-In-Box
- Films
-
Rigid Liquid Packaging
- Cartons
- Paperboard
- Plastics & PET bottles
- Cans
- Glass
On the Basis of End-Use Industry:
- Food & Beverages
- Non-food
- Industrial
On the Basis of Resin:
- Polyethylene
- Polypropylene
- Polyethylene Terephthalate
- Others
On the Basis of Technique:
- Aseptic Liquid Packaging
- Blow Molding
- Form Fill Seal Technology
On the Basis of Region:
Asia-Pacific
- China
- India
- Japan
- South Korea
- Malaysia
- Thailand
- Indonesia
- Rest of Asia-Pacific
North America
- U.S.
- Canada
- Mexico
Western Europe
- Germany
- France
- U.K.
- Italy
- Spain
- Rest of Western Europe
Central & Eastern Europe
- Russia
- Turkey
- Rest of Central & Eastern Europe
South America
- Brazil
- Argentina
- Rest of South America
Middle East & Africa
- UAE
- Saudi Arabia
- Africa
- Rest of Middle East
These segments are further described in detail with their subsegments in the report with value and volume forecasts till 2021.
Liquid Packaging Market Report Available Customizations
The following customization options are available in the report:
- Liquid Packaging Market Company Information
Analysis and profiling of additional global as well as regional market players (up to three)
The global liquid packaging market size, in terms of value, is projected to reach USD 370.75 Billion by 2021, at a CAGR of 5.4% between 2016 and 2021. The high demand is attributed to the growing food & beverage industry globally. Players in this market are adopting various organic and inorganic strategies to expand their presence in the emerging economies such as Asia-Pacific, Middle East & Africa, and Latin America.
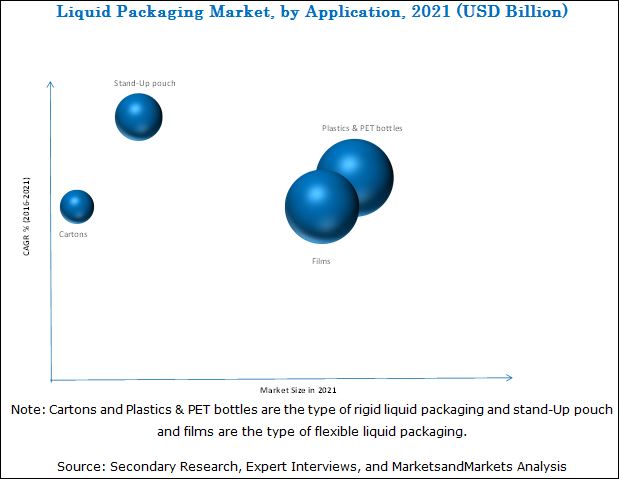
Rigid liquid packaging is the most-widely used packaging type of liquid packaging. Rigid liquid packaging includes cartons, paperboard, glass, cans and plastics & PET bottles. Plastics & PET bottles is the largest segment of the rigid liquid packaging type. They are widely used for packaging of liquid products such as water, carbonated drinks, alcohol, beverages, dairy products, and others. Rigid liquid packaging is the traditional packaging type for liquid products as it is resistant to impact, moisture, recyclable, and chemicals. Other rigid liquid packaging types are used in various end-use industries such as food & beverage, non-food and industrial.
The largest end-use industry of the liquid packaging market is food & beverage. The food & beverage industry is growing at a fast pace and the increasing population and rising economic income is facilitating the growth of this industry. Various packaging types used for food & beverage packaging include bag-in-box, stand-up pouch, plastics & PET bottles, cans, glass, films, paperboard, and cartons. Liquid products such as water, juices, dairy products, beverages, wine & spirits, detergents and household cleaning items, among others are packaged in these packaging types.
Asia-Pacific is the global forerunner in the liquid packaging market, in terms of value, and is expected to continue till 2021. Countries in this region such as China, India, Japan, South Korea, Malaysia, Thailand, and Indonesia are witnessing significant increase in the use of liquid packaging in food & beverage industry. Other regions such as Latin America are also expected to show significant growth in this market due to improving economic conditions. Also, various players are expanding their reach to South America. The markets in Europe and North America are mature and are expected to witness a comparatively lesser growth.
Though the liquid packaging market is growing at a fast pace, few factors are hampering its growth. Increasing carbon footprints due to use of resins is a major restraint toward the growth of the liquid packaging market. Various resins used in liquid packaging are PE, PP, PET, and others. The processing of these resins can prove to be disadvantageous due to the harmful by-products generated during the processing which could also lead to increase in carbon footprint.
Key Liquid Packaging Market Industry Players
The Dow Chemical Company (U.S.), International Paper (U.S.), Tetra Pak International S.A. (Switzerland), Smurfit Kappa (Ireland), and Mondi Plc. (Austria) are the dominant participants in the global liquid packaging market. These companies have been adopting various organic and inorganic growth strategies such as expansions, mergers & acquisitions, and new product launches to enhance their share in the liquid packaging market.
Frequently Asked Questions (FAQ):
What is the Liquid Packaging Market growth?
Growth of Liquid Packaging Market - Registering a CAGR of 5.4% between 2016 and 2021.
Who leading market players in Liquid Packaging industry?
Major players in Liquid Packaging Market are The Dow Chemical Company (U.S.), International Paper (U.S.), Tetra Pak International S.A. (Switzerland), Smurfit Kappa (Ireland), and Mondi Plc. (Austria), and others have adopted various organic and inorganic developmental strategies.
How big is the Liquid Packaging Market?
The global liquid packaging market is projected to reach USD 370.75 Billion by 2021.
Which segments are covered in Liquid Packaging Market report?
By Packaging Type (Flexible, Rigid), Resin (Polyethylene, Polypropylene), End-use Industries (Food & Beverage, Industrial) & Technique (Aseptic Liquid Packaging, Blow Molding, Form Fill Seal Technology).
To speak to our analyst for a discussion on the above findings, click Speak to Analyst
 Exclusive indicates content/data unique to MarketsandMarkets and not available with any competitors.
Table of Contents
1 Introduction (Page No. - 16)
1.1 Objectives of the Study
1.2 Market Definition
1.3 Market Scope
1.3.1 Years Considered for the Study
1.3.2 Currency
1.4 Limitations
1.5 Stakeholders
2 Research Methodology (Page No. - 19)
2.1 Research Data
2.1.1 Secondary Data
2.1.1.1 Key Data From Secondary Sources
2.1.2 Primary Data
2.1.2.1 Key Data From Primary Sources
2.1.2.2 Key Industry Insights
2.1.2.3 Breakdown of Primary Interviews
2.2 Market Size Estimation
2.3 Data Triangulation
2.4 Research Assumptions
3 Executive Summary (Page No. - 27)
4 Premium Insights (Page No. - 31)
4.1 Attractive Opportunities in the Liquid Packaging Market
4.2 Liquid Packaging Market Growth, By Resin
4.3 Market Share, By Region and End-Use Industry, 2015
4.4 Market Attractiveness
5 Market Overview (Page No. - 34)
5.1 Introduction
5.2 Evolution
5.3 Market Segmentation
5.3.1 By Resin
5.3.2 By End-Use Industry
5.3.3 By Packaging Type
5.3.4 By Technique
5.3.5 By Region
5.4 Market Dynamics
5.4.1 Drivers
5.4.2 Short-Term Drivers
5.4.2.1 Technological Developments in the Packaging Sector
5.4.2.2 Attractive Brand Presentation With Innovative Packaging Types
5.4.3 Mid-Term Drivers
5.4.3.1 Increasing Demand of Liquid Packaging in Asia-Pacific and Europe
5.4.4 Long-Term Driver
5.4.4.1 Increasing Population in Emerging Economies
5.4.4.2 Cost Effectiveness
5.4.5 Restraints
5.4.5.1 Substitution Products Such as Bio-Based Polymers
5.4.6 Opportunities
5.4.6.1 Increasing Emphasis on Personalization
5.4.6.2 High Growth Opportunities in the Emerging Economies of Asia-Pacific
5.4.7 Challenges
5.4.7.1 Increasing Carbon Footprint
6 Industry Trends (Page No. - 45)
6.1 Introduction
6.2 Supply Chain Analysis
6.3 Porter’s Five Forces Analysis
6.3.1 Bargaining Power of Suppliers
6.3.2 Threat of New Entrants
6.3.3 Threat of Substitutes
6.3.4 Bargaining Power of Buyers
6.3.5 Intensity of Competitive Rivalry
7 Liquid Packaging Market, By Technique (Page No. - 51)
7.1 Introduction
7.2 Aseptic Liquid Packaging
7.3 Blow Molding
7.4 Form Fill Seal Technology
8 Liquid Packaging Market, By Resin (Page No. - 56)
8.1 Introduction
8.2 Market Size & Projection
8.3 Polyethylene (Pe)
8.3.1 Low Density Polyethylene (LDPE)
8.3.2 High Density Polyethylene (HDPE)
8.4 Polypropylene (Polypropylene)
8.5 Polyethylene Terephthalate (PET)
8.6 Others
9 Liquid Packaging Market, By Packaging Type (Page No. - 63)
9.1 Introduction
9.2 Market Size & Projection
9.3 Flexible Liquid Packaging
9.3.1 Films
9.3.2 Stand-Up Pouches
9.3.3 Bag-In-Box
9.4 Rigid Liquid Packaging
9.4.1 Carton
9.4.1.1 Brick Liquid Cartons
9.4.1.2 Gable-Top Liquid Cartons
9.4.1.3 Shaped Liquid Cartons
9.4.2 Paperboard
9.4.2.1 Pe-Coated Board
9.4.2.2 Tetra Pak
9.4.3 Plastics & PET Bottles
9.4.4 Glass
9.4.5 Cans
10 Liquid Packaging Market, By End-Use Industry (Page No. - 76)
10.1 Introduction
10.2 Food & Beverage
10.3 Non-Food
10.3.1 Medical & Pharmaceutical
10.3.2 Beauty & Personal Care
10.3.3 Household Care
10.4 Industrial
11 Liquid Packaging Market, By Region (Page No. - 82)
11.1 Introduction
11.2 Asia-Pacific
11.2.1 China
11.2.2 Japan
11.2.3 India
11.2.4 South Korea
11.2.5 Malaysia
11.2.6 Indonesia
11.2.7 Thailand
11.2.8 Rest of Asia-Pacific
11.3 North America
11.3.1 U.S.
11.3.2 Canada
11.3.3 Mexico
11.4 Western Europe
11.4.1 Germany
11.4.2 U.K.
11.4.3 France
11.4.4 Italy
11.4.5 Spain
11.4.6 Rest of Western Europe
11.5 Central & Eastern Europe
11.5.1 Turkey
11.5.2 Russia
11.5.3 Rest of Central & Eastern Europe
11.6 Middle East & Africa
11.6.1 UAE
11.6.2 Saudi Arabia
11.6.3 Africa
11.6.4 Rest of Middle East
11.7 South America
11.7.1 Brazil
11.7.2 Argentina
11.7.3 Rest of South America
12 Competitive Landscape (Page No. - 143)
12.1 Overview
12.2 Market Share Analysis
12.3 Competitive Situation and Trends
12.4 New Product Launches
12.5 Mergers & Acquisitions
12.6 Partnerships/Agreements/Collaborations
12.7 Expansions
13 Company Profiles (Page No. - 150)
(Company at A Glance, Business Overview, Products Offered, Key Strategy, Recent Developments, SWOT Analysis & MnM View)*
13.1 The DOW Chemical Company
13.2 International Paper
13.3 Tetra Pak International S.A.
13.4 Smurfit Kappa
13.5 Mondi PLC
13.6 Weyerhaeuser Company
13.7 Billerudkorsnas AB
13.8 Sidel
13.9 Evergreen Packaging
13.10 Elopak
13.11 Additional Company Profile
*Details on Company at A Glance, Recent Financials, Products Offered, Strategies & Insights, & Recent Developments Might Not Be Captured in Case of Unlisted Companies.
14 Appendix (Page No. - 175)
14.1 Insights From Industry Experts
14.2 Discussion Guide
14.3 Knowledge Store: Marketsandmarkets’ Subscription Portal
14.4 Introducing RT: Real Time Market Intelligence
14.5 Available Customizations
14.6 Related Reports
14.7 Author Details
List of Tables (106 Tables)
Table 1 Liquid Packaging Market, By Resin
Table 2 Market, By End-Use Industry
Table 3 Liquid Packaging Market, By Packaging Type
Table 4 Market, By Technique
Table 5 Global Liquid Packaging Market Size, By Resin, 2014–2026 (USD Billion)
Table 6 Polyethylene Market Size, By Region, 2014–2026 (USD Billion)
Table 7 Polypropylene Market Size, By Region, 2014–2026 (USD Billion)
Table 8 Polyethylene Terephthalate Market, By Region, 2014–2026 (USD Billion)
Table 9 Others Market Size, By Region, 2014–2026 (USD Billion)
Table 10 Global Liquid Packaging Market Size, By Packaging Type, 2014–2026 (USD Billion)
Table 11 Flexible Liquid Packaging Market Size, By Region, 2014–2026 (USD Billion)
Table 12 Films Market Size, in Global Liquid Packaging Market, By Region, 2014–2026 (USD Billion)
Table 13 Stand-Up Pouches Market Size. in Global Liquid Packaging Market, By Region, 2014–2026 (USD Billion)
Table 14 Bag-In-Box Market Size in Global Liquid Packaging Market, By Region, 2014–2026 (USD Billion)
Table 15 Rigid Liquid Packaging Market Size in Global Liquid Packaging Market, By Region, 2014–2026 (USD Billion)
Table 16 Cartons Market Size in Global Liquid Packaging Market, By Region, 2014–2026 (USD Billion)
Table 17 Paperboard Market Size in Global Liquid Packaging Market, By Region, 2014–2026 (USD Billion)
Table 18 Plastics & PET Bottles Market Size in Global Liquid Packaging Market, By Region, 2014–2026 (USD Billion)
Table 19 Glass Market Size in Global Liquid Packaging Market, By Region, 2014–2026 (USD Billion)
Table 20 Cans Market Size in Global Liquid Packaging Market, By Region, 2014–2026 (USD Billion)
Table 21 Liquid Packaging Market Size, By End-Use Industry, 2014–2026 (USD Billion)
Table 22 Market Size in Food & Beverage End-Use Industry, By Region, 2014–2021 (USD Billion)
Table 23 Market Size in Non-Food End-Use Industry, By Region, 2014–2026 (USD Billion)
Table 24 Market Size in Industrial End-Use Industry, By Region, 2014–2026 (USD Billion)
Table 25 Market Size, By Region, 2014-2026 (USD Billion)
Table 26 Asia-Pacific: Liquid Packaging Market Size, By Country, 2014–2026 (USD Billion)
Table 27 Asia-Pacific: Market Size, By Packaging Type, 2014–2026 (USD Billion)
Table 28 Asia-Pacific: Market Size, By End-Use Industry, 2014–2026 (USD Billion)
Table 29 Asia-Pacific: Market Size, By Resin, 2014–2026 (USD Billion)
Table 30 China: By Market Size, By Packaging Type, 2014–2026 (USD Billion)
Table 31 China: By Market Size, By End-Use Industry, 2014–2026 (USD Billion)
Table 32 Japan: By Market Size, By Packaging Type, 2014–2026 (USD Billion)
Table 33 Japan: By Market Size, By End-Use Industry, 2014–2026 (USD Billion)
Table 34 India: By Market Size, By Packaging Type, 2014–2026 (USD Billion)
Table 35 India: By Market Size, By End-Use Industry, 2014–2026 (USD Billion)
Table 36 South Korea: By Market Size, By Packaging Type, 2014–2026 (USD Billion)
Table 37 South Korea: By Market Size, By End-Use Industry, 2014–2026 (USD Billion)
Table 38 Malaysia: By Market Size, By Packaging Type, 2014–2026 (USD Billion)
Table 39 Malaysia: By Market Size, By End-Use Industry, 2014–2026 (USD Billion)
Table 40 Indonesia: By Market Size, By Packaging Type, 2014–2026 (USD Billion)
Table 41 Indonesia: By Market Size, By End-Use Industry, 2014–2026 (USD Billion)
Table 42 Thailand: By Market Size, By Packaging Type, 2014–2026 (USD Billion)
Table 43 Thailand: By Market Size, By End-Use Industry, 2014–2026 (USD Billion)
Table 44 Rest of Asia-Pacific: By Market Size, By Packaging Type, 2014–2026 (USD Billion)
Table 45 Rest of Asia-Pacific: By Market Size, By End-Use Industry, 2014–2026 (USD Billion)
Table 46 North America: By Market Size, By Country, 2014–2026 (USD Billion)
Table 47 North America: By Market Size, By Packaging Type, 2014–2026 (USD Billion)
Table 48 North America: By Market Size, By End-Use Industry, 2014–2026 (USD Billion)
Table 49 North America: By Market Size, By Resin, 2014–2026 (USD Billion)
Table 50 U.S.: Liquid Packaging Market Size, By Packaging Type, 2014–2026 (USD Billion)
Table 51 U.S.: Market Size, By End-Use Industry, 2014–2026 (USD Billion)
Table 52 Canada: By Market Size, By Packaging Type, 2014–2026 (USD Billion)
Table 53 Canada: By Market Size, By End-Use Industry, 2014–2026 (USD Billion)
Table 54 Mexico: By Market Size, By Packaging Type, 2014–2026 (USD Billion)
Table 55 Mexico: By Market Size, By End-Use Industry, 2014–2026 (USD Billion)
Table 56 Western Europe: By Market Size, By Country, 2014–2026 (USD Billion)
Table 57 Western Europe: By Market Size, By Packaging Type, 2014–2026 (USD Billion)
Table 58 Western Europe: By Market Size, By End-Use Industry, 2014–2026 (USD Billion)
Table 59 Western Europe: By Market Size, By Resin, 2014–2026 (USD Billion)
Table 60 Germany: By Market Size, By Packaging Type, 2014–2026 (USD Billion)
Table 61 Germany: By Market Size, By End-Use Industry, 2014–2026 (USD Billion)
Table 62 U.K.: By Market Size, By Packaging Type, 2014–2026 (USD Billion)
Table 63 U.K.: By Market Size, By End-Use Industry, 2014–2026 (USD Billion)
Table 64 France: By Market Size, By Packaging Type, 2014–2026 (USD Billion)
Table 65 France: By Market Size, By End-Use Industry, 2014–2026 (USD Billion)
Table 66 Italy: Liquid Packaging Market Size, By Packaging Type, 2014–2026 (USD Billion)
Table 67 Italy: Market Size, By End-Use Industry, 2014–2026 (USD Billion)
Table 68 Spain: Liquid Packaging Market Size, By Packaging Type, 2014–2026 (USD Billion)
Table 69 Spain: Market Size, By End-Use Industry, 2014–2026 (USD Billion)
Table 70 Rest of Western Europe: By Market Size, By Packaging Type, 2014–2026 (USD Billion)
Table 71 Rest of Western Europe: By Market Size, By End-Use Industry, 2014–2026 (USD Billion)
Table 72 Central & Eastern Europe: By Market Size, By Country, 2014–2026 (USD Billion)
Table 73 Central & Eastern Europe: By Market Size, By Packaging Type, 2014–2026 (USD Billion)
Table 74 Central & Eastern Europe: By Market Size, By End-Use Industry, 2014–2026 (USD Billion)
Table 75 Central & Eastern Europe: By Market Size, By Packaging Type, 2014–2026(USD Billion)
Table 76 Turkey: By Market Size, By Packaging Type, 2014–2026 (USD Billion)
Table 77 Turkey: By Market Size, By End-Use Industry, 2014–2026 (USD Billion)
Table 78 Russia: By Market Size, By Packaging Type, 2014–2026 (USD Billion)
Table 79 Russia: By Market Size, By End-Use Industry, 2014–2026 (USD Billion)
Table 80 Rest of Central & Eastern Europe: By Market Size, By Packaging Type, 2014–2026 (USD Billion)
Table 81 Rest of Central & Eastern Europe: By Market Size, By End-Use Industry, 2014–2026 (USD Billion)
Table 82 Middle East & Africa: By Market Size, By Country, 2014–2026 (USD Billion)
Table 83 Middle East & Africa: By aging Market Size, By Packaging Type, 2014–2026 (USD Billion)
Table 84 Middle East & Africa: By Market Size, By End-Use Industry, 2014–2026(USD Billion)
Table 85 Middle East & Africa: By Market Size, By Resin, 2014–2026 (USD Billion)
Table 86 UAE: By Market Size, By Packaging Type, 2014–2026 (USD Billion)
Table 87 UAE: By Market Size, By End-Use Industry, 2014–2026 (USD Billion)
Table 88 Saudi Arabia: By Market Size, By Packaging Type, 2014–2026 (USD Billion)
Table 89 Saudi Arabia: By Market Size, By End-Use Industry, 2014–2026 (USD Billion)
Table 90 Africa: By Market Size, By Packaging Type, 2014–2026 (USD Billion)
Table 91 Africa: By Market Size, By End-Use Industry, 2014–2026 (USD Billion)
Table 92 Rest of Middle East: By Market Size, By Packaging Type, 2014–2026 (USD Billion)
Table 93 Rest of Middle East: By Market Size, By End-Use Industry, 2014–2026 (USD Billion)
Table 94 South America: By Market Size, By Country, 2014–2026 (USD Billion)
Table 95 South America: By Market Size, By Packaging Type, 2014–2026 (USD Billion)
Table 96 South America: By Market Size, By End-Use Industry, 2014–2026 (USD Billion)
Table 97 Brazil: Liquid Packaging Market Size, By Packaging Type 2014–2026 (USD Billion)
Table 98 Brazil: Market Size,By End-Use Industry 2014–2026 (USD Billion)
Table 99 Argentina: Liquid Packaging Market Size, By Packaging Type, 2014–2026 (USD Billion)
Table 100 Argentina: Market Size, By End-Use Industry, 2014–2026 (USD Billion)
Table 101 Rest of South America: Liquid Packaging Market Size, By Packaging Type 2014–2026 (USD Billion)
Table 102 Rest of South America: Market Size, By End-Use Industry, 2014–2026 (USD Billion)
Table 103 New Product Launches, 2011–2016
Table 104 Mergers & Acquisitions, 2011–2016
Table 105 Partnerships/Agreements/Collaborations, 2011–2016
Table 106 Expansions, 2011–2016
List of Figures (53 Figures)
Figure 1 Liquid Packaging: Market Segmentation
Figure 2 Liquid Packaging Market: Research Methodology
Figure 3 Market Size Estimation: Top-Down Approach
Figure 4 Market Size Estimation: Bottom-Up Approach
Figure 5 Data Triangulation
Figure 6 Asia-Pacific Accounted for the Largest Share of Liquid Packaging Market, 2015
Figure 7 Polyethylene to Dominate the Market, 2016–2021
Figure 8 Food & Beverage to Dominate the Liquid Packaging Market, 2016–2021
Figure 9 Films to Be the Largest Segment for the Market in the Forecast Period, 2016 and 2021
Figure 10 Significant Growth in the Liquid Packaging Market
Figure 11 Polyethylene to Be the Fastest-Growing Segment Between 2016 and 2021
Figure 12 Food & Beverage Accounted for the Largest Share in the Liquid Packaging Market in 2015
Figure 13 Liquid Packaging Market to Register High Growth in Emerging Economies Between 2016 and 2026
Figure 14 Liquid Packaging, By Region
Figure 15 Drivers, Restraints, Opportunities, and Challenges in the Market
Figure 16 Supply Chain Analysis of the Liquid Packaging Market
Figure 17 Porter’s Five Forces Analysis for the Liquid Packaging Market
Figure 18 Extrusion Blow Molding Process
Figure 19 Injection Blow Molding Process
Figure 20 Stretch Blow Molding Process
Figure 21 Polyethylene to Dominate the Market, 2016–2021
Figure 22 Asia-Pacific to Be the Largest Polyethylene Resin Market, 2016–2021
Figure 23 Films to Dominate the Flexible Liquid Packaging Market, 2016–2021
Figure 24 Asia-Pacific to Be the Largest Rigid Liquid Packaging Market, 2016–2021
Figure 25 Food & Beverage Industry to Dominate the Overall Liquid Packaging Market During the Forecast Period
Figure 26 Asia-Pacific is the Largest Liquid Packaging Market in Food & Beverage Industry
Figure 27 Liquid Packaging Market for Different End-Use Industries, By Region, 2016-2021
Figure 28 China and India to Witness Highest Growth in Market, 2016–2021
Figure 29 Liquid Packaging Market in Food & Beverage to Witness Highest Growth in China, 2016 vs 2021
Figure 30 North America: Mexico to Be the Fastest-Growing Liquid Packaging Market, 2016–2021
Figure 31 Food & Beverage to Dominate the Market in Mexico, 2016–2021
Figure 32 Food & Beverage is the Major End-Use Industry for the Liquid Packaging Market in Western Europe
Figure 33 Food & Beverage to Dominate the Market in Germany, 2016–2021
Figure 34 Central & Eastern Europe: Turkey to Be the Fastest-Growing Liquid Packaging Market, 2016–2021
Figure 35 Food & Beverage to Be the Largest End-Use Industry for the Global Liquid Packaging Market in 2015
Figure 36 Food & Beverage to Be the Largest End-Use Industry of Liquid Packaging in Africa
Figure 37 Food & Beverage to Be the Largest End-Use Industry of Brazil During the Forecast Period
Figure 38 New Product Launches and Merger & Acquisitions Were the Most Preferred Strategies Adopted By Key Companies, 2011–2016
Figure 39 Liquid Packaging Market Share Analysis
Figure 40 Battle for Developmental Share: New Product Launches Was the Key Strategy, 2011–2016
Figure 41 The DOW Chemical Company: Company Snapshot
Figure 42 The DOW Chemical Company: SWOT Analysis
Figure 43 International Paper: Company Snapshot
Figure 44 International Paper: SWOT Analysis
Figure 45 Tetra Pak International S.A.: Company Snapshot
Figure 46 Tetra Pak International S.A.: SWOT Analysis
Figure 47 Smurfit Kappa: Company Snapshot
Figure 48 Smurfit Kappa: SWOT Analysis
Figure 49 Mondi PLC: Company Snapshot
Figure 50 Mondi PLC: SWOT Analysis
Figure 51 Weyerhaeuser Company: Company Snapshot
Figure 52 Billerudkorsnäs AB: Company Snapshot
Figure 53 Sidel: Company Snapshot


Growth opportunities and latent adjacency in Liquid Packaging Market