Liquid Nitrogen Market by End-Use Industry (Chemicals & Pharmaceuticals), by Storage, Distribution & Transportation (Cylinder & Packaged Gas), by Function (Coolant, Refrigerant), by Production Technology (Cryogenic Distillation) - Global Forecast to 2020


[222 Pages Report] The liquid nitrogen market is projected to grow from USD 12,483.7 Million in 2015 to USD 16,144.6 Million by 2020, at an estimated CAGR of 5.28%. The liquid nitrogen market is expected to grow rapidly in accordance with the growth in the industrial gas market globally. Liquid nitrogen is used as a cryogen, wherever low temperatures is required. It is widely used in cryosurgeries, cryotherapies, and cryopreservation to destroy decayed tissues and to remove warts, moles, skin tags, verrucas, and some skin cancers. Additionally, it is used as a coolant in temporary shrinking of mechanical gears at the time of machine assembly, thus make better intrusion fits. This function is expected to foster the demand for liquid nitrogen during the forecast period. This report aims at estimating the market size and future growth potential of the liquid nitrogen market across different segments such as function, production technology, end-use industry, distribution mode, and region. Base year considered for the study is 2014 and the market size is projected from 2015 to 2020. Factors such as growing industrialization and burgeoning energy markets and medical sector are expected to be the major growth drivers of the liquid nitrogen market in the next five years.
The research methodology used to estimate and forecast the liquid nitrogen market begins with capturing data on key vendor revenues through secondary research. The vendor offerings are also taken into consideration to determine the market segmentation. The bottom-up procedure was employed to arrive at the overall market size of the global liquid nitrogen market from the revenue of the key players in the market. After arriving at the overall market size, the total market was split into several segments and sub-segments, which are then verified through primary research by conducting extensive interviews with key people such as CEOs, VPs, directors, and executives. These data triangulation and market breakdown procedures were employed to complete the overall market engineering process and arrive at the exact statistics for all segments and sub-segments. The breakdown of profiles of primary is depicted in the below figure:
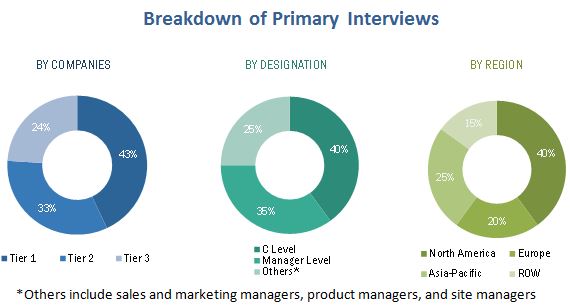
To know about the assumptions considered for the study, download the pdf brochure
The eco-system of liquid nitrogen market comprises liquid nitrogen companies such as Air Products and Chemicals Inc. (U.S), Linde Ag (Germany), Praxair Inc., (U.S.), Nexair LLC. (U.S.), Air Liquide S.A. (France), Taiyo Nippon Sanso Corporation (Japan), Gulf Cryo (United Arab Emirates), Emirates Industrial Gases Co. LLC. (United Arab Emirates), and Southern Industrial Gas BHD (Malaysia).
Target Audience
- OEM companies
- Electronic equipment manufacturers
- Metal manufacturers and fabricators
- Medical equipment manufacturers
- Consulting firms
Scope of the Report
The research report segments the liquid nitrogen market to following submarkets:
By End-use Industry:
- Chemicals & pharmaceuticals
- Food & beverage
- Healthcare
- Metal manufacturing & construction
- Rubber & Plastic
- Others (electronics and energy)
By storage, distribution, and transportation:
- Cylinder & packaged distribution
- Merchant liquid distribution
- Tonnage distribution
By Function:
- Coolant
- Refrigerant
By manufacturing process:
- Cryogenic distillation
- Pressure swing adsorption
By Region:
- North America
- Europe
- Asia-Pacific
- RoW
Available Customizations
With the given market data, MarketsandMarkets offers customizations according to client-specific needs. The following customization options are available for the report:
Product Analysis
- Product Matrix, which gives a detailed comparison of product portfolio of each company
Geographic Analysis
- Further breakdown of the North America liquid nitrogen market
- Further breakdown of the Europe liquid nitrogen market
- Further breakdown of the APAC liquid nitrogen market
- Further breakdown of the RoW liquid nitrogen market
Company Information
- Detailed analysis and profiling of additional market players
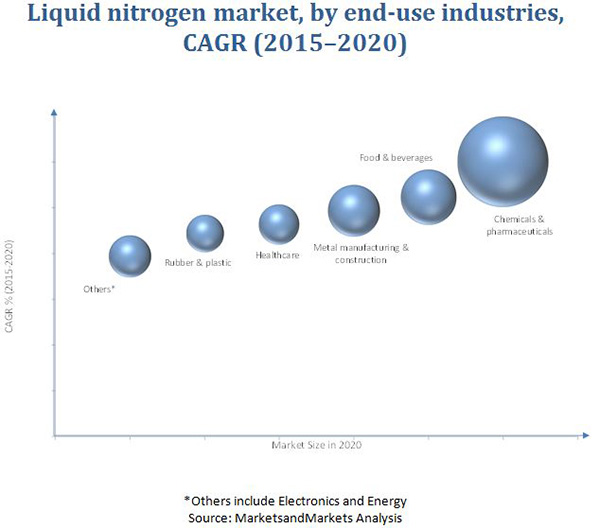
MarketsandMarkets projects that the liquid nitrogen market size will grow from USD 12.48 Billion in 2015 to USD 16.14 Billion by 2020, at an estimated CAGR of 5.28%. The increasing demand in various applications such as metal fabrication, electronics, healthcare, automotive, and lighting are the major factors driving the growth of the liquid nitrogen industry. Additionally, with rapid urbanization, growth in infrastructural activities, and increasing industrialization and the medical sector across the globe, there is a rapid increase in the demand for liquid nitrogen. Liquid nitrogen is used in electronics, fabrication of specialty alloys, lasers, metals, and other industrial applications. The chemicals & pharmaceuticals segment is projected to have the largest market share and dominate the liquid nitrogen market from 2015 to 2020, as various applications in these industries use liquid nitrogen. Chemicals and medical & healthcare sectors are to play a key role in changing the liquid nitrogen landscape and grow at a high rate during the forecast period.
Coolant is projected to form the fastest-growing function in the liquid nitrogen market as it is used in many end-use industries such as metal manufacturing & construction, chemicals & pharmaceuticals, and healthcare. The cylinder & packaged distribution mode is projected to account for the largest market share in the liquid nitrogen market. Verticals such as tonnage distribution and merchant liquid distribution will be key growing distribution modes during the forecast period.
North America is projected to have the largest market share and dominate the market for liquid nitrogen from 2015 to 2020. Asia-Pacific offers potential growth opportunities, as developing countries such as China and India are projected to be emerging markets, making the Asia-Pacific region the fastest-growing market for liquid nitrogen. The growth of the liquid nitrogen market in this region is driven by factors such as the growth of the metal manufacturing & fabrication industry, rise in demand for electronic products from the growing population, and economic development.
However, the structural and regulatory restrictions are restraining the growth of the liquid nitrogen market. The manufacturers must take necessary precautions in the handling, storage, & transportation of liquid nitrogen as per the regulations. The major vendors in the liquid nitrogen market include Praxair Inc. (U.S.), Air Liquide S.A. (France), The Linde Group (Germany), Messer Group (Germany), Nexair LLC. (U.S.), Taiyo Nippon Sanso Corporation (Japan), Air Products and Chemicals, Inc. (U.S.), Gulf Cryo (United Arab Emirates), Emirates Industrial Gases Co. LLC. (United Arab Emirates), and Southern Industrial Gas Berhad (Malaysia). These players adopted various strategies such as mergers & acquisitions, partnerships, joint ventures, new product developments, and business expansion to cater to the needs of the liquid nitrogen market.
 Exclusive indicates content/data unique to MarketsandMarkets and not available with any competitors.
Table of Contents
1 Introduction (Page No. - 25)
1.1 Objectives of the Study
1.2 Market Definition
1.3 Study Scope
1.3.1 Periodization Considered for the Liquid Nitrogen Market
1.4 Currency Considered for the Liquid Nitrogen Market
1.5 Unit Considered for the Liquid Nitrogen Market
1.6 Stakeholders
2 Research Methodology (Page No. - 28)
2.1 Research Data
2.1.1 Secondary Data
2.1.1.1 Key Data From Secondary Sources
2.1.2 Primary Data
2.1.2.1 Key Data From Primary Sources
2.1.2.2 Breakdown of Primary Interviews
2.2 Factor Analysis
2.2.1 Introduction
2.2.2 Demand-Side Analysis
2.2.2.1 Rising Population
2.2.2.2 Increasing Income and Spending Capacity
2.2.3 Supply-Side Analysis
2.2.3.1 Industry Regulations
2.2.3.2 Fluctuations in Fuel Prices
2.3 Market Size Estimation
2.4 Market Breakdown and Data Triangulation
2.5 Market Share Estimation
2.6 Research Assumptions & Limitations
2.6.1 Assumptions
2.6.2 Assumptions Made for This Study
2.6.3 Limitations
3 Executive Summary (Page No. - 41)
3.1 Chemicals & Pharmaceuticals is Projected to Account for the Largest Share By 2020
3.2 North America is Projected to Dominate the Global Liquid Nitrogen Market By 2020
3.3 The Indian Market is Projected to Grow at the Highest CAGR From 2015 to 2020
4 Premium Insights (Page No. - 46)
4.1 Attractive Market Opportunities in the Liquid Nitrogen Market
4.2 Liquid Nitrogen Market in the Asia-Pacific Region
4.3 Emerging and Developed Markets for Liquid Nitrogen, 2015 vs 2020
5 Market Overview (Page No. - 50)
5.1 Introduction
5.2 Market Evolution
5.3 Liquid Nitrogen Market Segmentation
5.3.1 By End-Use Industry
5.3.2 By Function
5.3.3 By Storage, Transportation & Distribution
5.4 Market Dynamics
5.4.1 Drivers
5.4.1.1 Electronic Products Have Seen an Increased Demand
5.4.1.2 Healthcare Sector has Seen A Steady Growth
5.4.1.3 Growing Food & Beverage Industry
5.4.2 Restraints
5.4.2.1 Structural and Regulatory Restrictions
5.4.3 Opportunities
5.4.3.1 High Demand From Chemical Industry
5.4.4 Challenges
5.4.4.1 Intricate Manufacturing Process
6 Industry Trends (Page No. - 58)
6.1 Introduction
6.2 Value Chain
6.3 Porter�s Five Forces Analysis
6.3.1 Threat of New Entrants
6.3.2 Threats of Substitutes
6.3.3 Bargaining Power of Suppliers
6.3.4 Bargaining Power of Buyers
6.3.5 Intensity of Competitive Rivalry
7 Liquid Nitrogen Market, By End-Use Industry (Page No. - 64)
7.1 Introduction
7.1.1 By End-Use Industry
7.1.1.1 Chemicals & Pharmaceuticals is the Fastest-Growing Segment for Liquid Nitrogen During the Review Period
7.2 Healthcare
7.3 Food & Beverages
7.4 Chemicals & Pharmaceuticals
7.5 Metal Manufacturing & Construction
7.6 Rubber & Plastic
7.7 Others
8 Liquid Nitrogen Market, By Storage, Distribution & Transportation (Page No. - 69)
8.1 Introduction
8.1.1 By Storage, Distribution & Transportation
8.1.1.1 Cylinder & Packaged Gas Segment is Projected to Grow at the Highest CAGR
8.2 Cylinders & Packaged Gas
8.3 Merchant Liquid/Bulk
8.4 Tonnage
9 Liquid Nitrogen Market, By Function (Page No. - 74)
9.1 Introduction
9.1.1 By Function
9.1.1.1 Coolant Projected to Be the Fastest-Growing Function in Liquid Nitrogen, By 2020
9.2 Coolant
9.2.1 Coolant in Liquid Nitrogen Market, By End-Use Industry
9.2.1.1 Chemicals & Pharmaceuticals Dominated the Market in 2014
9.3 Refrigerant
9.3.1 Refrigerant in Liquid Nitrogen Market Size, By End-Use Industry
9.3.1.1 Food & Beverages Projected to Be the Fastest-Growing End-Use Industry of Refrigerant, By 2020
10 Liquid Nitrogen Market, By Production Technology (Page No. - 80)
10.1 Introduction
10.1.1 Size, By Production Technology
10.1.1.1 Cryogenic Distillation Dominated the Market, By Production Technology, in 2014
10.2 Cryogenic Distillation
10.3 Pressure Swing Adsorption
11 Liquid Nitrogen Market, By Region (Page No. - 84)
11.1 Introduction
11.1.1 Size, By Region
11.1.1.1 North America Dominated the Market for Liquid Nitrogen in 2014
11.2 North America
11.2.1 North America: Size, By Country
11.2.1.1 U.S. is Projected to Be the Fastest-Growing Market By 2020
11.2.1.2 North America: Size, By End-Use Industry
11.2.1.2.1 North American Market Driven By Growing Chemicals & Pharmaceuticals Industry
11.2.1.3 North America: Size, By Storage, Distribution & Transportation
11.2.1.3.1 Cylinder & Packaged Gas Distribution Segment Dominated the Market in North America
11.2.1.4 North America: Size, By Function
11.2.1.4.1 Coolant Segment Accounted for the Largest Share Owing to Its Growing Function in the Liquid Nitrogen Industry
11.2.1.5 North America: Size, By Production Technology
11.2.1.5.1 Pressure Swing Adsorption Segment to Grow at the Highest Rate By 2020
11.2.2 U.S.
11.2.2.1 U.S.: Size, By End-Use Industry
11.2.2.1.1 Chemicals & Pharmaceuticals Segment Dominated the Market in the U.S., in 2014
11.2.2.2 U.S.: Size, By Storage, Distribution & Transportation
11.2.2.2.1 Cylinder & Packaged Gas Distribution Segment Dominated the Market in 2014
11.2.2.3 U.S.: Size, By Function
11.2.2.3.1 Coolant Showing Signs of Potential Growth in the U.S.
11.2.2.4 U.S.: Size, By Production Technology
11.2.2.4.1 Cryogenic Distillation Segment Accounted for the Largest Share in 2014
11.2.3 Canada
11.2.3.1 Canada: Size, By End-Use Industry
11.2.3.1.1 Chemicals & Pharmaceuticals Was the Largest Segment in 2014
11.2.3.2 Canada: Size, By Storage, Distribution, & Transportation
11.2.3.2.1 Cylinder & Packaged Gas Distribution Segment to Grow at the Highest Rate By 2020
11.2.3.3 Canada: Size, By Function
11.2.3.3.1 Coolant Function Dominated the Liquid Nitrogen Market in 2014
11.2.3.4 Canada: Size, By Production Technology
11.2.3.4.1 Pressure Swing Adsorption Segment to Grow at the Highest CAGR in the Canadian Market
11.2.4 Mexico
11.2.4.1 Mexico: Size, By End-Use Industry
11.2.4.1.1 Mexican , By End-Use Industry, Was Dominated By Chemicals & Pharmaceuticals Segment in 2014
11.2.4.2 Mexico: Size, By Storage, Distribution, & Transportation
11.2.4.2.1 Cylinder & Packaged Gas Distribution Segment to Grow at the Highest Rate By 2020
11.2.4.3 Mexico: Size, By Function
11.2.4.3.1 Refrigerant Segment to Grow at the Second-Highest Rate By 2020
11.2.4.4 Mexico: Size, By Production Technology
11.2.4.4.1 Cryogenic Distillation Segment Dominated the Market in 2014
11.3 Asia-Pacific
11.3.1 Asia-Pacific: Size, By Country
11.3.1.1 China Dominated the Asia-Pacific Liquid Nitrogen in 2014
11.3.1.2 Asia-Pacific: Size, By End-Use Industry
11.3.1.2.1 Chemicals & Pharmaceuticals Accounted for the Largest Market Share in 2014, By Value
11.3.1.3 Asia-Pacific: Size, By Storage, Distribution, & Transportation
11.3.1.3.1 Cylinder & Packaged Gas Distribution to Grow at the Highest CAGR By 2020
11.3.1.4 Asia-Pacific: Size, By Function
11.3.1.4.1 Coolant to Grow at the Highest Rate By 2020
11.3.1.5 Asia-Pacific: Size, By Production Technology
11.3.1.5.1 Cryogenic Distillation Was the Largest Market in 2014
11.3.2 China
11.3.2.1 China: Size, By End-Use Industry
11.3.2.1.1 Growing Chemicals & Pharmaceuticals Industry is Driving the in China
11.3.2.2 China: Size, By Storage, Distribution, & Transportation
11.3.2.2.1 Cylinder & Packaged Gas Distribution Dominated the Chinese Market
11.3.2.3 China: Size, By Function
11.3.2.3.1 Coolant Dominated the Market in China
11.3.2.4 China: Size, By Production Technology
11.3.2.4.1 Cryogenic Distillation Projected to Grow at the Highest Rate By 2020
11.3.3 India
11.3.3.1 India: Size, By End-Use Industry
11.3.3.1.1 Chemicals & Pharmaceuticals Projected to Grow at the Highest Rate By 2020
11.3.3.2 India: Size, By Storage, Distribution & Transportation
11.3.3.2.1 Cylinder & Packaged Gas Distribution Dominated the Market in 2014
11.3.3.3 India: Size, By Function
11.3.3.3.1 India is Largely Driven By Growth in the Income of Middle-Class Population
11.3.3.4 India: Size, By Production Technology
11.3.3.4.1 Cryogenic Distillation Showing Potential for Growth in India
11.3.4 Japan
11.3.4.1 Japan: Size, By End-Use Industry
11.3.4.1.1 Chemicals & Pharmaceuticals to Grow at the Highest CAGR By 2020
11.3.4.2 Japan: Size, By Storage, Distribution & Transportation
11.3.4.2.1 Cylinder & Packaged Gas Distribution Dominated the Market in 2014
11.3.4.3 Japan: Size, By Function
11.3.4.3.1 Function of Liquid Nitrogen in Coolant Was the Highest in 2014
11.3.4.4 Japan: Size, By Production Technology
11.3.4.4.1 Cryogenic Distillation Projected to Grow at the Highest Rate By 2020
11.3.5 South Korea
11.3.5.1 South Korea: Size, By End-Use Industry
11.3.5.1.1 Food & Beverage to Grow at the Second-Highest CAGR By 2020
11.3.5.2 South Korea: Size, By Storage, Distribution & Transportation
11.3.5.2.1 Merchant Liquid Distribution to Grow at the Second Highest Rate By 2020
11.3.5.3 South Korea: Size, By Function
11.3.5.3.1 Function of Liquid Nitrogen in Coolant Was the Largest in 2014
11.3.5.4 South Korea: Size, By Production Technology
11.3.5.4.1 Cryogenic Distillation Accounted for the Largest Market Share in 2014
11.3.6 Rest of Asia-Pacific
11.3.6.1 Rest of Asia-Pacific: Size, By End-Use Industry
11.3.6.1.1 Chemicals & Pharmaceuticals Held the Largest Share in the Rest of Apac Liquid Nitrogen Market
11.3.6.2 Rest of Asia-Pacific:Size, By Storage, Distribution & Transportation
11.3.6.2.1 Cylinder & Packaged Gas Distribution Was the Largest Market in 2014
11.3.6.3 Rest of Asia-Pacific: Size, By Function
11.3.6.3.1 Refrigerant Was the Second-Largest Function for Liquid Nitrogen in 2014
11.3.6.4 Rest of Asia-Pacific:Size, By Production Technology
11.3.6.4.1 Pressure Swing Adsorption Was the Second-Largest Market in 2014
11.4 Europe
11.4.1 Europe: Liquid Nitrogen Market Size, By Country
11.4.1.1 Germany Held the Largest Share in the European Liquid Nitrogen Market
11.4.1.2 Europe: Liquid Nitrogen Market Size, By End-Use Industry
11.4.1.2.1 Chemicals & Pharmaceuticals to Grow at The Highest CAGR By 2020
11.4.1.3 Europe: Liquid Nitrogen Market Size, By Storage, Distribution, & Transportation
11.4.1.3.1 Cylinder & Packaged Gas Distribution Dominated the Market in Europe
11.4.1.4 Europe: Liquid Nitrogen Market Size, By Function
11.4.1.4.1 Coolant Dominated the Market in Europe in 2014
11.4.1.5 Europe: Liquid Nitrogen Market Size, By Production Technology
11.4.1.5.1 Cryogenic Distillation Dominated the Liquid Nitrogen in Europe
11.4.2 Germany
11.4.2.1 Germany: Liquid Nitrogen Market Size, By End-Use Industry
11.4.2.1.1 Chemicals & Pharmaceuticals Accounted for the Largest Market Share in 2014
11.4.2.2 Germany: Liquid Nitrogen Market Size, By Storage, Distribution, & Transportation
11.4.2.2.1 Merchant Liquid Distribution Was the Second-Largest Market in 2014 in Germany
11.4.2.3 Germany: Liquid Nitrogen Market Size, By Function
11.4.2.3.1 Refrigerant Was the Second-Largest Market in 2014 in Germany
11.4.2.4 Germany: Liquid Nitrogen Market Size, By Production Technology
11.4.2.4.1 Cryogenic Distillation Accounted for the Largest Market Share in 2014
11.4.3 France
11.4.3.1 France: Liquid Nitrogen Market Size, By End-Use Industry
11.4.3.1.1 Chemicals & Pharmaceuticals Projected to Grow at the Highest Rate By 2020
11.4.3.2 France: Liquid Nitrogen Market Size, By Storage, Distribution, & Transportation
11.4.3.2.1 Cylinder & Packaged Gas Distribution Accounted for the Largest Share in France
11.4.3.3 France: Liquid Nitrogen Market Size, By Function
11.4.3.3.1 Coolant Dominated the Liquid Nitrogen Market in 2014
11.4.3.4 France: Liquid Nitrogen Market Size, By Production Technology
11.4.3.4.1 Cryogenic Distillation Dominated the Liquid Nitrogen Market in 2014
11.4.4 U.K.
11.4.4.1 U.K.: Liquid Nitrogen Market Size, By End-Use Industry
11.4.4.1.1 Food & Beverages Projected to Grow at the Second-Highest Rate
11.4.4.2 U.K.: Liquid Nitrogen Market Size, By Storage, Distribution, & Transportation
11.4.4.2.1 Cylinder & Packaged Gas Distribution Showing Growth Potential in the U.K.
11.4.4.3 U.K.: Liquid Nitrogen Market Size, By Function
11.4.4.3.1 Coolant Dominated the U.K. Market for Liquid Nitrogen
11.4.4.4 U.K.: Liquid Nitrogen Market Size, By Production Technology
11.4.4.4.1 Cryogenic Distillation Dominated the U.K. Market for Liquid Nitrogen
11.4.5 Belgium
11.4.5.1 Belgium: Liquid Nitrogen Market Size, By End-Use Industry
11.4.5.1.1 Food & Beverages to Grow at the Second-Highest Rate By 2020 in Belgium
11.4.5.2 Belgium: Liquid Nitrogen Market Size, By Storage, Distribution, & Transportation
11.4.5.2.1 Cylinder & Packaged Gas Distribution Showing Growth Potential in Belgium
11.4.5.3 Belgium: Liquid Nitrogen Market Size, By Function
11.4.5.3.1 Coolant Segment Dominated the Belgium Market for Liquid Nitrogen
11.4.5.4 Belgium: Liquid Nitrogen Market Size, By Production Technology
11.4.5.4.1 Cryogenic Distillation Dominated the Belgium Market for Liquid Nitrogen
11.4.6 Rest of Europe
11.4.6.1 Rest of Europe: Liquid Nitrogen Market Size, By End-Use Industry
11.4.6.1.1 Chemicals & Pharmaceuticals to Grow at the Highest CAGR By 2020
11.4.6.2 Rest of Europe: Liquid Nitrogen Market Size, By Storage, Distribution, & Transportation
11.4.6.2.1 Merchant Liquid Distribution Projected to Grow at the Second-Highest CAGR By 2020
11.4.6.3 Rest of Europe: Liquid Nitrogen Market Size, By Function
11.4.6.3.1 Coolant Segment Accounted for the Largest Share in 2014 and is Also Projected to Grow at the Highest CAGR By 2020
11.4.6.4 Rest of Europe: Liquid Nitrogen Market Size, By Production Technology
11.4.6.4.1 Cryogenic Distillation to Grow at the Second-Highest Rate By 2020
11.5 RoW
11.5.1 RoW: Liquid Nitrogen Market Size, By Country
11.5.1.1 Brazil Dominated the RoW Liquid Nitrogen Market in 2014
11.5.1.2 RoW: Liquid Nitrogen Market Size, By End-Use Industry
11.5.1.2.1 Food & Beverages Segment to Grow at the Second-Highest Rate By 2020
11.5.1.3 RoW: Liquid Nitrogen Market Size, By Storage, Distribution, & Transportation
11.5.1.3.1 Cylinder & Packaged Gas Distribution Segment Dominated the Market in 2014
11.5.1.4 RoW: Liquid Nitrogen Market Size, By Function
11.5.1.4.1 Coolant Segment Dominated the Market in 2014, in RoW
11.5.1.5 RoW: Liquid Nitrogen Market Size, By Production Technology
11.5.1.5.1 Pressure Swing Adsorption Segment is Projected to Have Potential Growth By 2020
11.5.2 Brazil
11.5.2.1 Brazil: Liquid Nitrogen Market Size, By End-Use Industry
11.5.2.1.1 Liquid Nitrogen Market in Brazil Was Dominated By the Chemicals & Pharmaceuticals Segment in 2014
11.5.2.2 Brazil: Liquid Nitrogen Market Size, By Storage, Distribution, & Transportation
11.5.2.2.1 Cylinder & Packaged Gas Distribution to Grow at the Highest Rate By 2020
11.5.2.3 Brazil: Liquid Nitrogen Market Size, By Function
11.5.2.3.1 Coolant Segment Dominated the Brazilian Market for Liquid Nitrogen in 2014
11.5.2.4 Brazil: Liquid Nitrogen Market Size, By Production Technology
11.5.2.4.1 Pressure Swing Adsorption Segment is Projected to Grow at the Highest CAGR By 2020
11.5.3 Saudi Arabia
11.5.3.1 Saudi Arabia: Liquid Nitrogen Market Size, By End-Use Industry
11.5.3.1.1 Chemicals & Pharmaceuticals Segment Dominated the Market in Saudi Arabia
11.5.3.2 Saudi Arabia: Liquid Nitrogen Market Size, By Storage, Distribution, & Transportation
11.5.3.2.1 Cylinder & Packaged Gas Distribution Segment Projected to Grow at the Highest Rate By 2020
11.5.3.3 Saudi Arabia: Liquid Nitrogen Market Size, By Function
11.5.3.3.1 Coolant Segment is Expected to Have Potential Growth Opportunities By 2020
11.5.3.4 Saudi Arabia: Liquid Nitrogen Market Size, By Production Technology
11.5.3.4.1 Cryogenic Distillation Segment Dominated the Market in 2014
11.5.4 South Africa
11.5.4.1 South Africa: Liquid Nitrogen Market Size, By End-Use Industry
11.5.4.1.1 Chemicals & Pharmaceuticals Segment Dominated the Market in South Africa
11.5.4.2 South Africa: Liquid Nitrogen Market Size, By Storage, Distribution, & Transportation
11.5.4.2.1 Merchant Liquid Distribution Segment Projected to Grow at the Second-Highest Rate By 2020
11.5.4.3 South Africa: Liquid Nitrogen Market Size, By Function
11.5.4.3.1 Coolant Segment is Expected to Have Potential Growth Opportunities By 2020
11.5.4.4 South Africa: Liquid Nitrogen Market Size, By Production Technology
11.5.4.4.1 Cryogenic Distillation Segment Dominated the Market in 2014
11.5.5 Other RoW Countries
11.5.5.1 Other RoW. Countries: Liquid Nitrogen Market Size, By End-Use Industry
11.5.5.1.1 Chemicals & Pharmaceuticals Segment Projected to Grow at the Highest Rate By 2020
11.5.5.2 Other RoW. Countries: Liquid Nitrogen Market Size, By Storage, Distribution, & Transportation
11.5.5.2.1 Cylinder & Packaged Gas Distribution Segment is Projected to Grow at the Highest CAGR By 2020
11.5.5.3 Other RoW Countries: Liquid Nitrogen Market Size, By Function
11.5.5.3.1 Refrigerant Segment is Projected to Grow at the Second-Highest CAGR By 2020
11.5.5.4 Other RoW Countries: Liquid Nitrogen Market Size, By Production Technology
11.5.5.4.1 Cryogenic Distillation Segment Accounted for the Largest Market Share in 2014
12 Competitive Landscape (Page No. - 183)
12.1 Overview
12.2 Development Analysis
12.3 Competitive Situations & Trends
12.4 Partnerships, Agreements, and Joint Ventures� the Key Growth Strategy, 2011�2015
12.4.1 Partnerships, Agreements, and Joint Ventures
12.4.2 Expansions
12.4.3 Mergers & Acquisitions
12.4.4 New Product Launches
13 Company Profiles (Page No. - 190)
(Company at A Glance, Recent Financials, Products & Services, Strategies & Insights, & Recent Developments)*
13.1 Introduction
13.2 The Linde Group
13.3 Praxair Inc.
13.4 Air Liquide S.A.
13.5 Air Products and Chemicals, Inc.
13.6 Gulf Cryo
13.7 Southern Industrial Gas Berhad
13.8 Messer Group
13.9 Emirates Industrial Gases Co. LLC
13.10 Taiyo Nippon Sanso Corporation
13.11 Nexair LLC
*Details on Company at A Glance, Recent Financials, Products & Services, Strategies & Insights, & Recent Developments Might Not Be Captured in Case of Unlisted
Companies.
14 Appendix (Page No. - 212)
14.1 Insights of Industry Experts
14.2 Discussion Guide
14.3 Company Developments
14.3.1 Partnerships, Agreements, and Joint Ventures
14.3.2 Expansions
14.3.3 Mergers & Acquisitions
14.3.4 New Product Launches
14.4 Introducing RT: Real-Time Market Intelligence
14.5 Available Customizations
List of Tables (200 Tables)
Table 1 Liquid Nitrogen Market Snapshot
Table 2 End-Use Industry & Description
Table 3 Manufacturing Process & Description
Table 4 Distribution Mode & Description
Table 5 The Standard By Compressed Gas Association:
Table 6 Size, By End-Use Industry, 2013�2020 (Usd Million)
Table 7 Market Size, By End-Use Industry, 2013�2020 (Million Tons)
Table 8 Market Size, By Storage, Distribution & Transportation, 2013�2020 (Usd Million)
Table 9 Market Size, By Storage, Distribution & Transportation, 2013�2020 (Million Tons)
Table 10 Regulations On Transportation And Storage Of Gas Cylinders
Table 11 Size, By Function, 2013�2020 (Usd Million)
Table 12 Market Size, By Function, 2013�2020 (Million Tons)
Table 13 Coolant: Size, By End-Use, 2013�2020 (Usd Million)
Table 14 Coolant: Market Size, By End-Use, 2013�2020 (Million Tons)
Table 15 Refrigerant: Size, By End-Use, 2013�2020 (Usd Million)
Table 16 Refrigerant: Size, By End-Use, 2013�2020 (Million Tons)
Table 17 Size, By Production Technology, 2013�2020 (Usd Million)
Table 18 Market Size, By Production Technology, 2013�2020 (Million Tons)
Table 19 Market Size, By Region, 2013�2020 (Usd Million)
Table 20 Market Size, By Region, 2013�2020 (Million Tons)
Table 21 North America: Size, By Country, 2013�2020 (Usd Million)
Table 22 North America: Size, By Country, 2013�2020 (Million Tons)
Table 23 North America: Size, By End-Use Industry, 2013�2020 (Usd Million)
Table 24 North America: Size, By End-Use Industry, 2013�2020 (Million Tons)
Table 25 North America: Size, By Storage, Distribution & Transportation, 2013�2020 (Usd Million)
Table 26 North America: Size, By Storage, Distribution & Transportation, 2013�2020 (Million Tons)
Table 27 North America: Size, By Function, 2013�2020 (Usd Million)
Table 28 North America: Size, By Function, 2013�2020 (Million Tons)
Table 29 North America: Size, By Production Technology, 2013�2020 (Usd Million)
Table 30 North America: Size, By Production Technology, 2013�2020 (Million Tons)
Table 31 U.S.: Size, By End-Use Industry, 2013�2020 (Usd Million)
Table 32 U.S.: By Market Size, By End-Use Industry, 2013�2020 (Million Tons)
Table 33 U.S.: By Market Size, By Storage, Distribution & Transportation, 2013�2020 (Usd Million)
Table 34 U.S.: By Market Size, By Storage, Distribution & Transportation, 2013�2020 (Million Tons)
Table 35 U.S.: By Market Size, By Function, 2013�2020 (Usd Million)
Table 36 U.S.: By Market Size, By Function, 2013�2020 (Million Tons)
Table 37 U.S.: By Market Size, By Production Technology, 2013�2020 (Usd Million)
Table 38 U.S.: By Market Size, By Production Technology, 2013�2020 (Million Tons)
Table 39 Canada: Size, By End-Use Industry, 2013�2020 (Usd Million)
Table 40 Canada: By Market Size, By End-Use Industry, 2013�2020 (Million Tons)
Table 41 Canada: By Market Size, By Storage, Distribution & Transportation, 2013�2020 (Usd Million)
Table 42 Canada: By Market Size, By Storage, Distribution & Transportation, 2013�2020 (Million Tons)
Table 43 Canada: By Market Size, By Function, 2013�2020 (Usd Million)
Table 44 Canada: By Market Size, By Function, 2013�2020 (Million Tons)
Table 45 Canada: By Market Size, By Production Technology, 2013�2020 (Usd Million)
Table 46 Canada: By Market Size, By Production Technology, 2013�2020 (Million Tons)
Table 47 Mexico: Size, By End-Use Industry, 2013�2020 (Usd Million)
Table 48 Mexico: By Market Size, By End-Use Industry, 2013�2020 (Million Tons)
Table 49 Mexico: By Market Size, By Storage, Distribution & Transportation, 2013�2020 (Usd Million)
Table 50 Mexico: By Market Size, By Storage, Distribution & Transportation, 2013�2020 (Million Tons)
Table 51 Mexico: By Market Size, By Function, 2013�2020 (Usd Million)
Table 52 Mexico: By Market Size, By Function, 2013�2020 (Million Tons)
Table 53 Mexico: By Market Size, By Production Technology, 2013�2020 (Usd Million)
Table 54 Mexico: By Market Size, By Production Technology, 2013�2020 (Million Tons)
Table 55 Asia-Pacific: Size, By Country, 2013�2020 (Usd Million)
Table 56 Asia-Pacific: By Market Size, By Country, 2013�2020 (Million Tons)
Table 57 Asia-Pacific: By Market Size, By End-Use Industry, 2013�2020 (Usd Million)
Table 58 Asia-Pacific: By Market Size, By End-Use Industry, 2013�2020 (Million Tons)
Table 59 Asia-Pacific: By Market Size, By Storage, Distribution & Transportation, 2013�2020 (Usd Million)
Table 60 Asia-Pacific: By Market Size, By Storage, Distribution & Transportation, 2013�2020 (Million Tons)
Table 61 Asia-Pacific: By Market Size, By Function, 2013�2020 (Usd Million)
Table 62 Asia-Pacific: By Market Size, By Function, 2013�2020 (Million Tons)
Table 63 Asia-Pacific: By Market Size, By Production Technology, 2013�2020 (Usd Million)
Table 64 Asia-Pacific: By Market Size, By Production Technology, 2013�2020 (Million Tons)
Table 65 China: Size, By End-Use Industry, 2013�2020 (Usd Million)
Table 66 China: By Market Size, By End-Use Industry, 2013�2020 (Million Tons)
Table 67 China: By Market Size, By Storage, Distribution & Transportation, 2013�2020 (Usd Million)
Table 68 China: By Market Size, By Storage, Distribution & Transportation, 2013�2020 (Million Tons)
Table 69 China: By Market Size, By Function, 2013�2020 (Usd Million)
Table 70 China: By Market Size, By Function, 2013�2020 (Million Tons)
Table 71 China: By Market Size, By Production Technology, 2013�2020 (Usd Million)
Table 72 China: By Market Size, By Production Technology, 2013�2020 (Million Tons)
Table 73 India: Size, By End-Use Industry, 2013�2020 (Usd Million)
Table 74 India: By Market Size, By End-Use Industry, 2013�2020 (Million Tons)
Table 75 India: By Market Size, By Storage, Distribution & Transportation, 2013�2020 (Usd Million)
Table 76 India: By Market Size, By Storage, Distribution & Transportation, 2013�2020 (Million Tons)
Table 77 India: By Market Size, By Function, 2013�2020 (Usd Million)
Table 78 India: By Market Size, By Function, 2013�2020 (Million Tons)
Table 79 India: By Market Size, By Production Technology, 2013�2020 (Usd Million)
Table 80 India: By Market Size, By Production Technology, 2013�2020 (Million Tons)
Table 81 Japan: Size, By End-Use Industry, 2013�2020 (Usd Million)
Table 82 Japan: By Market Size, By End-Use Industry, 2013�2020 (Million Tons)
Table 83 Japan: By Market Size, By Storage, Distribution & Transportation, 2013�2020 (Usd Million)
Table 84 Japan: By Market Size, By Storage, Distribution & Transportation, 2013�2020 (Million Tons)
Table 85 Japan: By Market Size, By Function, 2013�2020 (Usd Million)
Table 86 Japan: By Market Size, By Function, 2013�2020 (Million Tons)
Table 87 Japan: By Market Size, By Production Technology, 2013�2020 (Usd Million)
Table 88 Japan: By Market Size, By Production Technology, 2013�2020 (Million Tons)
Table 89 South Korea: Size, By End-Use Industry, 2013�2020 (Usd Million)
Table 90 South Korea: By Market Size, By End-Use Industry, 2013�2020 (Million Tons)
Table 91 South Korea: By Market Size, By Storage, Distribution & Transportation, 2013�2020 (Usd Million)
Table 92 South Korea: By Market Size, By Storage, Distribution & Transportation, 2013�2020 (Million Tons)
Table 93 South Korea: By Market Size, By Function, 2013�2020 (Usd Million)
Table 94 South Korea: By Market Size, By Function, 2013�2020 (Million Tons)
Table 95 South Korea: By Market Size, By Production Technology, 2013�2020 (Usd Million)
Table 96 South Korea: By Market Size, By Production Technology, 2013�2020 (Million Tons)
Table 97 Rest Of Asia-Pacific: Size, By End-Use Industry, 2013�2020 (Usd Million)
Table 98 Rest Of Asia-Pacific: By Market Size, By End-Use Industry, 2013�2020 (Million Tons)
Table 99 Rest Of Asia-Pacific: By Market Size, By Storage, Distribution & Transportation, 2013�2020 (Usd Million)
Table 100 Rest Of Asia-Pacific: By Market Size, By Storage, Distribution & Transportation, 2013�2020 (Million Tons)
Table 101 Rest Of Asia-Pacific: By Market Size, By Function, 2013�2020 (Usd Million)
Table 102 Rest Of Asia-Pacific: By Market Size, By Function, 2013�2020 (Million Tons)
Table 103 Rest Of Asia-Pacific: By Market Size, By Production Technology, 2013�2020 (Usd Million)
Table 104 Rest Of Asia-Pacific: By Market Size, By Production Technology, 2013�2020 (Million Tons)
Table 105 Europe: Size, By Country, 2013�2020 (Usd Million)
Table 106 Europe: By Market Size, By Country, 2013�2020 (Million Tons)
Table 107 Europe: By Market Size, By End-Use Industry, 2013�2020 (Usd Million)
Table 108 Europe: By Market Size, By End-Use Industry, 2013�2020 (Million Tons)
Table 109 Europe: By Market Size, By Storage, Distribution & Transportation, 2013�2020 (Usd Million)
Table 110 Europe: By Market Size, By Storage, Distribution & Transportation, 2013�2020 (Million Tons)
Table 111 Europe: By Market Size, By Function, 2013�2020 (Usd Million)
Table 112 Europe: By Market Size, By Function, 2013�2020 (Million Tons)
Table 113 Europe: By Market Size, By Production Technology, 2013�2020 (Usd Million)
Table 114 Europe: By Market Size, By Production Technology, 2013�2020 (Million Tons)
Table 115 Germany: Size, By End-Use Industry, 2013�2020 (Usd Million)
Table 116 Germany: By Market Size, By End-Use Industry, 2013�2020 (Million Tons)
Table 117 Germany: By Market Size, By Storage, Distribution & Transportation, 2013�2020 (Usd Million)
Table 118 Germany: By Market Size, By Storage, Distribution & Transportation, 2013�2020 (Million Tons)
Table 119 Germany: By Market Size, By Function, 2013�2020 (Usd Million)
Table 120 Germany: By Market Size, By Function, 2013�2020 (Million Tons)
Table 121 Germany: By Market Size, By Production Technology, 2013�2020 (Usd Million)
Table 122 Germany: By Market Size, By Production Technology, 2013�2020 (Million Tons)
Table 123 France: Size, By End-Use Industry, 2013�2020 (Usd Million)
Table 124 France: By Market Size, By End-Use Industry, 2013�2020 (Million Tons)
Table 125 France: By Market Size, By Storage, Distribution & Transportation, 2013�2020 (Usd Million)
Table 126 France: By Market Size, By Storage, Distribution & Transportation, 2013�2020 (Million Tons)
Table 127 France: By Market Size, By Function, 2013�2020 (Usd Million)
Table 128 France: By Market Size, By Function, 2013�2020 (Million Tons)
Table 129 France: By Market Size, By Production Technology, 2013�2020 (Usd Million)
Table 130 France: By Market Size, By Production Technology, 2013�2020 (Million Tons)
Table 131 U.K.: Size, By End-Use Industry, 2013�2020 (Usd Million)
Table 132 U.K.: By Market Size, By End-Use Industry, 2013�2020 (Million Tons)
Table 133 U.K.: By Market Size, By Storage, Distribution & Transportation, 2013�2020 (Usd Million)
Table 134 U.K.: By Market Size, By Storage, Distribution & Transportation, 2013�2020 (Million Tons)
Table 135 U.K.: By Market Size, By Function, 2013�2020 (Usd Million)
Table 136 U.K.: By Market Size, By Function, 2013�2020 (Million Tons)
Table 137 U.K.: By Market Size, By Production Technology, 2013�2020 (Usd Million)
Table 138 U.K.: By Market Size, By Production Technology, 2013�2020 (Million Tons)
Table 139 Belgium: Size, By End-Use Industry, 2013�2020 (Usd Million)
Table 140 Belgium: By Market Size, By End-Use Industry, 2013�2020 (Million Tons)
Table 141 Belgium: By Market Size, By Storage, Distribution & Transportation, 2013�2020 (Usd Million)
Table 142 Belgium: By Market Size, By Storage, Distribution & Transportation, 2013�2020 (Million Tons)
Table 143 Belgium: By Market Size, By Function, 2013�2020 (Usd Million)
Table 144 Belgium: By Market Size, By Function, 2013�2020 (Million Tons)
Table 145 Belgium: By Market Size, By Production Technology, 2013�2020 (Usd Million)
Table 146 Belgium: By Market Size, By Production Technology, 2013�2020 (Million Tons)
Table 147 Rest Of Europe: Size, By End-Use Industry, 2013�2020 (Usd Million)
Table 148 Rest Of Europe: By Market Size, By End-Use Industry, 2013�2020 (Million Tons)
Table 149 Rest Of Europe: By Market Size, By Storage, Distribution & Transportation, 2013�2020 (Usd Million)
Table 150 Rest Of Europe: By Market Size, By Storage, Distribution & Transportation, 2013�2020 (Million Tons)
Table 151 Rest Of Europe: By Market Size, By Function, 2013�2020 (Usd Million)
Table 152 Rest Of Europe: By Market Size, By Function, 2013�2020 (Million Tons)
Table 153 Rest Of Europe: By Market Size, By Production Technology, 2013�2020 (Usd Million)
Table 154 Rest Of Europe: By Market Size, By Production Technology, 2013�2020 (Million Tons)
Table 155 Row: By Market Size, By Country, 2013�2020 (Usd Million)
Table 156 Row: By Market Size, By Country, 2013�2020 (Million Tons )
Table 157 Row: By Market Size, By End-Use Industry, 2013�2020 (Usd Million)
Table 158 Row: By Market Size, By End-Use Industry, 2013�2020 (Million Tons)
Table 159 Row: By Market Size, By Storage, Distribution & Transportation, 2013�2020 (Usd Million)
Table 160 Row: By Market Size, By Storage, Distribution & Transportation, 2013�2020 (Million Tons)
Table 161 Row: By Market Size, By Function, 2013�2020 (Usd Million)
Table 162 Row: By Market Size, By Function, 2013�2020 (Million Tons)
Table 163 Row: By Market Size, By Production Technology, 2013�2020 (Usd Million)
Table 164 Row: By Market Size, By Production Technology, 2013�2020 (Million Tons)
Table 165 Brazil: Size, By End-Use Industry, 2013�2020 (Usd Million)
Table 166 Brazil: Size, By End-Use Industry, 2013�2020 (Million Tons)
Table 167 Brazil: Size, By Storage, Distribution & Transportation, 2013�2020 (Usd Million)
Table 168 Brazil: Size, By Storage, Distribution & Transportation, 2013�2020 (Million Tons)
Table 169 Brazil: Size, By Function, 2013�2020 (Usd Million)
Table 170 Brazil: Size, By Function, 2013�2020 (Million Tons)
Table 171 Brazil: Size, By Production Technology, 2013�2020 (Usd Million)
Table 172 Brazil: Size, By Production Technology, 2013�2020 (Million Tons)
Table 173 Saudi Arabia: Size, By End-Use Industry, 2013�2020 (Usd Million)
Table 174 Saudi Arabia: Size, By End-Use Industry, 2013�2020 (Million Tons)
Table 175 Saudi Arabia: Size, By Storage, Distribution & Transportation, 2013�2020 (Usd Million)
Table 176 Saudi Arabia: Size, By Storage, Distribution & Transportation, 2013�2020 (Million Tons)
Table 177 Saudi Arabia: Size, By Function, 2013�2020 (Usd Million)
Table 178 Saudi Arabia: Size, By Function, 2013�2020 (Million Tons)
Table 179 Saudi Arabia: Size, By Production Technology, 2013�2020 (Usd Million)
Table 180 Saudi Arabia: Size, By Production Technology, 2013�2020 (Million Tons)
Table 181 South Africa: By Market Size, By End-Use Industry, 2013�2020 (Usd Million)
Table 182 South Africa: By Market Size, By End-Use Industry, 2013�2020 (Million Tons)
Table 183 South Africa: By Market Size, By Storage, Distribution & Transportation, 2013�2020 (Usd Million)
Table 184 South Africa: By Market Size, By Storage, Distribution & Transportation, 2013�2020 (Million Tons)
Table 185 South Africa: By Market Size, By Function, 2013�2020 (Usd Million)
Table 186 South Africa: By Market Size, By Function, 2013�2020 (Million Tons)
Table 187 South Africa: By Market Size, By Production Technology, 2013�2020 (Usd Million)
Table 188 South Africa: By Market Size, By Production Technology, 2013�2020 (Million Tons)
Table 189 Other Row Countries: By Market Size, By End-Use Industry, 2013�2020 (Usd Million)
Table 190 Other Row Countries: By Market Size, By End-Use Industry, 2013�2020 (Million Tons)
Table 191 Other Row Countries: By Market Size, By Storage, Distribution & Transportation, 2013�2020 (Usd Million)
Table 192 Other Row Countries: By Market Size, By Storage, Distribution & Transportation, 2013�2020 (Million Tons)
Table 193 Other Row Countries: By Market Size, By Function, 2013�2020 (Usd Million)
Table 194 Other Row Countries: By Market Size, By Function, 2013�2020 (Million Tons)
Table 195 Other Row Countries: By Market Size, By Production Technology, 2013�2020 (Usd Million)
Table 196 Other Row Countries: By Market Size, By Manufacturing Process, 2013�2020 (Million Tons)
Table 197 Partnerships, Agreements, And Joint Ventures, 2011�2015
Table 198 Expansions, 2011�2015
Table 199 Mergers & Acquisitions, 2011-2015
Table 200 New Product Launches, 2011�2015
List of Figures (54 Figures)
Figure 1 Research Design
Figure 2 Breakdown of Primary Interviews
Figure 3 Population Growth has Increased Tremendously in the Last Three Decades
Figure 4 Increase in Total Expenditure of Middle-Class Families
Figure 5 Crude Oil Spot Prices, 2004�2014
Figure 6 Natural Gas Prices, 2004-2014
Figure 7 Market Size Estimation Methodology: Bottom-Up Approach
Figure 8 Market Size Estimation Methodology: Top-Down Approach
Figure 9 Data Triangulation Methodology
Figure 10 Size, By End-Use Industry, 2015 vs 2020 (USD Million)
Figure 11 Market Size, By Region, 2015 vs 2020 (USD Million)
Figure 12 India is Projected to Be the Fastest-Growing Market for Liquid Nitrogen From 2015 to 2020
Figure 13 Cylinder & Packaged Gas is Projected to Dominate the Market By 2020
Figure 14 Key Market Players Adopted Mergers & Acquisitions as Key Strategies From 2011 to 2015
Figure 15 Emerging Economies Offer Attractive Opportunities
Figure 16 Chemicals & Pharmaceuticals Captured the Largest Share in the Emerging Asia-Pacific Market in 2014
Figure 17 Country-Wise Growth Potential of Liquid Nitrogen, 2015�2020
Figure 18 Region-Wise Snapshot, 2014
Figure 19 Emerging Markets to Grow Faster Than Developed Markets, 2015�2020
Figure 20 End-Use Industries Snapshot, 2014
Figure 21 Evolution
Figure 22 Segmentation
Figure 23 Drivers, Restraints, Opportunities, and Challenges
Figure 24 Silicon Wafer Industry Trends
Figure 25 Global Healthcare Sector Outlook for 2009 to 2013
Figure 26 Chemicals Market, CAGR (2013-2020)
Figure 27 Liquid Nitrogen Value Chain
Figure 28 Porter�s Five Forces Analysis
Figure 29 Chemicals & Pharmaceuticals Dominated in 2015
Figure 30 Cylinder & Packaged Gas Segment Dominated in 2015
Figure 31 By Function, 2015 vs 2020 (USD Million)
Figure 32 Cryogenic Distillation Segment Dominated in 2015
Figure 33 Geographical Snapshot: Asia-Pacific is Expected to Grow at the Highest CAGR During the Forecast Period
Figure 34 India Poised to Grow at the Highest CAGR By 2020
Figure 35 North America: Market Snapshot
Figure 36 Asia-Pacific: Market Snapshot
Figure 37 Europe: Market Snapshot
Figure 38 RoW: Market Snapshot
Figure 39 Companies Adopted Expansions as Their Key Growth Strategy Over the Last Five Years
Figure 40 Developments, By Key Players, 2014
Figure 41 Partnerships, Agreements, and Joint Ventures Fueled Growth of the Liquid Nitrogen Market (2011�2015)
Figure 42 Key Growth Strategies, 2011�2015
Figure 43 Geographic Revenue Mix of Top Five Players
Figure 44 The Linde Group: Company Snapshot
Figure 45 SWOT Analysis: the Linde Group
Figure 46 Praxair Inc.: Company Snapshot
Figure 47 SWOT Analysis: Praxair Inc.
Figure 48 Air Liquide S.A.: Company Snapshot
Figure 49 Air Liquide S.A.: SWOT Analysis
Figure 50 Air Products and Chemicals, Inc.: Company Snapshot
Figure 51 Air Products and Chemicals, Inc.: SWOT Analysis
Figure 52 Southern Industrial Gas Berhad: Company Snapshot
Figure 53 Messer Group: Company Snapshot
Figure 54 Taiyo Nippon Sanso Corporation: Company Snapshot


Growth opportunities and latent adjacency in Liquid Nitrogen Market