Lipid Nutrition Market (Nutritional Lipids) by Type (Omega-3, Omega-6, MCTs), Source, Form, Application (Dietary Supplements & Nutraceuticals, Infant Formula, Pharmaceuticals, Food Fortification, Animal Nutrition), and Region - Global Forecast to 2022


[149 Pages Report] The global lipid nutrition market was valued at USD 6.51 Billion in 2016, and is projected to reach USD 11.15 Billion by 2022, at a CAGR of 9.4% during the forecast period.
The years considered for the study are as follows:
- Base year: 2016
- Estimated year: 2017
- Projected year: 2022
- Forecast period: 2017–2022
Objectives of the study are as follows:
- To define, segment, and project the global market size for lipid nutrition on the basis of type, source, form, application, and region
- To provide detailed information about the key factors influencing the growth of the market (drivers, restraints, opportunities, and industry-specific challenges)
- To project the size of submarkets, in terms of value, with respect to four regions (along with their respective key countries): North America, Europe, Asia-Pacific, and the Rest of the World (RoW)
- To analyze the opportunities in the market for stakeholders and provide the competitive landscape of market leaders
- To profile key players and comprehensively analyze their core competencies
- To analyze competitive developments such as agreements, mergers & acquisitions, new product developments, and expansions in the lipid nutrition market
Research Methodology
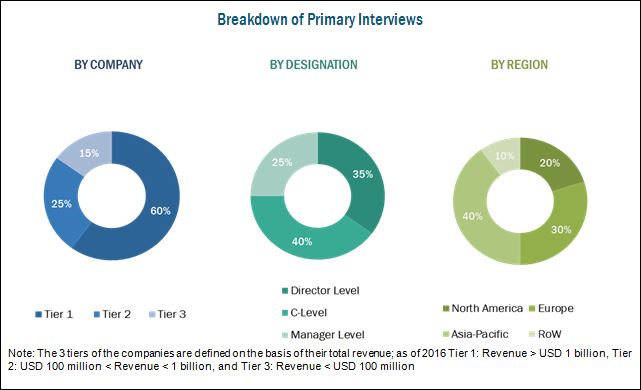
This report includes estimations of market size in terms of value (USD million). Both, top-down and bottom-up approaches have been used to estimate and validate the size of the lipid nutrition market and of various other dependent submarkets in the overall market. Key players in the market have been identified through secondary research, and their market share in respective regions has been determined through primary and secondary research. All percentage shares, splits, and breakdowns have been determined using secondary sources The Food and Agriculture Organization (FAO), the Global Organization for EPA and DHA Omega-3s (GOED), Food and Drug Administration (FDA), and European Market Observatory for Fisheries and Aquaculture Products (EUMOFA) to identify and collect information useful for this technical, market-oriented, and commercial study of the lipid nutrition market.
To know about the assumptions considered for the study, download the pdf brochure
Market Ecosystem
The various contributors involved in the value chain of lipid nutrition include raw material suppliers, manufacturers, wholesalers/distributors, retailers, and end users. Major manufacturing companies develop their in-house R&D centers for research and innovation activities to support their manufacturing units and to successfully introduce products with enhanced functionality in the market.
The market is dominated by key players such as Koninklijke DSM N.V. (Netherlands), BASF SE (Germany), Nordic’s Naturals, Inc. (U.S.), Croda International Plc (U.K.), Cargill (U.S.), Archer Daniels Midland Company (U.S.), Kerry Group plc (Ireland), FMC Corporation (U.S.), Neptune Wellness Solutions (Canada), Aker BioMarine AS (Norway), Omega Protein Corporation (U.S.), FrieslandCampina (Netherlands), and Polaris Nutritional Lipids (France).
Target Audience:
- Lipid nutrition manufacturers
- Lipid nutrition importers and exporters
- Fish oil, algal oil, vegetable oil, and krill oil extractors and suppliers
- Traders, distributors, and suppliers
- Functional food, nutraceutical, and dietary supplement manufacturers
- Personal care and pharmaceutical product manufacturers
- Regulatory bodies and organizations such as the Food and Drug Administration (FDA)
Scope of the report
The lipid nutrition market has been segmented as follows:
Based on Type, the market has been segmented as follows:
- Omega-3
- Omega-6
- Medium Chain Triglycerides (MCTs)
- Others (sphingolipids, Omega-7, and Omega-9)
Based on Source, the market has been segmented as follows:
- Plant
- Animal
Based on Form, the market has been segmented as follows:
- Powder
- Liquid
Based on Application, the market has been segmented as follows:
- Dietary supplements & nutraceuticals
- Infant formula
- Pharmaceutical
- Food fortification
- Animal nutrition
- Others (personal care, flavors, and industrial)
Based on Region, the market has been segmented as follows:
- North America
- Europe
- Asia-Pacific
- RoW (Brazil and South Africa)
Available Customizations
With the given market data, MarketsandMarkets offers customizations according to client-specific needs.
The following customization options are available for the report:
Product Analysis
- Product matrix, which gives a detailed comparison of the product portfolio of each company
Regional Analysis
- Further breakdown of the Rest of Europe lipid nutrition market into Sweden, Norway, Belgium, and Denmark
- Further breakdown of the Rest of Asia-Pacific lipid nutrition market into Thailand, South Korea, and Malaysia
- Further breakdown of other countries in the RoW lipid nutrition market into Brazil and South Africa
Company Information
- Detailed analysis and profiling of additional market players (up to two)
The lipid nutrition market is projected to grow at a CAGR of 9.4%, in terms of value, from 2017 to reach a projected value of USD 11.15 Billion by 2022. The demand for lipid nutrition is projected to be on the rise, owing to factors such as increase in instances of diseases such as cardiovascular diseases (CVDs) and obesity in regions such as North America, the consumer awareness about the health benefits of lipid nutrition, and the growing demand for lipid nutrition in fortified foods, pharmaceuticals, infant formula, animal nutrition, and dietary supplements.
The lipid nutrition (nutritional lipids) market has been segmented, by type, into Omega-3, Omega-6, medium-chain triglycerides (MCTs), and others which include sphingolipids, Omega-7 and Omega-9. The growth of the Omega-3 market is attributed due to various health benefits imparted by Omega-3 products. The increased consumer awareness about the health benefits of Omega-3 ingredients and advancement in technologies such as microencapsulation to serve pharmaceuticals and other industries have led to the increase in the purchase of capsules, oils, and functional foods containing Omega-3 acids.
The lipid nutrition market (nutritional lipids) has been segmented on the basis of application into dietary supplements & nutraceutical, pharmaceuticals, infant formula, food fortification, animal nutrition, and others which include personal care, flavors, and industrial. The dietary supplements & nutraceuticals segment has been gaining popularity due to the growing health concerns among consumers and a trend of gymnasiums, health clubs, and yoga centers among the young population.
On the basis of source, the market is categorized into plant and animal. The plant segment is projected to grow at a higher rate; it includes algae, nuts & legumes, vegetable oils, olives, and seeds. Animal sources dominate in the production of lipid nutrition such as Omega-3. Crude fish oil is one of the major and traditional sources of lipid nutrition (DHA & EPA). Krill oil is projected to be the fastest-growing segment during the forecast period since DHA/EPA absorption in the human system is more effective as compared to fish oils.
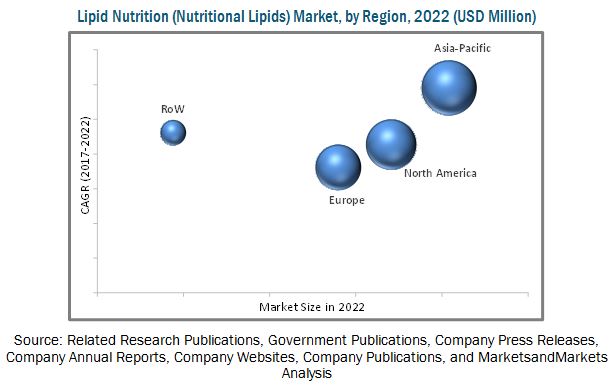
Asia-Pacific is estimated to occupy the largest share in the global market, in terms of value, in 2017. China was the largest market for lipid nutrition in the Asia-Pacific region in 2016. The growing infant and women nutrition markets in countries such as India, China, Japan, and South Korea along with diet diversification, and the liberalization of foreign direct investments in the food sector, are the main factors contributing to the dominance and fast growth of Asia-Pacific in the global lipid nutrition market. The increase in demand for fortified food, innovative technologies, and new application profiling are some other factors attributing in its growth.
The sustainability issues of fisheries which lead to low production of fish oil, coupled with certain medical conditions which are not suitable for consumption of lipid nutrition, are the major factors restraining the growth of the lipid nutrition market globally. The volatility of the market is largely due to the high dependency of lipid nutrition production on raw material prices such as fish oil and algae.
The leading players who dominated the lipid nutrition market include Koninklijke DSM N.V. (Netherlands), BASF SE (Germany), Nordic’s Naturals, Inc. (U.S.), Croda International Plc (U.K.), Cargill (U.S.), Archer Daniels Midland Company (U.S.), Kerry Group plc (Ireland), FMC Corporation (U.S.), Neptune Wellness Solutions (Canada), Aker BioMarine AS (Norway), Omega Protein Corporation (U.S.), FrieslandCampina (Netherlands), and Polaris Nutritional Lipids (France).
To speak to our analyst for a discussion on the above findings, click Speak to Analyst
 Exclusive indicates content/data unique to MarketsandMarkets and not available with any competitors.
Table of Contents
1 Introduction (Page No. - 13)
1.1 Objectives of the Study
1.2 Market Definition
1.3 Market Scope
1.4 Periodization Considered for the Study
1.5 Currency Considered for the Study
1.6 Stakeholders
2 Research Methodology (Page No. - 16)
2.1 Research Data
2.1.1 Secondary Data
2.1.1.1 Key Data From Secondary Sources
2.1.2 Primary Data
2.1.2.1 Key Data From Primary Sources
2.1.2.2 Key Industry Insights
2.1.2.3 Breakdown of Primaries
2.2 Market Size Estimation
2.3 Market Breakdown & Data Triangulation
2.4 Research Assumptions and Limitations
2.4.1 Assumptions
2.4.2 Limitations
3 Executive Summary (Page No. - 25)
4 Premium Insights (Page No. - 31)
4.1 Attractive Opportunities in the Lipid Nutrition (Nutritional Lipids) Market
4.2 Lipid Nutrition (Nutritional Lipids) Market, By Key Country
4.3 Asia-Pacific Lipid Nutrition (Nutritional Lipids) Market, By Country & Type
4.4 Lipid Nutrition Market, By Application
4.5 Market, By Source & Subsource
4.6 Life Cycle Analysis
5 Market Overview (Page No. - 36)
5.1 Introduction
5.2 Market Dynamics
5.2.1 Drivers
5.2.1.1 Consumer Awareness About the Health Benefits of Nutritional Lipids and Increasing Focus on Preventive Healthcare
5.2.1.2 Natural and Safe Nature of Ingredients
5.2.1.3 Increasing Cases of Chronic Diseases
5.2.2 Restraints
5.2.2.1 Sustainability Issues of Fisheries Lead to Low Production of Fish Oil
5.2.2.2 Competition of Raw Material Suppliers and Lower Catch Quotas Increase Fish Oil Prices
5.2.2.3 Not Suitable for Patients With Certain Medical Conditions
5.2.3 Opportunities
5.2.3.1 Growing Demand in Emerging Economies
5.2.3.2 Increasing Number of Applications
5.2.4 Challenges
5.2.4.1 Increasing Raw Material and Technology Cost
5.3 Value Chain Analysis
6 Lipid Nutrition (Nutritional Lipids) Market, By Type (Page No. - 42)
6.1 Introduction
6.2 Omega-3
6.3 Omega-6
6.4 Medium-Chain Triglycerides (MCTS)
6.5 Others
7 Lipid Nutrition (Nutritional Lipids) Market, By Application (Page No. - 49)
7.1 Introduction
7.2 Dietary Supplements & Nutraceutical
7.3 Pharmaceutical
7.4 Infant Formula
7.5 Animal Nutrition
7.6 Food Fortification
7.7 Others
8 Lipid Nutrition (Nutritional Lipids) Market, By Source (Page No. - 57)
8.1 Introduction
8.2 Animal Source
8.3 Plant Source
9 Lipid Nutrition (Nutritional Lipids) Market, By Form (Page No. - 63)
9.1 Introduction
9.2 Powder
9.3 Liquid
10 Lipid Nutrition (Nutritional Lipids) Market, By Region (Page No. - 67)
10.1 Introduction
10.2 North America
10.2.1 U.S.
10.2.2 Canada
10.2.3 Mexico
10.3 Europe
10.3.1 U.K.
10.3.2 Germany
10.3.3 France
10.3.4 Italy
10.3.5 Rest of Europe
10.4 Asia-Pacific
10.4.1 China
10.4.2 India
10.4.3 Japan
10.4.4 Australia & New Zealand
10.4.5 Rest of Asia-Pacific
10.5 Rest of the World (RoW)
10.5.1 Brazil
10.5.2 South Africa
10.5.3 Others in RoW
11 Competitive Landscape (Page No. - 99)
11.1 Introduction
11.2 Competitive Leadership Mapping
11.2.1 Visionary Leaders
11.2.2 Innovators
11.2.3 Dynamic Differentiators
11.2.4 Emerging Companies
11.3 Competitive Benchmarking
11.3.1 Strength of Product Portfolio (For 25 Players)
11.3.2 Business Strategy Excellence (For 25 Players)
*Top 25 Companies Analyzed for This Study are – Koninklijke DSM N.V. (Netherlands), Polaris Nutritional Lipids (France), Kerry Group PLC (Ireland), Croda International PLC (U.K.), Stepan Company (U.S.), Omega Protein Corporation (U.S.), BASF SE (Germany), FMC Corporation (U.S.), Gc Rieber (Norway), Tecnológica De Alimentos Sa (Tasa) (Peru), Reckitt Benckiser Group PLC (U.K.), Luhua Biomarine (Shandong) Co., Ltd. (China), Nordic Naturals, Inc. (U.S.), Pharma Marine as (Norway), Frieslandcampina (Netherlands), Solutex, Inc. (U.S.), Qualitas Health (U.S.), Cargill (U.S.), Archer Daniels Midland Company (U.S.), Lipoid GmbH (Germany), Neptune Wellness Solutions (Canada), Aker Biomarine as (Norway), Nature's Way Products, LLC. (U.S.), Corefx Ingredients (U.S.), Copeinca (Norway)
11.4 Company Rankings
12 Company Profiles (Page No. - 104)
(Business Overview, Strength of Product Portfolio, Products Offered, Business Strategy Excellence & Recent Developments)*
12.1 Koninklijke DSM N.V.
12.2 Omega Protein Corporation
12.3 Croda International PLC
12.4 Nordic Naturals, Inc.
12.5 Archer Daniels Midland Company
12.6 Neptune Wellness Solutions
12.7 FMC Corporation
12.8 Polaris Nutritional Lipids
12.9 Pharma Marine as
12.10 BASF SE
12.11 Kerry Group PLC
12.12 Frieslandcampina
*Details on Business Overview, Strength of Product Portfolio, Products Offered, Business Strategy Excellence & Recent Developments, Might Not Be Captured in Case of Unlisted Companies.
13 Appendix (Page No. - 141)
13.1 Discussion Guide
13.2 Knowledge Store: Marketsandmarkets’ Subscription Portal
13.3 Introducing RT: Real-Time Market Intelligence
13.4 Available Customizations
13.5 Related Reports
13.6 Author Details
List of Tables (65 Tables)
Table 1 Nutritional Lipids Market Size, By Type, 2015–2022 (USD Million)
Table 2 Omega-3 Market Size, By Region, 2015–2022 (USD Million)
Table 3 Omega-6 Market Size, By Region, 2015–2022 (USD Million)
Table 4 Medium-Chain Triglycerides (MCTS) Market Size, By Region, 2015–2022 (USD Million)
Table 5 Others Market Size, By Region, 2015–2022 (USD Million)
Table 6 Nutritional Lipids Market Size, By Application, 2015–2022 (USD Million)
Table 7 Dietary Supplements & Nutraceutical Market Size, By Region, 2015–2022 (USD Million)
Table 8 Pharmaceutical Market Size, By Region, 2015–2022 (USD Million)
Table 9 Infant Formula Market Size, By Region, 2015–2022 (USD Million)
Table 10 Animal Nutrition Market Size, By Region, 2015–2022 (USD Million)
Table 11 Food Fortification Market Size, By Region, 2015–2022 (USD Million)
Table 12 Others Market Size, By Region, 2015–2022 (USD Million)
Table 13 Nutritional Lipids Market Size, By Source, 2015–2022 (USD Million)
Table 14 Animal-Sourced Nutritional Lipids Market Size, By Region, 2015–2022 (USD Million)
Table 15 Animal-Sourced Nutritional Lipids Market Size, By Subsource, 2015–2022 (USD Million)
Table 16 Plant-Sourced Nutritional Lipids Market Size, By Region, 2015–2022 (USD Million)
Table 17 Plant-Sourced Nutritional Lipids Market Size, By Subsource, 2015–2022 (USD Million)
Table 18 Lipid Nutrition Market Size, By Form, 2015–2022 (USD Million)
Table 19 Powder Nutritional Lipids Market Size, By Region, 2015–2022 (USD Million)
Table 20 Liquid Nutritional Lipids Market Size, By Region, 2015–2022 (USD Million)
Table 21 Lipid Nutrition Market Size, By Region, 2015–2022 (USD Million)
Table 22 North America: Lipid Nutrition Market Size, By Type, 2015–2022 (USD Million)
Table 23 North America: Lipid Nutrition Market Size, By Source, 2015–2022 (USD Million)
Table 24 North America: Plant-Based Nutritional Lipids Market Size, By Sub-Source, 2015–2022 (USD Million)
Table 25 North America: Animal-Based Nutritional Lipids Market Size, By Sub-Source, 2015–2022 (USD Million)
Table 26 North America: Nutritional Lipids Market Size, By Form, 2015–2022 (USD Million)
Table 27 North America: Nutritional Lipids Market Size, By Application, 2015–2022 (USD Million)
Table 28 North America: Lipid Nutrition Market Size, By Country, 2015–2022 (USD Million)
Table 29 U.S.: Nutritional Lipids Market, By Type, 2015–2022 (USD Million)
Table 30 Canada: Nutritional Lipids Market Size, By Type, 2015–2022 (USD Million)
Table 31 Mexico: Lipid Nutrition Market Size, By Type, 2015–2022 (USD Million)
Table 32 Europe: Market Size, By Type, 2015–2022 (USD Million)
Table 33 Europe: Market Size, By Source, 2015–2022 (USD Million)
Table 34 Europe: Plant-Based Nutritional Lipids Market Size, By Subsource, 2015–2022 (USD Million)
Table 35 Europe: Animal-Based Nutritional Lipids Market Size, By Subsource, 2015–2022 (USD Million)
Table 36 Europe: Nutritional Lipids Market Size, By Form, 2015–2022 (USD Million)
Table 37 Europe: Market Size, By Application, 2015–2022 (USD Million)
Table 38 Europe: Market Size, By Country, 2015–2022 (USD Million)
Table 39 U.K.: Nutritional Lipids Market Size, By Type, 2015–2022 (USD Million)
Table 40 Germany: Market Size, By Type, 2015–2022 (USD Million)
Table 41 France: Market Size, By Type, 2015–2022 (USD Million)
Table 42 Italy: Market Size, By Type, 2015–2022 (USD Million)
Table 43 Rest of Europe: Nutritional Lipids Market Size, By Type, 2015–2022 (USD Million)
Table 44 Asia-Pacific: Nutritional Lipids Market Size, By Type, 2015–2022 (USD Million)
Table 45 Asia-Pacific: Lipid Nutrition Market Size, By Application, 2015–2022 (USD Million)
Table 46 Asia-Pacific: Nutritional Lipids Market Size, By Source, 2015–2022 (USD Million)
Table 47 Asia-Pacific: Plant-Based Nutritional Lipids Market Size, By Sub-Source, 2015–2022 (USD Million)
Table 48 Asia-Pacific: Animal-Based Nutritional Lipids Market Size, By Sub-Source, 2015–2022 (USD Million)
Table 49 Asia-Pacific: Nutritional Lipids Market Size, By Form, 2015–2022 (USD Million)
Table 50 Asia-Pacific: Nutritional Lipids Market Size, By Country, 2015–2022 (USD Million)
Table 51 China: Lipid Nutrition Market Size, By Type, 2015–2022 (USD Million)
Table 52 India: Lipid Nutrition Market Size, By Type, 2015–2022 (USD Million)
Table 53 Japan: Lipid Nutrition Market Size, By Type, 2015–2022 (USD Million)
Table 54 Australia & New Zealand: Nutritional Lipids Market Size, By Type, 2015–2022 (USD Million)
Table 55 Rest of Asia-Pacific: Lipid Nutrition Market Size, By Type, 2015–2022 (USD Million)
Table 56 RoW: Nutritional Lipids Market Size, By Type, 2015–2022 (USD Million)
Table 57 RoW: Lipid Nutrition Market Size, By Source, 2015–2022 (USD Million)
Table 58 RoW: Plant-Based Nutritional Lipids Market Size, By Subsource, 2015–2022 (USD Million)
Table 59 RoW: Animal-Based Nutritional Lipids Market Size, By Subsource, 2015–2022 (USD Million)
Table 60 RoW: Market Size, By Form, 2015–2022 (USD Million)
Table 61 RoW: Nutritional Lipids Market Size, By Application, 2015–2022 (USD Million)
Table 62 RoW: Lipid Nutrition Market Size, By Country, 2015–2022 (USD Million)
Table 63 Brazil: Nutritional Lipids Market Size, By Type, 2015–2022 (USD Million)
Table 64 South Africa: Lipid Nutrition Market Size, By Type, 2015–2022 (USD Million)
Table 65 Others in RoW: Nutritional Lipids Market Size, By Type, 2015–2022 (USD Million)
List of Figures (40 Figures)
Figure 1 Nutritional Lipids: Market Segmentation
Figure 2 Nutritional Lipids Market: Research Design
Figure 3 Breakdown of Primary Interviews: By Company, Designation, and Region
Figure 4 Market Size Estimation: Bottom-Up Approach
Figure 5 Market Size Estimation Methodology: Top-Down Approach
Figure 6 Market Breakdown & Data Triangulation
Figure 7 Nutritional Lipids Market Snapshot, By Type, 2017 vs 2022 (USD Million)
Figure 8 Lipid Nutrition Market Snapshot, By Source, 2017 vs 2022 (USD Million)
Figure 9 Nutritional Lipids Market Snapshot, By Application, 2017 vs 2022 (USD Million)
Figure 10 Lipid Nutrition Market Snapshot, By Form, 2017 vs 2022 (USD Million)
Figure 11 Nutritional Lipids Market Snapshot, By Region, 2017 vs 2022 (USD Million)
Figure 12 Asia-Pacific is Projected to Register the Highest Growth Rate From 2017 to 2022
Figure 13 Nutritional Lipids: an Emerging Market With Promising Growth Potential
Figure 14 India Projected to Grow at the Highest Rate in the Lipid Nutrition Market From 2017 to 2022
Figure 15 China Accounted for the Largest Share in the Asia-Pacific Lipid Nutrition Market in 2016
Figure 16 Dietary Supplements & Nutraceutical Segment Projected to Be the Largest By 2022
Figure 17 Lipid Nutrition Market, By Source & Subsource, 2017
Figure 18 Life Cycle Analysis: Lipid Nutrition Market
Figure 19 Market Dynamics: Lipid Nutrition Market
Figure 20 Value Chain: Lipid Nutrition Market
Figure 21 Nutritional Lipids Market Size, By Type, 2017 Vs.2022 (USD Million)
Figure 22 Nutritional Lipids Market Size, By Application, 2017 vs 2022 (USD Million)
Figure 23 Nutritional Lipids Market Size, By Source, 2017 vs 2022 (USD Million)
Figure 24 Animal-Sourced Nutritional Lipids Market Size, By Region, 2017 vs 2022 (USD Million)
Figure 25 Plant-Sourced Nutritional Lipids Market Size, By Region, 2017 vs 2022 (USD Million)
Figure 26 Nutritional Lipids Market Size, By Form, 2017 Vs.2022 (USD Million)
Figure 27 Geographic Snapshot (2017–2022) – China and India are Emerging as New Hot Spots
Figure 28 North America Lipid Nutrition Market Snapshot
Figure 29 Europe Lipid Nutrition Market Snapshot
Figure 30 Asia-Pacific Lipid Nutrition Market Snapshot
Figure 31 Nutritional Lipids Market: Competitive Leadership Mapping, 2017
Figure 32 Koninklijke DSM N.V.: Company Snapshot
Figure 33 Omega Protein Corporation: Company Snapshot
Figure 34 Croda International PLC: Company Snapshot
Figure 35 Archer Daniels Midland Company: Company Snapshot
Figure 36 Neptune Wellness Solutions: Company Snapshot
Figure 37 FMC Corporation: Company Snapshot
Figure 38 BASF SE: Company Snapshot
Figure 39 Kerry Group PLC: Company Snapshot
Figure 40 Frieslandcampina: Company Snapshot


Growth opportunities and latent adjacency in Lipid Nutrition Market