Isoprene Market by Type (Polymer grade, Chemical grade), Application (Polyisoprene, Styrene isoprene styrene, Isobutyl isoprene rubber), End-Use Industry (Tires, Non-tires, Adhesives), and Region - Global Forecast to 2021


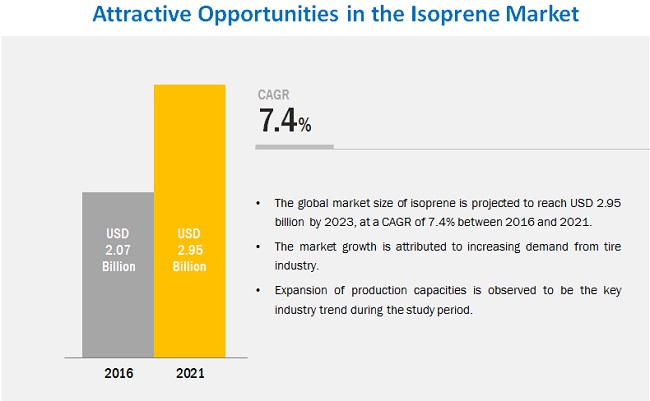
[155 Pages Report] The Isoprene Market was valued at USD 1.93 billion in 2015 and is projected to reach USD 2.96 billion by 2021, at a CAGR of 7.4%, from 2016 to 2021. About 70% of isoprene is used to manufacture synthetic rubber called polyisoprene. Polyisoprene has the same basic formula as natural rubber, and thus it is a synthetic version of natural rubber, having the same properties as natural rubber. Also, isoprene is largely used in manufacturing SIS, IIR, and other derivatives. The tire industry is experiencing high growth because of the growing automotive industry. The isoprene market is increasing due to its increasing applications in tires, conveyor belts, hoses, molded rubber, and also in medical equipment such as gloves and balloons. The demand for isoprene in the automotive industry for manufacturing of polyisoprene is expected to be driven by the growing automotive sales in China and India. The growing demand for fuel efficiency and eco-friendly tires is driving the growth of the tire industry and in turn the growth of the isoprene market
Market Dynamics
Drivers
- Growth in the synthetic rubber industry to increase the production of isoprene
- Demand for polyisoprene rubber in the medical sector
Restraints
- Regulations in the rubber manufacturing industry
Opportunities
- Developing countries in Asia- Pacific offer substantial growth opportunities
- Growing demand for improved performance and low rolling resistant tires providing growth opportunities for isoprene
Challenges
- Regional demand-supply gaps
- Crude oil price fluctuations
Growth in the synthetic rubber industry to increase the production of isoprene
The growth of the isoprene industry is directly related to the growth of the synthetic rubber industry. Isoprene manufacturers are impacted by the trends in the tire industry and other related synthetic rubber products. The growth in the tire industry is, in turn, dependent on the automotive industry that is growing and projected to witness a global sales rise of 60% by 2020. The global rubber production has been increasing since 2000. The world�s rubber production in 2010 was 23,680 kilotons, which increased to 26,774 kilotons in 2015. This growth in rubber production is projected to continue in the coming years, which will increase the demand for isoprene. The leading isoprene manufactures are expanding their production capacities. For example, Nizhnekamskneftekhim, a top manufacturer in Russia, started a new production unit for isoprene feedstock that will allow the company to produce additional 15,000 tons of isoprene.
The objectives of the report are as follows:
- To define, describe, and forecast the global isoprene market on the basis of type, application, end-use industry, and region
- To identify the driving and restraining factors and analyze the opportunities and challenges in the global isoprene market
- To forecast the market size, in terms of number of units and value, of isoprene
- To analyze and forecast the market size, in terms of number of units and value, for isoprene with respect to key end-use industries�tires, non-tires, adhesives, and others
- To analyze the detailed market segmentation and forecast the market size, in terms of number of units and value, for North America, Europe, Asia-Pacific, Middle East & Africa, and South America
- To analyze competitive developments such as expansions, new product launches, supply contracts, and mergers & acquisitions in the isoprene market
To profile leading players and identify their core competencies
Both, top-down and bottom-up approaches have been used to estimate and validate the size of the isoprene market and to estimate the sizes of various other dependent submarkets in the overall isoprene market. The research study involved the extensive use of secondary sources, directories, and databases such as Hoovers, Bloomberg, Chemical Weekly, Factiva, and other government and private websites to identify and collect information useful for the technical, market-oriented, and commercial study of the isoprene market.
To know about the assumptions considered for the study, download the pdf brochure
The value chain of the isoprene market starts with the sourcing of raw materials, followed by manufacturing & assembling of isoprene and supplying of finished isoprene products. It ends with the use of isoprene in the various end-use industries. C5 and naphtha are the raw materials used for the production of isoprene. Some of the major players in the isoprene market include Nizhnekamskneftekhim (Russia), SIBUR (Russia), The Goodyear Tire & Rubber Company (U.S.), Royal Dutch Shell Plc (Netherlands), Kuraray Co. Ltd. (Japan), ZEON Corporation (Japan), and LyondellBasell Industries N.V. (U.S.).
Key Target Audience:
- Isoprene manufacturers, Dealers, and Suppliers
- Isoprene Manufacturing Plant Developers and Related Service Providers
- Tire Manufacturing Companies
- Large Manufacturing Plant Owners
- Investment Banks
The scope of the report:
This research report categorizes the isoprene market on the basis of type, application, end-use industry, and region.
On the basis of type:
- Polymer Grade
- Chemical Grade
On the basis of application:
- Polyisoprene (IR)
- Styrene-isoprene-styrene (SIS)
- Isobutylene-isoprene rubber (IIR)
- Others
On the basis of the end-use industry
- Tires
- Non-tires
- Adhesives
- Others
On the basis of region
- Europe
- Asia-Pacific
- North America
- South America
- Middle East & Africa
The market has been further analyzed for the key countries in each of these regions.
Available Customizations:
Along with the market data, MarketsandMarkets offers customizations as per the specific needs of the companies. The following customization options are available for the report:
Country Information:
- Isoprene market analysis for additional countries
Company Information:
- Detailed analysis and profiling of other market players (up to 5)
Pricing Analysis:
- Detailed pricing analysis for each type of isoprene products
The overall isoprene market was valued at USD 1.93 billion in 2015 and is projected to reach USD 2.96 billion by 2021, at a CAGR of 7.4% from 2016 to 2021. Isoprene is used in several end-use industries, such as tires, non-tires, adhesives, and other industries. The increasing usage of synthetic rubber in these industries is expected to drive the isoprene market.
Isoprene is the common name for the chemical compound 2-methyl-1, 3-butadiene. It is an important C5 diolefin Isoprene and is produced by thermal cracking of naphtha oil, as a by-product in the production of ethylene. Isoprene, as a monomer, is used for the production of a synthetic rubber called polyisoprene. The majority of industrially produced isoprene is polymerized to polyisoprene, which is a synthetic version of natural rubber.
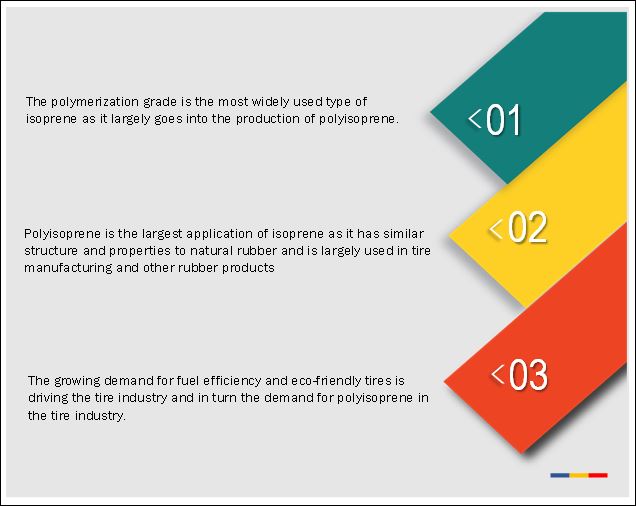
Based on the type, the isoprene market is segmented into polymer grade and chemical grade. Polymer grade is the most widely used isoprene type. This type of isoprene is used in different applications due to its properties similar to natural rubber. Also, it has more consistency than natural rubber in strength, cure rate, processing, mixing, and molding.
Rising use of polyisoprene application in the tire industry has led to an increase in demand for isoprene, globally. Increasing focus on low-rolling resistance tires to improve the fuel efficiency is further expected to fuel the isoprene market during the forecast period.
The isoprene application in polyisoprene is expected to drive the isoprene market
Polyisoprene
Polyisoprene is a synthetic rubber and has similar structure and properties to natural rubber. The isoprene market in polyisoprene is expected to increase due to polyisoprene�s consistency in terms of strength, cure rate, processing, mixing, and molding as compared to natural rubber. Polyisoprene is largely used in tire manufacturing and other rubber products. It has a lower level of non-polymer constituents than natural rubber. Other than tires, polyisoprene is being used in rubber bands, footwear, cut thread, baby bottle nipples, hoses, and conveyor belts. Polyisoprene is being widely used in medical device manufacturing; it is used in the manufacturing of surgical gloves, probe covers, and catheters among others.
SIS (Styrene Isoprene Styrene)
SIS copolymers are produced by styrene and isoprene linked homo-polymer blocks and belong to the class of thermoplastic elastomers. SIS is specially used in pressure-sensitive adhesives and hot-melt adhesives. It is also used in the production of bags, double-sided tapes, asphalt, polymer modifiers, elastic films, tapes, and other applications.
IIR (Isobutylene-Isoprene Rubber)
Isoprene is used in a small amount with isobutylene in the manufacturing of isobutylene-isoprene rubber, commonly known as butyl rubber. The main application of butyl rubber is inner linings of tires; recently it is being used in linings of tubeless tires. Due to its property of high heat resistance, it is used in applications such as steam hoses and curing bags used in tire vulcanization.
Critical questions the report answers:
- How will the crude oil price fluctuations affect the isoprene market?
- What are the upcoming industry trends of isoprene?
Tire & rubber manufacturing facilities emit hazardous air pollutants (HAP). The stringent regulations by regulatory bodies to reduce HAPs are expected to restrict the synthetic rubber production and hence will restrict the isoprene market in the coming years.
Companies such as Nizhnekamskneftekhim (Russia), SIBUR (Russia), The Goodyear Tire & Rubber Company (U.S.), Royal Dutch Shell Plc (Netherlands), Kuraray Co. Ltd. (Japan), ZEON Corporation (Japan), LyondellBasell Industries N.V.(U.S.), JSR Corporation (Japan), Ningbo Jinhai Chenguang (China), Shandong Yuhuang Chemical Group Co. Ltd. (China), Finetech Industry Ltd. (U.K.), Haihang Industry Co. Ltd. (China), Fortrec Chemicals and Petroleum Pte Ltd.(Singapore), and Braskem (Brazil) are operating in this market. These companies adopted strategies such as expansions, mergers & acquisitions, joint ventures, agreements, and new product developments to expand their market share and distribution network in the isoprene market from 2012 to 2016.
To speak to our analyst for a discussion on the above findings, click Speak to Analyst
 Exclusive indicates content/data unique to MarketsandMarkets and not available with any competitors.
Table of Contents
1 Introduction (Page No. - 15)
1.1 Objectives of the Study
1.2 Market Definition
1.3 Market Scope
1.3.1 Years Considered for the Study
1.4 Currency
1.5 Package Size
1.6 Limitations
1.7 Stakeholders
2 Research Methodology (Page No. - 18)
2.1 Research Data
2.1.1 Secondary Data
2.1.1.1 Key Data From Secondary Sources
2.1.2 Primary Data
2.1.2.1 Key Data From Primary Sources
2.1.2.2 Key Industry Insights
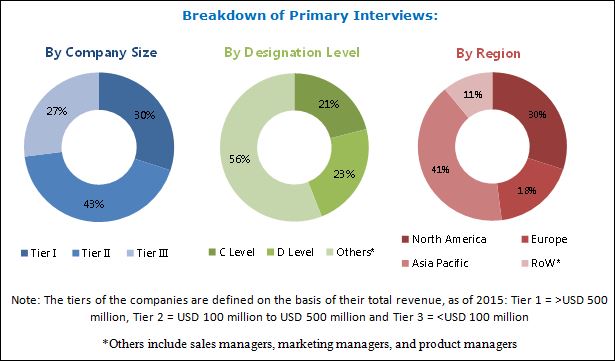
2.1.2.3 Breakdown of Primary Interviews
2.2 Market Size Estimation
2.2.1 Bottom-Up Approach
2.2.2 Top-Down Approach
2.3 Data Triangulation
2.4 Assumptions
3 Executive Summary (Page No. - 27)
4 Premium Insights (Page No. - 31)
4.1 Significant Opportunities in the Isoprene Market
4.2 Isoprene Market in Europe, By Application and Country
4.3 Isoprene Market Size, By Country
4.4 Isoprene Market, By Type
4.5 Isoprene Market, By Application
4.6 Isoprene Market, By End-Use Industry
5 Market Overview (Page No. - 34)
5.1 Introduction
5.2 Market Dynamics
5.3 Impact Analysis
5.3.1 Drivers
5.3.1.1 Growth in the Synthetic Rubber Industry to Increase the Production of Isoprene
5.3.1.2 Demand for Polyisoprene Rubber in the Medical Sector
5.3.2 Restraints
5.3.2.1 Regulations in the Rubber Manufacturing Industry
5.3.3 Opportunities
5.3.3.1 Developing Countries in Asia-Pacific Offer Huge Growth Opportunities
5.3.3.2 Growing Demand for Improved Performance and Low Rolling Resistance Tires Providing Growth Opportunities for Isoprene
5.3.4 Challenges
5.3.4.1 Price Sensitivity in the Market Due to the Demand-Supply Gap
5.3.4.2 Crude Oil Price Fluctuations
5.4 Porter�s Five Forces Analysis:Isoprene Market
5.4.1 Threat of Substitutes
5.4.2 Bargaining Power of Suppliers
5.4.3 Bargaining Power of Buyers
5.4.4 Intensity of Rivalry
5.4.5 Threat of New Entrants
5.5 Macroeconomic Indicators
5.5.1 GDP Growth Rate Forecast of Major Economies in the World
5.5.2 Automotive Industry Analysis
5.5.3 Tire Industry Analysis
5.5.4 Rubber Industry Analysis
6 Isoprene Market, By Type (Page No. - 46)
6.1 Introduction
6.2 Polymerization Grade
6.3 Chemical Grade
7 Isoprene Market, By Application (Page No. - 52)
7.1 Introduction
7.2 Polyisoprene
7.3 SIS (Styrene Isoprene Styrene)
7.4 IIR (Isobutylene Isoprene Rubber)
7.5 Others
8 Isoprene Market, By End-Use Industry (Page No. - 61)
8.1 Introduction
8.2 Tires
8.3 Adhesives
8.4 Non-Tire
8.5 Others
9 Isoprene Market, By Region (Page No. - 70)
9.1 Introduction
9.2 North America
9.2.1 U.S.
9.2.2 Canada
9.2.3 Mexico
9.3 Europe
9.3.1 Russia
9.3.2 Germany
9.3.3 U.K.
9.3.4 France
9.3.5 Rest of the Europe
9.4 Asia-Pacific
9.4.1 China
9.4.2 Japan
9.4.3 India
9.4.4 Malaysia
9.4.5 Indonesia
9.4.6 Thailand
9.4.7 Rest of Asia-Pacific
9.5 Middle East & Africa
9.5.1 Saudi Arabia
9.5.2 UAE
9.5.3 Rest of the Middle East & Africa
9.6 South America
9.6.1 Brazil
9.6.2 Argentina
9.6.3 Rest of the South America
10 Competitive Landscape (Page No. - 125)
10.1 Key Strategies Adopted By Key Players
10.2 Market Ranking Analysis of Key Players
11 Company Profiles (Page No. - 128)
(Overview, Financial*, Products & Services, Strategy, and Developments)
11.1 Sibur
11.2 PJSC Nizhnekamskneftekhim
11.3 The Goodyear Tire and Rubber Company.
11.4 Royal Dutch Shell PLC.
11.5 Lyondellbasell Industries N.V.
11.6 Zeon Corporation
11.7 Kuraray Co. Ltd.
11.8 Ningbo Jinhai Chenguang
11.9 Shandong Yuhuang Chemical Group Co. Ltd.
11.10 Finetech Industry Ltd
11.11 Haihang Industry Co. Ltd.
11.12 Fortrec Chemicals and Petroleum Pte Ltd.
11.13 Braskem S.A.
11.14 JSR Corporation.
*Details Might Not Be Captured in Case of Unlisted Companies
12 Appendix (Page No. - 153)
12.1 Insights From Key Industry Experts
12.2 Discussion Guide
12.3 Knowledge Store: Marketsandmarkets Subscription Portal
12.4 Introducing RT: Real-Time Market Intelligence
12.5 Available Customizations
12.6 Related Reports
12.7 Author Details
List of Tables (155 Tables)
Table 1 World Rubber Production, 2010�2015 (Kiloton)
Table 2 World Rubber Consumption (Kiloton)
Table 3 Trends and Forecast for GDP Growth Rates Between 2016 and 2021
Table 4 Rubber Production/Consumption Ratio in Asia-Pacific, 2015
Table 5 Properties of Isoprene, By Type
Table 6 Isoprene Market Size, By Type, 2014�2021 (USD Million)
Table 7 Isoprene Market Size, By Type, 2014�2021 (Kiloton)
Table 8 Polymerization Grade Isoprene Market Size, By Region, 2014�2021 (USD Million)
Table 9 Polymerization Grade Isoprene Market Size, By Region, 2014�2021 (Kiloton)
Table 10 Isoprene Market Size, By Region, 2014�2021 (USD Million)
Table 11 Isoprene Market Size, By Region, 2014�2021 (Kiloton)
Table 12 Isoprene Market Size, By Application, 2014�2021 (USD Million)
Table 13 Isoprene Market Size, By Application, 2014�2021 (Kiloton)
Table 14 Isoprene Market Size in Polyisoprene Application, By Region, 2014�2021 (USD Million)
Table 15 Isoprene Market Size in Polyisoprene Application, By Region, 2014�2021 (Kiloton)
Table 16 Isoprene Market Size in Styrene Isoprene Styrene Application, By Region, 2014�2021 (USD Million)
Table 17 By Market Size in Styrene Isoprene Styrene Application, By Region, 2014�2021 (Kiloton)
Table 18 By Market Size in Isobutylene Isoprene Rubber Application, By Region, 2014�2021 (USD Million)
Table 19 By Market Size in Isobutylene Isoprene Rubber Application, By Region, 2014�2021 (Kiloton)
Table 20 By Market Size in Other Applications, By Region, 2014�2021 (USD Million)
Table 21 By Market Size in Other Applications, By Region, 2014�2021 (Kiloton)
Table 22 By Market Size, By End-Use Industry, 2014�2021 (USD Million)
Table 23 By Market Size, By End-Use Industry, 2014�2021 (Kiloton)
Table 24 By Market Size in Tire Industry, By Region, 2014�2021 (USD Million)
Table 25 By Market Sizein Tire Industry, By Region, 2014�2021 (Kiloton)
Table 26 By Market Size in Adhesives Industry, By Region, 2014�2021 (USD Million)
Table 27 By Market Size in Adhesives Industry, By Region, 2014�2021 (Kiloton)
Table 28 By Market Size in Non-Tire Industry, By Region, 2014�2021 (USD Million)
Table 29 By Market Size in Non-Tire Industry, By Region, 2014�2021 (Kiloton)
Table 30 By Market Size in Other End-Use Industries, By Region, 2014�2021 (USD Million)
Table 31 By Market Size in Other End-Use Industries, By Region, 2014�2021 (Kiloton)
Table 32 North America: By Market Size, By Country, 2014�2021 (USD Million)
Table 33 North America: By Market Market Size, By Country, 2014�2021 (Kiloton)
Table 34 North America: By Market Market Size, By Type, 2014�2021 (USD Million)
Table 35 North America: By Market Market Size, By Type, 2014�2021 (Kiloton)
Table 36 North America: By Market Market Size, By Application, 2014�2021 (USD Million)
Table 37 North America: By Market Market Size, By Application, 2014�2021 (Kiloton)
Table 38 North America: By Market Market Size, By End-Use Industry, 2014�2021 (USD Million)
Table 39 North America: By Market Market Size, By End-Use Industry, 2014�2021 (Kiloton)
Table 40 U.S.: Isoprene Market Size, By Application, 2014�2021 (USD Million)
Table 41 U.S.: Isoprene Market Size, By Application, 2014�2021 (Kiloton)
Table 42 U.S.: Isoprene Market Size, By End-Use Industry, 2014�2021 (USD Million)
Table 43 U.S.: Isoprene Market Size, By End-Use Industry, 2014�2021 (Kiloton)
Table 44 Canada: By Market Size, By Application, 2014�2021 (USD Million)
Table 45 Canada: By Market Size, By Application, 2014�2021 (Kiloton)
Table 46 Canada: By Market Size, By End-Use Industry, 2014�2021 (USD Million)
Table 47 Canada: By Market Size, By End-Use Industry, 2014�2021 (Kiloton)
Table 48 Mexico: By Market Size, By Application, 2014�2021 (USD Million)
Table 49 Mexico: By Market Size, By Application, 2014�2021 (Kiloton)
Table 50 Mexico: By Market Size, By End-Use Industry, 2014�2021 (USD Million)
Table 51 Mexico: By Market Size, By End-Use Industry, 2014�2021 (Kiloton)
Table 52 Europe: By Market Size, By Country, 2014�2021 (USD Million)
Table 53 Europe: By Market Size, By Country, 2014�2021 (Kiloton)
Table 54 Europe: By Market Size, By Type, 2014�2021 (USD Million)
Table 55 Europe: By Market Size, By Type, 2014�2021 (Kiloton)
Table 56 Europe: By Market Size, By Application, 2014�2021 (USD Million)
Table 57 Europe: By Market Size, By Application, 2014�2021 (Kiloton)
Table 58 Europe: By Market Size, By End-Use Industry, 2014�2021 (USD Million)
Table 59 Europe: By Market Size, End-Use Industry, 2014�2021 (Kiloton)
Table 60 Russia: Isoprene Market Size, By Application, 2014�2021 (USD Million)
Table 61 Russia: Isoprene Market Size, By Application, 2014�2021 (Kiloton)
Table 62 Russia: Isoprene Market Size, By End-Use Industry, 2014�2021 (USD Million)
Table 63 Russia: Isoprene Market Size, By End-Use Industry, 2014�2021 (Kiloton)
Table 64 Germany: By Market Size, By Application, 2014�2021 (USD Million)
Table 65 Germany: By Market Size, By Application, 2014�2021 (Kiloton)
Table 66 Germany: By Market Size, By End-Use Industry, 2014�2021 (USD Million)
Table 67 Germany: By Market Size, By End-Use Industry, 2014�2021 (Kiloton)
Table 68 U.K.: By Market Size, By Application, 2014�2021 (USD Million)
Table 69 U.K.: By Market Size, By Application, 2014�2021 (Kiloton)
Table 70 U.K.: By Market Size, By End-Use Industry, 2014�2021 (USD Million)
Table 71 U.K.: By Market Size, By End-Use Industry, 2014�2021 (Kiloton)
Table 72 France: By Market Size, By Application, 2014�2021 (USD Million)
Table 73 France: By Market Size, By Application, 2014�2021 (Kiloton)
Table 74 France: By Market Size, By End-Use Industry, 2014�2021 (USD Million)
Table 75 France: By Market Size, By End-Use Industry, 2014�2021 (Kiloton)
Table 76 Rest of Europe: Isoprene Market Size, By Application, 2014�2021 (USD Million)
Table 77 Rest of Europe: Isoprene Market Size, By Application, 2014�2021 (Kiloton)
Table 78 Rest of Europe: Isoprene Market Size, By End-Use Industry, 2014�2021 (USD Million)
Table 79 Rest of Europe: Isoprene Market Size, By End-Use Industry, 2014�2021 (Kiloton)
Table 80 Asia-Pacific: By Market Size, By Country, 2014�2021 (USD Million)
Table 81 Asia-Pacific: By Market Size, By Country, 2014�2021 (Kiloton)
Table 82 Asia-Pacific: By Market Size, By Type, 2014�2021 (USD Million)
Table 83 Asia-Pacific: By Market Size, By Type, 2014�2021 (Kiloton)
Table 84 Asia-Pacific: By Market Size, By Application, 2014�2021 (USD Million)
Table 85 Asia-Pacific: By Market Size, By Application, 2014�2021 (Kiloton)
Table 86 Asia-Pacific: By Market Size, By End-Use Industry, 2014�2021 (USD Million)
Table 87 Asia-Pacific: By Market Size, By End-Use Industry, 2014�2021 (Kiloton)
Table 88 China: By Market Size, By Application, 2014�2021 (USD Million)
Table 89 China: By Market Size, By Application, 2014�2021 (Kiloton)
Table 90 China: By Market Size, By End-Use Industry, 2014�2021 (USD Million)
Table 91 China: By Market Size, By End-Use Industry, 2014�2021 (Kiloton)
Table 92 Japan: Tire Production Trend, 2012�2015
Table 93 Japan: By Market Size, By Application, 2014�2021 (USD Million)
Table 94 Japan: By Market Size, By Application, 2014�2021 (Kiloton)
Table 95 Japan: By Market Size, By End-Use Industry, 2014�2021 (USD Million)
Table 96 Japan: By Market Size, By End-Use Industry, 2014�2021 (Kiloton)
Table 97 India: By Market Size, By Application, 2014�2021 (USD Million)
Table 98 India: By Market Size, By Application, 2014�2021 (Kiloton)
Table 99 India: By Market Size, By End-Use Industry, 2014�2021 (USD Million)
Table 100 India: By Market Size, By End-Use Industry, 2014�2021 (Kiloton)
Table 101 Malaysia: By Market Size, By Application, 2014�2021 (USD Million)
Table 102 Malaysia: By Market Size, By Application, 2014�2021 (Kiloton)
Table 103 Malaysia: By Market Size, By End-Use Industry, 2014�2021 (USD Million)
Table 104 Malaysia: By Market Size, By End-Use Industry, 2014�2021 (Kiloton)
Table 105 Indonesia: By Market Size, By Application, 2014�2021 (USD Million)
Table 106 Indonesia: By Market Size, By Application, 2014�2021 (Kiloton)
Table 107 Indonesia: By Market Size, By End-Use Industry, 2014�2021 (USD Million)
Table 108 Indonesia: By Market Size, By End-Use Industry, 2014�2021 (Kiloton)
Table 109 Thailand: Isoprene Market Size, By Application, 2014�2021 (USD Million)
Table 110 Thailand: Isoprene Market Size, By Application, 2014�2021 (Kiloton)
Table 111 Thailand: Isoprene Market Size, By End-Use Industry, 2014�2021 (USD Million)
Table 112 Thailand: Isoprene Market Size, By End-Use Industry, 2014�2021 (Kiloton)
Table 113 Rest of Asia-Pacific: By Market Size, By Application, 2014�2021 (USD Million)
Table 114 Rest of the Asia-Pacific: By Market Size, By Application, 2014�2021 (Kiloton)
Table 115 Rest of Asia-Pacific: By Market Size, By End-Use Industry, 2014�2021 (USD Million)
Table 116 Rest of the Asia-Pacific: By Market Size, By End-Use Industry, 2014�2021 (Kiloton)
Table 117 Middle East & Africa: By Market Size, By Type, 2014�2021 (USD Million)
Table 118 Middle East & Africa: By Market Size, By Type, 2014�2021 (Kiloton)
Table 119 Middle East & Africa: By Market Size, By Application, 2014�2021 (USD Million)
Table 120 Middle East & Africa: By Market Size, By Application, 2014�2021 (Kiloton)
Table 121 Middle East & Africa: By Market Size, By End-Use Industry, 2014�2021 (USD Million)
Table 122 Middle East & Africa: By Market Size, By End-Use Industry, 2014�2021 (Kiloton)
Table 123 Saudi Arabia: Isoprene Market Size, By Application, 2014�2021 (USD Million)
Table 124 Saudi Arabia: Isoprene Market Size, By Application, 2014�2021 (Kiloton)
Table 125 Saudi Arabia: Isoprene Market Size, By End-Use Industry, 2014�2021 (USD Million)
Table 126 Saudi Arabia: Isoprene Market Size, By End-Use Industry, 2014�2021 (Kiloton)
Table 127 UAE: By Market Size, By Application, 2014�2021 (USD Million)
Table 128 UAE: By Market Size, By Application, 2014�2021 (Kiloton)
Table 129 UAE: By Market Size, By End-Use Industry, 2014�2021 (USD Million)
Table 130 UAE: By Market Size, By End-Use Industry, 2014�2021 (Kiloton)
Table 131 Rest of Middle East & Africa: Isoprene Market Size, By Application, 2014�2021 (USD Million)
Table 132 Rest of Middle East & Africa: Isoprene Market Size, By Application, 2014�2021 (Kiloton)
Table 133 Rest of Middle East & Africa: Isoprene Market Size, By End-Use Industry, 2014�2021 (USD Million)
Table 134 Rest of the Middle East & Africa: Isoprene Market Size, By End-Use Industry, 2014�2021 (Kiloton)
Table 135 South America: By Market Size, By Country, 2014�2021 (USD Million)
Table 136 South America: By Market Size, By Country, 2014�2021 (Kiloton)
Table 137 South America: By Market Size, By Type, 2014�2021 (USD Million)
Table 138 South America: By Market Size, By Type, 2014�2021 (Kiloton)
Table 139 South America: By Market Size, By Application, 2014�2021 (USD Million)
Table 140 South America: By Market Size, By Application, 2014�2021 (Kiloton)
Table 141 South America: By Market Size, By End-Use Industry, 2014�2021 (USD Million)
Table 142 South America: By Market Size, By End-Use Industry, 2014�2021 (Kiloton)
Table 143 Brazil: Isoprene Market Size, By Application, 2014�2021 (USD Million)
Table 144 Brazil: Isoprene Market Size, By Application, 2014�2021 (Kiloton)
Table 145 Brazil: Isoprene Market Size, By End-Use Industry, 2014�2021 (USD Million)
Table 146 Brazil: Isoprene Market Size, By End-Use Industry, 2014�2021 (Kiloton)
Table 147 Argentina: By Market Size, By Application, 2014�2021 (USD Million)
Table 148 Argentina: By Market Size, By Application, 2014�2021 (Kiloton)
Table 149 Argentina: By Market Size, By End-Use Industry, 2014�2021 (USD Million)
Table 150 Argentina: By Market Size, By End-Use Industry, 2014�2021 (Kiloton)
Table 151 Rest of the South America: Isoprene Market Size, By Application, 2014�2021 (USD Million)
Table 152 Rest of the South America: Isoprene Market Size, By Application, 2014�2021 (Kiloton)
Table 153 Rest of the South America: Isoprene Market Size, By End-Use Industry, 2014�2021 (USD Million)
Table 154 Rest of the South America: Isoprene Market Size, By End-Use Industry, 2014�2021 (Kiloton)
Table 155 Major Isoprene Manufacturers & Their Ranks, 2015
List of Figures (61 Figures)
Figure 1 Isoprene Market Segmentation
Figure 2 Isoprene Market: Research Design
Figure 3 Market Size Estimation Methodology: Bottom-Up Approach
Figure 4 Market Size Estimation Methodology: Top-Down Approach
Figure 5 Isoprene Market: Data Triangulation
Figure 6 Polymerization Grade Type Dominates the Isoprene Market
Figure 7 Polyisoprene to Be the Dominant Application of Isoprene Between 2016 and 2021
Figure 8 Tires End-Use Industry to Dominate the Isoprene Market
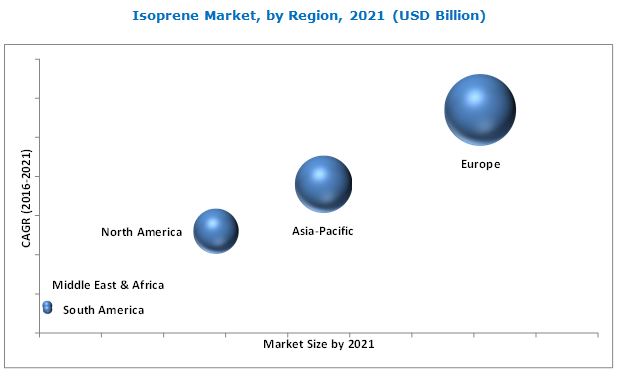
Figure 9 Europe Led the Isoprene Market in 2015
Figure 10 Tire Industry to Drive the Isoprene Market Growth, 2016�2021
Figure 11 Russia to Lead the Isoprene Market in Europe
Figure 12 Russia Projected to Be the Fastest-Growing Market Between 2016 and 2021
Figure 13 Polymerization Grade to Dominate the Isoprene Market, 2016�2021 (Kiloton)
Figure 14 Polyisoprene to Account for the Largest Share (By Volume), 2016�2021
Figure 15 Tire Industry to Account for the Largest Share (Value), 2015
Figure 16 Growth in the Global Synthetic Rubber Industry is Likely to Result in Increased Isoprene Production
Figure 17 Regional Share in Vehicle Production, 2015
Figure 18 Top-10 Vehicle Producing Countries, 2015
Figure 19 Global Tire Production, 2015
Figure 20 Top-10 Tire Producing Countries, 2015
Figure 21 Major Players in the Tire Industry
Figure 22 Polymerization Grade Type Dominated the Isoprene Market (By Volume), 2015
Figure 23 Europe to Lead the Polymerization Grade Isoprene Market
Figure 24 Asia-Pacific to Account for the Largest Share of Chemical Grade Isoprene
Figure 25 Polyisoprene Application Dominated the Isoprene Market, 2015 (By Volume)
Figure 26 European Market Projected to Account for the Largest Share in the Polyisoprene Application
Figure 27 Asia-Pacific to Account for the Second-Largest Share in the Styrene Isoprene Styrene Application
Figure 28 Isoprene Consumption in Isobutylene Isoprene Rubber Application Highest in Asia-Pacific
Figure 29 Europe Leads the Isoprene Market in Other Applications
Figure 30 Tire Industry Accounted for the Largest Share of Isoprene Market, 2015 (By Volume)
Figure 31 European Isoprene Market Projected to Account for the Largest Share in the Tire Industry
Figure 32 Asia-Pacific to Account for the Second-Largest Share in the Adhesives Industry
Figure 33 Isoprene Consumption in the Non-Tire End-Use Industry to Be the Highest in Europe
Figure 34 Europe Accounted for the Largest Share of Isoprene Market Demand for Other End-Use Industries
Figure 35 Regional Snapshot: Rapidly Growing Markets are Emerging as New Strategic Locations
Figure 36 Europe Market Snapshot: Russia to Be the Largest Market
Figure 37 Asia-Pacific Market Snapshot: China to Be the Largest Isoprene Market
Figure 38 Polyisoprene Application Accounted for the Largest Share of Asia-Pacific Isoprene Market, 2015( in Terms of Volume)
Figure 39 Thailand Tire Production, 2014�2015 (Million Unit)
Figure 40 UAE Vehicle Sales in 2014
Figure 41 Key Growth Strategies Between 2012 and 2016
Figure 42 Share of Different Strategies Adopted Between 2012 and 2016
Figure 43 Snapshot of the Strategies Adopted Between 2012 and 2016
Figure 44 Sibur: Company Snapshot
Figure 45 Strengths & Weaknesses: Sibur
Figure 46 Nizhnekamskneftekhim: Company Snapshot
Figure 47 Strengths and Weaknesses: Nizhnekamskneftekhim
Figure 48 The Goodyear Tire and Rubber Company: Company Snapshot
Figure 49 Strengths and Weaknesses: the Goodyear Tire and Rubber Company
Figure 50 Royal Dutch Shell PLC: Company Snapshot
Figure 51 Strengths and Weaknesses: Royal Dutch Shell PLC.
Figure 52 Lyondellbasell Industries N.V.: Company Snapshot
Figure 53 Strengths and Weaknesses: Lyondellbasell Industries N.V.
Figure 54 Zeon Corporation: Company Snapshot
Figure 55 Strengths and Weaknesses: Zeon Corporation
Figure 56 Kuraray Co. Ltd.: Company Snapshot
Figure 57 Strengths and Weaknesses: Kuraray Co. Ltd.
Figure 58 Braskem S.A.: Company Snapshot
Figure 59 Strengths and Weaknesses: Braskem
Figure 60 JSR Corporation : Company Snapshot
Figure 61 Strengths and Weaknesses: JSR Corporation


Growth opportunities and latent adjacency in Isoprene Market
Can I check the global production capacity and consumption of isoprene for free?