IoT Communication Protocol Market by Connectivity Technology (Wi-Fi, Bluetooth, Zigbee, Bluetooth Smart), End-Use Application (Consumer Electronics, Automotive & Transportation, Building Automation, Healthcare), Region - Global Forecast to 2022


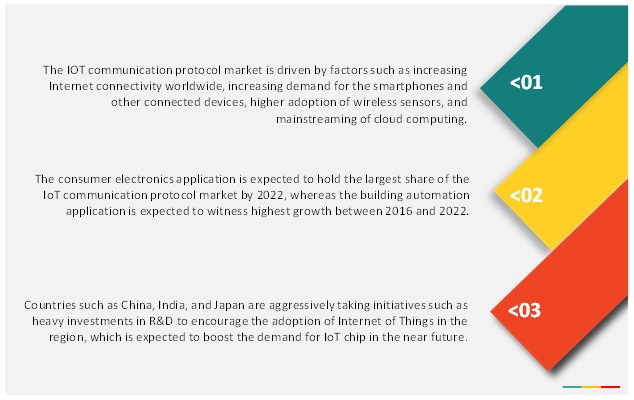
[204 Pages Report] The IOT communication protocol market is expected to grow from USD 11.44 billion in 2015 to reach USD 15.80 billion by 2022, at a CAGR of 4.66% during the forecast period. IoT communication protocol adoption would grow in proportion with the growth of connected devices. The major drivers for the growth of IoT are the growth of Internet connectivity, continuous growth of smartphones and connected devices, higher adoption of cloud computing, increased usage of wireless sensors and low power wide-area networks. The report segments the IoT communication protocol market on the basis of technology, application, and geography. The market study includes the market size of different technologies such as Wi-Fi, Bluetooth, Bluetooth Smart, Wi-Fi/ Bluetooth, Ant+/Bluetooth, ZigBee, NFC, GNSS, WHART, Cellular, NFC, and EnOcean among others. The market is segmented on the basis of end–use application into wearable devices, healthcare, automotive & transportation, building automation, industrial, consumer electronics and precision farming. The base year considered for the study is 2015 and the forecast period is between 2016 and 2022.
Market Dynamics
Drivers
- Expansion of Internet connectivity
- Continuous growth in demand for smartphones and other connectivity devices
- Mainstreaming of cloud computing
- Expansion in use of wireless sensors and low-power wide-area networks (LPWA) network
Restraints
- Lack of common communication standards across platforms
- Frequent replacement of batteries and high power consumption by connected devices
Opportunities
- Significant government funding across globe for research and development of Internet of Things
- Opportunities for innovative cross domain application
Challenges
- Security and privacy of the information in IoT
Applications in building automation expected to drive the IoT communication protocol market in the near future
The consumer electronics application is expected to hold the largest share of the IoT communication protocol market by 2022, whereas the building automation application is expected to witness highest growth between 2016 and 2022. The IoT technology market in consumer electronics segment is expected to hold significant share owing to the emergence of a number of smart appliances that can connect to the Internet and smartphones. The growing concern for conservation of energy coupled with the rising cost of energy has led to increase the demand for energy efficient buildings. As the building automation not only help to increase the energy efficiency of the building but can also help to enhance the security and safety in buildings. This factor has led to the growth in demand for building automation.
The following are the major objectives of the study.
- To define, describe, and forecast the IoT communication protocol market on the basis of connectivity technology, end-use application, and region
- To provide detailed information regarding the major factors influencing the growth of the market (drivers, restraints, opportunities, and industry-specific challenges)
- To strategically analyze the micro-markets with respect to the individual growth trends, future prospects, and contribution to the total market
- To provide a detailed Porter's analysis and it forces and relative impact of these forces on the overall IoT communication protocol market
- To provide the detailed value chain analysis for the entire IoT communication protocol market with detail explanation of the major stake holders for IoT ecosystem along with the value chain of semiconductor IP
- To analyze opportunities in the market for stakeholders and detail the competitive landscape for the market leaders
- To forecast the value of market segments with respect to the main regions, namely, North America, Europe, Asia-Pacific, and Rest of the World (RoW)
- To strategically profile the key players and comprehensively analyze their market rankings and core competencies
- To analyze competitive developments such as joint ventures, collaborations, mergers and acquisitions, new product developments, and research & developments in the IoT communication protocol market
The overall IOT communication protocol market, in terms of value, is expected to grow from USD 11.44 billion in 2015 to USD 15.80 billion by 2022, at a CAGR of 4.66% between 2016 and 2022. The market is highly diversified and competitive with market players that include top-tier and mid-tier companies and as well as start-up firms. With the rate of proliferation of wireless sensors, the increasing adoption of emerging technologies, and mainstreaming of many smart consumer applications, the IoT technology has become the most popular concept across domains, such as automotive, healthcare, and consumer electronics among others.
This report covers the IoT communication protocol market segmented on the basis of connectivity technology, end-use application, and region. The market study includes the market size of different technologies such as Wi-Fi, Bluetooth, Bluetooth Smart, Wi-Fi/ Bluetooth, Ant+/Bluetooth, ZigBee, NFC, GNSS, WHART, Cellular, NFC, and EnOcean among others. The market is segmented on the basis of end-use application into wearable devices, healthcare, automotive & transportation, building automation, industrial, consumer electronics and precision farming. The market is segmented on the basis of geography into North America, Europe, Asia-Pacific, and Rest of the World.
The market for Wi-Fi connectivity technology held the largest share followed by Bluetooth. The major reason for the large share is that Wi-Fi is already being widely deployed, and it is easy to add new devices to the enterprises, hospitals and homes. Bluetooth is also widely deployed and operates at low power and have reliable connectivity. The major market for Wi-Fi and Bluetooth is in consumer electronics which include smartphones, smart TVs, home theater projectors, next-generation console, tablets & laptops and set-top boxes in consumer devices, and washing machine, refrigerator, dishwasher and ovens in consumer appliances.
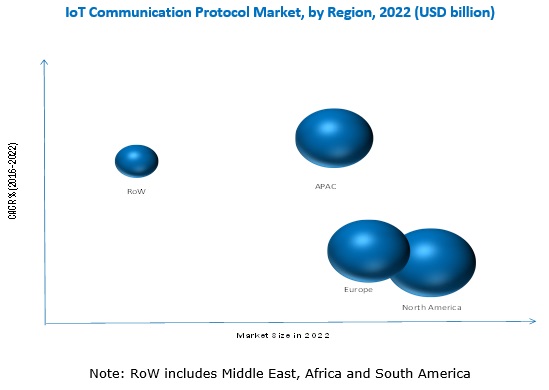
The North America region held the largest share of the IoT communication protocol market in 2015. The major driving factors for the growth in the North America region are increased research and development in the field of IoT, high penetration of Internet and smartphones, and growth of a number of IoT startups. The APAC region is expected to grow at the highest CAGR during the forecast period. The presence of a huge end-user base in advanced economies such as Japan and South Korea and the growing demand for energy management systems are further expected to drive the market in this region.
IOT communication protocol applications in consumer electronics, automotive & transportation, and building automation drives the growth of IOT communication protocol market
Consumer Electronics
Consumer electronics is a key area in the Internet of Things (IoT) and continues to gain traction every day. The IoT is changing the game for consumer electronics manufacturers; enabling new revenue opportunities, providing new insights into consumer usage, and bringing true interoperability with other connected consumer products.
Automotive & Transportation
The Internet of Things (IoT) has given rise to new segments in the automotive and transportation sector such as connected cars and intelligent transportation systems (ITS). ITS include sensors, communication, and traffic control technologies. In transportation, Internet of Things (IoT) applications helps improve transport utilization and road safety with the convergence of real-time road traffic data. The growth of the connected car market along with the implementation of ITS throughout the world is expected to drive the market for connectivity ICs. Various connectivity ICs used in the automotive & transportation market are ZigBee, Wi-Fi, Ethernet, Bluetooth, WiMAX, and Cellular.
Building Automation
The building automation industry is driven by factors such as low development costs, low operating costs, increased comforts, healthy indoor environment, enhanced durability, and low maintenance costs. The growing awareness toward energy conservation, stringent legislations, and building directives, promotion of numerous smart grid technologies, and the availability of a number of open protocols are further driving the growth of the building automation market.
Critical questions the report answers:
- Where will all these developments take the industry in the mid to long term?
- What are the upcoming industry applications for IOT communication protocols?
Lack of common communication standards across platforms and low power efficiency of IoT devices act as restraints for the growth of this market. The IoT communication protocol market provides huge scope for innovative cross domain applications and development of comprehensive system solutions. The increasing interconnectivity of IoT-enabled devices collecting and sharing data significantly increases the number of potential vulnerabilities within the IoT ecosystem causing major data security and privacy issues.
The key players in the IoT technology market are STMicroelectronics N.V. (Switzerland), NXP Semiconductors N.V. (Netherlands), Synopsys, Inc. (U.S.), CEVA, Inc. (U.S.), and Texas Instruments, Inc. (U.S.) among others. STMicroelectronics N.V. (Switzerland) is the leader in the IOT communication protocol market. STMicroelectronics N.V. (Switzerland) is engaged in the design, development, manufacture, and marketing of various semiconductor integrated circuits and discrete devices globally. The company delivers its products for various applications such as automotive products, computer peripherals, telecommunications systems, consumer products, industrial automation, and control systems. ST’s wireless connectivity portfolio includes a variety of transceivers, network processors ICs and fully certified modules to support the major technology currently available for wireless connectivity from Bluetooth (including Smart) to sub 1GHz for the ISM band and Wi–Fi.
To speak to our analyst for a discussion on the above findings, click Speak to Analyst
 Exclusive indicates content/data unique to MarketsandMarkets and not available with any competitors.
Table of Content
1 Introduction (Page No. - 19)
1.1 Objectives of the Study
1.2 Market Definition
1.3 Study Scope
1.3.1 Markets Covered
1.3.2 Geographic Scope
1.3.3 Years Considered for the Study
1.4 Currency
1.5 Limitations
1.6 Stakeholders
2 Research Methodology (Page No. - 24)
2.1 Research Data
2.1.1 Secondary Data
2.1.1.1 Key Data From Secondary Sources
2.1.2 Primary Data
2.1.2.1 Key Data From Primary Sources
2.1.2.2 Key Industry Insights
2.1.2.3 Breakdown of Primaries
2.2 Factor Analysis
2.2.1 Introduction
2.2.2 Demand-Side Analysis
2.2.2.1 Growth of Connected Living
2.2.2.2 Energy Savings Through IoT
2.2.2.3 Internet of Things (IoT) has Tremendous Potential for Applications in Several Major Sectors
2.2.3 Supply-Side Analysis
2.2.3.1 Vendors’ Strategies in Developing Various Products in Consumer Market
2.2.3.2 Supporting Service Providers for Internet of Things (IoT)
2.3 Market Size Estimation
2.3.1 Bottom–Up Approach
2.3.2 Top–Down Approach
2.4 Market Breakdown and Data Triangulation
2.5 Research Assumptions
3 Executive Summary (Page No. - 35)
4 Premium Insights (Page No. - 40)
4.1 Growth Drivers for the IoT Communication Protocol Market
4.2 Market, By Region
4.3 IoT Communication Protcol Market, By Application and Region
4.4 Market, By Connectivity Protocol, 2016–2022
5 Market Overview (Page No. - 44)
5.1 Introduction
5.2 Evolution of Internet of Things
5.3 Market Segmentation
5.3.1 Market , By Connectivity Technology
5.3.2 Market , By End-Use Application
5.3.3 Market, By Region
5.4 Market Dynamics
5.4.1 Drivers
5.4.1.1 Expansion of Internet Connectivity
5.4.1.2 Continuous Growth in Demand for Smartphones and Other Connectivity Devices
5.4.1.3 Mainstreaming of Cloud Computing
5.4.1.4 Expansion in Use of Wireless Sensors and Low-Power Wide-Area Networks (Lpwa) Network
5.4.2 Restraints
5.4.2.1 Lack of Common Communication Standards Across Platforms
5.4.2.2 Frequent Replacement of Batteries and High Power Consumption By Connected Devices
5.4.3 Opportunities
5.4.3.1 Significant Government Funding Across Globe for Research and Development of Internet of Things
5.4.3.2 Opportunities for Innovative Cross Domain Application
5.4.4 Challenges
5.4.4.1 Security and Privacy of the Information
6 Industry Trends (Page No. - 56)
6.1 Introduction
6.2 Value Chain Analysis
6.3 Porter’s Five Forces Analysis
6.3.1 Threat From New Entrants
6.3.2 Bargaining Power of Suppliers
6.3.3 Threat of Substitute
6.3.4 Bargaining Power of Buyers
6.3.5 Intensity of Rivarly
6.4 Pest Analysis
6.4.1 Political Factor
6.4.2 Economical Factor
6.4.3 Social Factor
6.4.4 Technological Factor
7 IoT Communication Protocol, By Connectivity Technology (Page No. - 65)
7.1 Introduction
7.2 Wi-Fi
7.3 Bluetooth
7.4 Bluetooth Smart
7.5 Wi-Fi/Bluetooth Smart
7.6 Bluetooth Smart/ANT+
7.7 ZigBee
7.8 Near Field Communication (NFC)
7.9 Global Navigation Satellite System (GNSS)
7.10 Enocean
7.11 ANT+
7.12 Cellular
7.13 Wireless Highway Addressable Remote Transducer Protocol (WHART)
7.14 Others
8 IoT Communication Protocol Market, By End-Use Application (Page No. - 81)
8.1 Introduction
8.2 Wearable Devices
8.2.1 Introduction
8.2.2 Wearable Devices Market, By Type
8.2.2.1 Wristwear
8.2.2.1.1 Wristwatches
8.2.2.1.2 Wristbands
8.2.2.2 Eyewear
8.2.2.2.1 Smart Glasses and Goggles
8.2.2.2.2 Contact Lenses and Other Displays
8.2.2.3 Footwear
8.2.2.3.1 Casual Footwear
8.2.2.3.2 Special-Application Footwear
8.2.2.4 Neckwear
8.2.2.4.1 Fashion and Jewelry
8.2.2.4.2 Tie and Collar Wear
8.2.2.5 Bodywear
8.2.2.5.1 Clothing and Innerwear
8.2.2.5.2 Fashion and Apparel
8.2.2.5.3 Arm and Legwear
8.2.3 Market, By Connectivity Technology
8.2.3.1 ANT+/Bluetooth Smart
8.2.3.2 Bluetooth Smart /Wi–Fi
8.3 Healthcare
8.3.1 Introduction
8.3.2 Market, By Connectivity Technology
8.3.2.1 ANT+
8.3.2.2 Bluetooth Smart
8.3.2.3 ZigBee
8.4 Automotive & Transportation
8.4.1 Introduction
8.4.2 Market, By Connectivity Technology
8.4.2.1 802.15.4 (ZigBee)
8.4.2.2 802.11 (Wi-Fi)
8.4.2.3 Bluetooth
8.4.2.4 Wimax
8.4.2.5 Cellular
8.4.3 Market, By Product
8.4.3.1 Ultrasonic Sensors
8.4.3.2 Cameras (Image Sensors)
8.4.3.3 Lidar
8.4.3.4 Radar
8.4.3.5 Inductive Loop
8.4.3.6 Magnetic Detector
8.4.3.7 IR Detector
8.4.3.8 Acoustic Sensors
8.5 Building Automation
8.5.1 Introduction
8.5.2 Building Automation Market, By Type
8.5.2.1 Commercial Building Automation
8.5.2.1.1 Hospitals & Healthcare
8.5.2.1.2 Retail & Public Assembly
8.5.2.1.3 Office Buildings
8.5.2.2 Residential Building Automation/ Smart Homes
8.5.2.2.1 Diy (Do It Yourself) Home Automation
8.5.3 Market, By Product
8.5.3.1 Occupancy Sensors
8.5.3.2 Daylight Sensors
8.5.3.3 Smart Thermostats
8.5.3.4 IP Cameras
8.5.3.5 Smart Meters
8.5.3.6 Smart Locks
8.5.3.7 Smoke Detectors
8.5.3.8 Lighting Control Actuators
8.5.4 Market, By Connectivity Technology
8.5.4.1 ZigBee
8.5.4.2 Z-Wave
8.5.4.3 Wi-Fi
8.5.4.4 Bluetooth
8.5.4.5 NFC
8.5.4.6 Cellular
8.5.4.7 Enocean
8.6 Industrial
8.6.1 Introduction
8.6.2 Market, By Connectivity Technology
8.6.2.1 Wireless Hart + ZigBee
8.6.2.2 Wi-Fi + BLE
8.6.2.3 ISA100
8.6.2.4 Others
8.7 Consumer Electronics
8.7.1 Introduction
8.7.2 Market, By Type
8.7.2.1 Consumer Devices
8.7.2.1.1 Smartphone
8.7.2.1.2 Smart Tv
8.7.2.1.3 Home Theater Projectors
8.7.2.1.4 Next-Generation Gaming Console
8.7.2.1.4.1 7th Generation
8.7.2.1.4.2 8th Generation
8.7.2.1.5 Set-Top Boxes
8.7.2.1.5.1 IPTV Stbs
8.7.2.1.5.2 Hybrid/Dtt Stbs
8.7.2.1.6 Laptops & Tablets
8.7.2.1.7 Others
8.7.2.2 Consumer Appliances
8.7.2.2.1 Washing Machine
8.7.2.2.2 Refrigerator
8.7.2.2.3 Oven
8.7.2.2.4 Dishwasher
8.7.2.2.5 Others
8.7.3 Market, By Connectivity Technology
8.7.3.1 Wi-Fi
8.7.3.2 Wi-Fi + Ethernet
8.7.3.3 Wi-Fi + NFC
8.7.3.4 Wi-Fi + Bluetooth + Ethernet
8.8 Precision Farming
8.8.1 Market, By Connectivity Technology
8.8.1.1 GNSS/Gps
8.8.1.2 Cellular
8.8.1.3 Wi–Fi
9 Geographic Analysis (Page No. - 139)
9.1 Introduction
9.2 North America
9.2.1 U.S.
9.2.2 Canada
9.2.3 Mexico
9.3 Europe
9.3.1 U.K.
9.3.2 France
9.3.3 Germany
9.3.4 Italy
9.4 Asia–Pacific (APAC)
9.4.1 China
9.4.2 India
9.4.3 Japan
9.4.4 South Korea
9.5 Rest of the World (RoW)
10 Competitive Landscape (Page No. - 156)
10.1 Overview
10.2 Market Ranking Analysis
10.3 Competitive Situation and Trends
10.3.1 New Product Devlopment
10.3.2 Agreement, Partnership and Collaboration
10.3.3 Acquisition (2015–2016)
11 Company Profiles (Page No. - 164)
(Overview, Products and Services, Financials, Strategy & Development)*
11.1 Introduction
11.2 Ceva, Inc.
11.3 Synopsys, Inc.
11.4 NXP Semiconductors N.V.
11.5 Stmicroelectronics N.V.
11.6 Texas Instruments Inc.
11.7 Mediatek Inc.
11.8 Enocean GmbH
11.9 Gainspan Corporation
11.10 Atmel Corporation
11.11 Mindtree Ltd.
*Details on Overview, Products and Services, Financials, Strategy & Development Might Not Be Captured in Case of Unlisted Companies.
12 Appendix (Page No. - 197)
12.1 Insights of Industry Experts
12.2 Discussion Guide
12.3 Knowledge Store: Marketsandmarkets’ Subscription Portal
12.4 Introducing RT: Real-Time Market Intelligence
12.5 Available Customizations
12.6 Related Reports
List of Tables (76 Tables)
Table 1 IoT Communication Protocol Market, By Region, 2013–2022 (USD Million)
Table 2 Market: By Connectivity Technology
Table 3 Market Segmentation: By End-Use Application
Table 4 Market Segmentation: By Region
Table 5 Comparison of Wireless Connectivity Technologies
Table 6 IoT Communication Protocol Market, By Connectivity Technology, 2013–2022 (USD Million)
Table 7 Market for Wi-Fi Connectivity Technology, By End-Use Application, 2013–2022 (USD Million)
Table 8 Market for Bluetooth Connectivity Technology, By End-Use Application, 2013–2022 (USD Million)
Table 9 Market for Bluetooth Smart Connectivity Technology, By End-Use Application, 2013–2022 (USD Million)
Table 10 Market for Wi-Fi/ Bluetooth Smart Connectivity Technology, By End-Use Application, 2013–2022 (USD Million)
Table 11 Market for Bluetooth Smart/ ANT+ Connectivity Technology, By End-Use Application, 2013–2022 (USD Million)
Table 12 Market for ZigBee Connectivity Technology, By End-Use Application, 2013–2022 (USD Million)
Table 13 Market for NFC Connectivity Technology Protocol, By End-Use Application, 2013–2022 (USD Million)
Table 14 Market for GNSS Connectivity Technology, By End-Use Application, 2013–2022 (USD Million)
Table 15 Market for Enocean Connectivity Technology, By End-Use Application, 2013–2022 (USD Million)
Table 16 Market for ANT+ Connectivity Technology, By End-Use Application, 2013–2022 (USD Million)
Table 17 Market for Cellular Connectivity Technology, By End-Use Application, 2013–2022 (USD Million)
Table 18 Market for WHART Connectivity Technology Protocol, By End-Use Application, 2013–2022 (USD Million)
Table 19 Market for Other Connectivity Technology, By End-Use Application, 2013–2022 (USD Million)
Table 20 IoT Communication Protocol Market, By End-Use Application, 2013–2022 (USD Million)
Table 21 Market for Wearable Devices, By Type, 2013–2022 (USD Million)
Table 22 Market for Wearable Devices , By Technology, 2013–2022 (USD Million)
Table 23 Market for Wearable Devices , By Region, 2013–2022 (USD Million)
Table 24 Market for Healthcare Application, By Technology, 2013–2022 (USD Million)
Table 25 Market for Healthcare , By Region, 2013–2022 (USD Million)
Table 26 Market for Automotive & Transportation Application, By Technology, 2013–2022 (USD Million)
Table 27 Ultrasonic Sensors Market for Automotive & Transportation Application, By Connectivity Technology, 2013–2022 (USD Million)
Table 28 Cameras (Image Sensors) Market for Automotive & Transportation Application, By Connectivity Technology 2013–2022 (USD Million)
Table 29 Lidar Market for Automotive & Transportation Application, By Connectivity Technology 2013–2022 (USD Million)
Table 30 Radar Market for Automotive & Transportation Application, By Connectivity Technology 2013–2022 (USD Million)
Table 31 Inductive Loop Market for Automotive & Transportation Application, By Connectivity Technology 2013–2022 (USD Million)
Table 32 Magnetic Detector Market for Automotive & Transportation Application, By Connectivity Technology 2013–2022 (USD Million)
Table 33 IR Detector Market for Automotive & Transportation, By Connectivity Technology 2013–2022 (USD Million)
Table 34 Acoustic Sensors Market for Automotive & Transportation Application, By Connectivity Technology 2013–2022 (USD Million)
Table 35 IoT Communication Protocol Market for Automotive & Transportation Application, By Region, 2013–2022 (USD Million)
Table 36 Market for Building Autoimation Application, By Technology, 2013–2022 (USD Million)
Table 37 Market for Building Automation Application, By Type, 2013–2022 (USD Million)
Table 38 Occupancy Sensors Market for Building Automation Application, By Connectivity Technology, 2013–2022 (USD Million)
Table 39 Daylight Sensor Market for Building Automation Application, By Connectivity Technology, 2013–2022 (USD Million)
Table 40 Smart Thermostats for Building Automation Application, By Connectivity Technology, 2013–2022 (USD Million)
Table 41 IP Cameras Market for Building Automation Application, By Connectivity Technology, 2013–2022 (USD Million)
Table 42 Smart Meters Market for Building Automation Application, By Connectivity Technology, 2013–2022 (USD Million)
Table 43 Smart Locks Market for Building Automation Application, By Connectivity Technology, 2013–2022 (USD Thousand)
Table 44 Smoke Detectors Market for Building Automation Application, By Connectivity Technology, 2013–2022 (USD Million)
Table 45 Lighting Control Actuators Market for Building Automation Application, By Connectivity Technology, 2013–2022 (USD Million)
Table 46 IoT Communication Protocol Market for Commercial Building Automation Application, By Component, 2013–2022 (USD Million)
Table 47 Market for Residential Building Automation Application, By Component, 2013–2022 (USD Million)
Table 48 Market for Building Automation Application, By Region, 2013–2022 (USD Million)
Table 49 Market for Industrial Application, By Technology, 2013–2022 (USD Million)
Table 50 Market for Industrial Application, By Region, 2013–2022 (USD Million)
Table 51 Market for Consumer Electronics Application, By Technology, 2013–2022 (USD Million)
Table 52 IoT Communication Protocol Market for Consumer Electronics Application, By Type, 2013–2022 (USD Million)
Table 53 Market for Smartphone Consumer Device, By Technology, 2013–2022 (USD Million)
Table 54 Market for Smart Tv Consumer Device, By Technology, 2013–2022 (USD Million)
Table 55 Market for Home Theater Projector Consumer Devices, By Technology, 2013–2022 (USD Million)
Table 56 Market for Next-Generation Gaming Console, By Technology, 2013–2022 (USD Million)
Table 57 IoT Communication Protocol Market for Set-Top Boxes, By Technology, 2013–2022 (USD Million)
Table 58 Market for Laptops & Tablets, By Technology, 2013–2022 (USD Million)
Table 59 Market for Others, By Technology, 2013–2022 (USD Million)
Table 60 Market for Washing Machine, By Technology, 2013–2022 (USD Million)
Table 61 Market for Refrigerator, By Technology, 2013–2022 (USD Million)
Table 62 Market for Oven, By Technology, 2013–2022 (USD Million)
Table 63 Market for Dishwasher, By Technology, 2013–2022 (USD Million)
Table 64 Market for Others, By Technology, 2013–2022 (USD Million)
Table 65 Market for Consumer Electronics, By Region, 2013–2022 (USD Million)
Table 66 Market for Precision Farming, By Technology, 2013–2022 (USD Million)
Table 67 Market for Precison Farming , By Region, 2013–2022 (USD Million)
Table 68 Market, By Region, 2013–2022 (USD Million)
Table 69 Market in North America, By End-Use Application, 2013–2022 (USD Million)
Table 70 Market in Europe, By End-Use Application, 2013–2022 (USD Million)
Table 71 Market in APAC, By End-Use Application, 2013–2022 (USD Million)
Table 72 Market in RoW, By End-Use Application, 2013–2022 (USD Million)
Table 73 Market Ranking of the Top 5 Players in the Market
Table 74 New Product Devlopment (2015–2016)
Table 75 Agreement, Partnership and Collaboration (2015–2016)
Table 76 Acquisition
List of Figures (61 Figures)
Figure 1 IoT Communication Protocol Market: Research Design
Figure 2 Market Size Estimation Methodology: Bottom–Up Approach
Figure 3 Market Size Estimation Methodology: Top-Down Approach
Figure 4 Data Triangulation
Figure 5 Consumer Electronics Held the Largest Market and Expected to Dominate During the Forecast Period
Figure 6 Wi–Fi Expected to Dominate the Market During Forecast Period
Figure 7 IoT Communication Protocol Market, Market Share (2015)
Figure 8 North America Expected to Lead the IoT Communication Protcol Market During Forecast Period
Figure 9 Growing Building Automation Industries and Wearable Devices Market Expected to Drive the Market During the Forecast Period
Figure 10 The Market in APAC Expected to Grow at the Highest Rate Between 2016 and 2022
Figure 11 North America Expected to Lead the IoT Communication Protocol Market During Forecast Period
Figure 12 Wi-Fi Technology to Hold the Largest Market During the Forecast Period
Figure 13 Market Segmentation
Figure 14 Growing Demand for Cloud-Based Applications and Increasing Internet Connectivity are the Driving Factors for the Market
Figure 15 Percentage of Households With Internet Access in Different Regions in 2015
Figure 16 Value Chain Analysis (2016)
Figure 17 Porter’s Five Forces Analysis
Figure 18 Porter’s Five Forces Analysis (2015): Impact Analysis for IoT Communication Protocol Market
Figure 19 IoT Communication Protocol Market: Threat From New Entrants
Figure 20 Market: Bargaining Power of Suppliers
Figure 21 Market: Threat of Substitute
Figure 22 Market: Bargaining Power of Buyers
Figure 23 IoT Communication Protocol Market: Intensity of Rivalry
Figure 24 Wi-Fi to Hold the Largest Market Share By 2022
Figure 25 Automotive & Transportation to Hold the Largest Market Share in Bluetooth Smart Technology By 2022
Figure 26 Automotive & Transportation to Hold the Largest Market Share of ZigBee Technology By 2022
Figure 27 Consumer Electronics to Hold the Largest Market Share of NFC Technology By 2022
Figure 28 Consumer Electronics to Hold the Largest Market Share of Cellular Technology By 2022
Figure 29 Wearable Devices Types
Figure 30 Body Wear Expected to Lead the Wearable Devices Market By 2022
Figure 31 Bluetooth Smart Expected to Lead the Healthcare Market By 2022
Figure 32 Wi–Fi Expected to Lead the Automotive & Transportation Market, By 2022
Figure 33 Building Automation Type
Figure 34 Three Key Elements in Industrial IoT
Figure 35 WHART Held the Largest Market in the Industrial Application in 2015
Figure 36 Wi–Fi Held the Largest Market of the Consumer Electronics End Use Application in 2015
Figure 37 Consumer Electronics Market
Figure 38 GNSS Expected to Lead the Precision Farming Market During Forecast Period
Figure 39 North America Expected to Lead the Market During Forecast Period
Figure 40 North America: IoT Communication Protocol Market Snapshot
Figure 41 Consumer Electronics Dominated the IoT Communication Protocol Market in North America
Figure 42 Europe: IoT Communication Protocol Market Snapshot
Figure 43 Consumer Electronics Held the Largest Market in Europe, 2015
Figure 44 APAC: IoT Communication Protocol Market Snapshot
Figure 45 Consumer Electronics to Hold Largest Market in APAC During Forecast Period
Figure 46 Building Automation Expected to Grow at the Highest CAGR During Forecast in RoW
Figure 47 Companies Mostly Adopted New Product Launches, New Product Developments,Collaboration and Partnerships as Key Growth Strategies Between 2015 and 2016
Figure 48 Geographic Revenue Mix of the Major Market Players
Figure 49 Ceva, Inc.: Company Snapshot
Figure 50 Ceva Inc.: SWOT Analysis
Figure 51 Synopsys, Inc.: Company Snapshot
Figure 52 Synopsys, Inc.: SWOT Analysis
Figure 53 NXP Semiconductors: Company Snapshot
Figure 54 NXP Semiconductors: SWOT Analysis
Figure 55 Stmicroelectronics N.V.: Company Snapshot
Figure 56 Stmicroelectronics N.V.: SWOT Analysis
Figure 57 Texas Instruments Inc.: Company Snapshot
Figure 58 Texas Instruments Inc.: SWOT Analysis
Figure 59 Mediatek Inc.: Business Overview
Figure 60 Atmel Corporation: Company Snapshot
Figure 61 Mindtree Ltd.: Company Snapshot
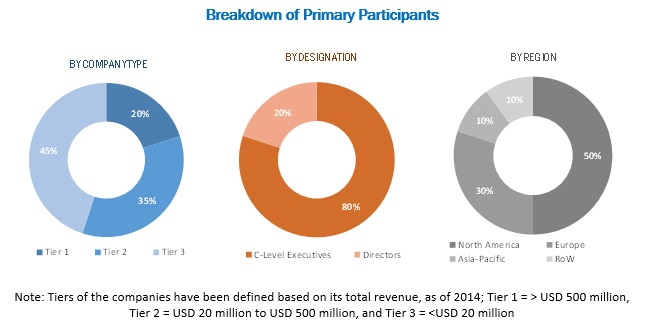
The research methodology used to estimate and forecast the IOT communication protocol market begins with capturing data on key vendor revenues through secondary research. The vendor offerings are also taken into consideration to determine the market segmentation. The bottom-up procedure was employed to arrive at the overall market size of the global market from the revenue of the key market players. After arriving at the overall market size, the total market was split into several segments and subsegments which were then verified through primary research by conducting extensive interviews with key people such as CEOs, VPs, directors, and executives. The data triangulation and market breakdown procedures were employed to complete the overall market engineering process and arrive at the exact statistics for all segments and subsegments. The breakdown of profiles of primary respondents is depicted in the figure below:
To know about the assumptions considered for the study, download the pdf brochure
This report provides valuable insights into ecosystem of this market including connectivity IP provider and connectivity solution provider companies. The key players to this market includes companies such as STMicroelectronics N.V. (Switzerland), NXP Semiconductors N.V. (Netherlands), Synopsys, Inc. (US), CEVA, Inc. (US), and Texas Instruments, Inc. (US) among others.
Key Target Audience
- Raw material and manufacturing equipment suppliers
- Semiconductor wafer vendors
- Fabless players
- Electronic design automation (EDA) and intellectual property (IP) core vendors
- Foundry players
- Original equipment manufacturers (OEMs) (end-user applications or electronic product manufacturers)
- Original design manufacturers (ODM) and OEM technology solution providers
- Research organizations
- Technology standard organizations, forums, alliances, and associations
- Technology investors
- Operating system (OS) vendors
- Content providers
- Software providers
Major Market Developments
- In January 2016, NXP semiconductor introduced the power efficient Bluetooth Low Energy (BLE) System-on-a-Chip (SoC) solution. This new chip is 40 percent more energy efficient than its closest competitor and can deliver an unprecedented 2X times longer battery life for wearable and fitness tracking devices.
- In February 2016, CEVA, Inc. introduced Dragonfly reference platform to accelerate the design of low-data-rate machine-to-machine (M2M) and IoT communication applications, including standalone wearables, smart grid, surveillance systems, asset tracking, remote monitoring systems, connected cars and smart utilities. The platform supports existing and emerging LTE MTC releases, LPWAN standards (e.g. LoRa, SiGFox, Ingenu), in addition to Wi-Fi, GPS or any other IoT-related communications standard set to be deployed for M2M communication.
- In December 2015, NXP semiconductor launched LPC43S67-A70CM Cloud Connectivity Kit designed to significantly reduce time-to-market for deploying IoT products. The kit help designers bridge the gap between un-connected embedded products to cloud-connected products without the need for deep expertise in security, Wi-Fi stacks, device commissioning, and cloud service APIs.
Scope of the Report:
The research report segments the IOT communication protocol market into the following submarkets:
By Connectivity Technology:
- Wi–Fi
- Bluetooth
- ZigBee
- NFC
- Cellular
- GNSS
- Bluetooth Smart
- EnOcean
- Ant+
- WHART
- Wi–Fi/Bluetooth Smart
- Bluetooth Smart/Ant+
-
Others
- ISA 100
- Z-wave
- Thread
By End-Use Application:
- Wearable Devices
- Healthcare
- Automotive & Transportation
- Building Automation
- Industrial
- Consumer Electronics
- Precision Farming
By Geography:
- North America
- Europe
- APAC
- RoW
Critical questions which the report answers
- What are new application areas which the IOT technology companies are exploring?
- Which are the key players in the market and how intense is the competition?
Available Customizations:
- Detailed analysis and profiling of additional market players (upto five)
- Further breakdown of North America IoT communication protocol market into the U.S., Canada, and Mexico
- Further breakdown of European IoT communication protocol market into France, U.K., Italy, and Germany and rest of Europe.
- Further breakdown of Asia-Pacific IoT communication protocol market into, Australia, Singapore and rest of APAC.


Growth opportunities and latent adjacency in IoT Communication Protocol Market