Interactive Voice Response Market by Technology (Touch-Tone and Speech), Deployment (Cloud and on Premise), Vertical (BFSI, Pharma and Healthcare, ITES), Organization Size, Solution, Service, And Geography - Global Forecast to 2023


The interactive voice response (IVR) market was valued at USD 3.44 Billion in 2016 and is expected to reach USD 5.54 Billion by 2023, at a CAGR of 6.83% during the forecast period. The base year considered for the study is 2016 and the forecast period is between 2017 and 2023.
Objectives of the Study:
- Define, describe, and forecast the interactive voice response market, in terms of value, segmented on the basis of technology, deployment mode, solution, organization size, service, vertical, and geography
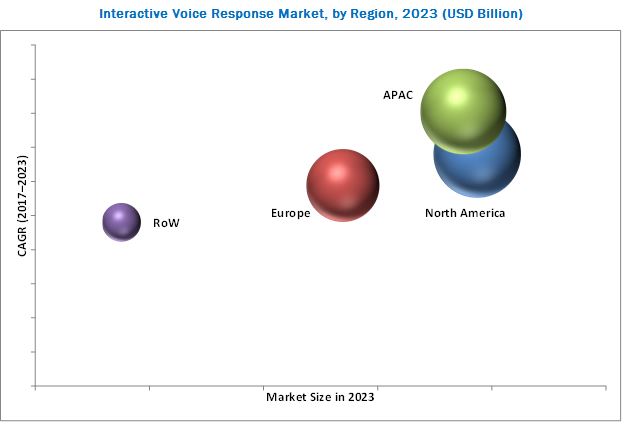
- Forecast the market size, in terms of value, for various segments with regard to four main regions—North America, Europe, Asia Pacific (APAC), and Rest of the World (RoW)
- Provide detailed information regarding the major factors influencing the growth of the interactive voice response market (drivers, restraints, opportunities, and industry-specific challenges)
- Analyze micromarkets with respect to individual growth trends, prospects, and contribution to the overall market
- Provide a detailed overview of the value chain of the market
- Analyze opportunities for various stakeholders by identifying the high-growth segments of the market
- Profile key players and comprehensively analyze their market position in terms of ranking and core competencies, along with detailing the competitive landscape for the market leaders
- Analyze competitive developments such as partnerships and joint ventures, mergers and acquisitions, product developments, expansions, and research and development (R&D) in the market
- Benchmark players within the market using the proprietary "Competitive Leadership Mapping" framework, which analyzes the market players on various parameters within the broad categories of business strategy excellence and strength of product portfolio
The overall interactive voice response market is projected to exhibit a lucrative growth potential between 2017 and 2023. The interactive voice response (IVR) market was valued at USD 3.73 Billion in 2017 and is expected to reach USD 5.54 Billion by 2023, at a CAGR of 6.83% during the forecast period. The growth of the IVR market is attributed to the increasing integration of advanced technologies and rise in the cloud-based services that meet the industry standards for the IVR systems.
The report covers the interactive voice response market on the basis of deployment mode, technology, organization size, vertical, solution, services, and geography. The market, by vertical, has been segmented into BFSI; travel and hospitality; pharma and healthcare; telecommunications; government and public sector; transportation and logistics; ITES; media, retail, and e-commerce; education; and others. BFSI accounted for the largest share of the IVR market in 2016. The enormous growth in IT investments in the banking and financial sector has helped the growth of IVR applications around the globe. The companies are generating more revenue due to the implementation of IVRs that resolves the customer’s queries and fulfills their requests continuously regardless of the time or place. This helps in resolving the customer queries without the need for a live agent, thereby reducing the cost.
The major share of the IVR market was held by the small and medium enterprises (SMEs), which are using IVRs to increase their solution offerings such as call routing and outbound solutions. Moreover, the major share was occupied by the touch-tone-based technology; however, growth is expected to be witnessed by the speech-based technology as it allow integration of speech recognition, which is being largely leveraged by the BFSI; pharma and healthcare; government and public sector; and media, retail, and e-commerce verticals.
North America contributed significantly to the growth of the overall interactive voice response market in 2016. However, the IVR market in Asia Pacific (APAC) is expected to grow at the highest CAGR during the forecast period owing to the rising number of new small and medium enterprises (SMEs) and large enterprises in this region. The presence of a huge end-user base in advanced economies such as Japan and South Korea, and the growing demand for enhanced customer service and a higher level of customer interaction is also expected to fuel the growth of the IVR market in this region.
Currently, most of the IVRs are designed to accommodate an extensive range of options within the menu, which further leads to unsatisfied customers, thereby hampering the image of an enterprise. Moreover, the multiple options to choose from a menu leads to a considerably higher level of frustration among the callers due to longer wait times. Customers prefer to talk to the customer service person directly instead of talking to a machine. Therefore, the complexity of the IVRs due to the presence of multiple irrelevant options is one of the restraining factors in the market.
In 2016, the interactive voice response market was led by 8X8, Inc. (US), Nuance Communications, Inc. (US), Convergys Corporation (US), Avaya Inc. (US), Cisco Systems, Inc. (US), AT&T Inc. (US), West Corporation (US), Genesys Telecommunication Laboratories, Inc. (US), Verizon Communications Inc. (US), IVR Lab (US), Aspect Software Parent Inc. (US), 24/7 Customer, Inc. (US), inContact Inc. (US), NewVoiceMedia (UK), and Five9, Inc. (US).
To speak to our analyst for a discussion on the above findings, click Speak to Analyst
 Exclusive indicates content/data unique to MarketsandMarkets and not available with any competitors.
Table of Contents
1 Introduction (Page No. - 15)
1.1 Study Objectives
1.2 Market Definition
1.3 Scope
1.3.1 Geographic Scope
1.3.2 Years Considered for the Study
1.4 Currency
1.5 Limitations
1.6 Stakeholders
2 Research Methodology (Page No. - 18)
2.1 Research Data
2.1.1 Secondary Data
2.1.1.1 Key Data From Secondary Sources
2.1.2 Primary Data
2.1.2.1 Key Data From Primary Sources
2.1.2.2 Key Industry Insights
2.1.2.3 Breakdown of Primaries
2.2 Market Size Estimation
2.2.1 Bottom-Up Approach
2.2.2 Top-Down Approach
2.3 Market Breakdown and Data Triangulation
2.4 Research Assumptions
3 Executive Summary (Page No. - 26)
4 Premium Insights (Page No. - 32)
4.1 Attractive Growth Opportunities in Interactive Voice Response Market
4.2 Market, By Organization Size
4.3 Market, By Service and Region
4.4 Market, By Deployment Mode
4.5 Market, By Geography
5 Market Overview (Page No. - 35)
5.1 Introduction
5.2 Market Dynamics
5.2.1 Drivers
5.2.1.1 Increasing Integration of Advanced Technologies
5.2.1.2 Rise in Cloud-Based Services Equipped With High Industry Standards Increases IVR Acceptability
5.2.1.3 Adoption of IVRs to Increase Scalability and Efficiency of Organizations
5.2.2 Restraints
5.2.2.1 Irrelevant Options and Additional Information Within A Menu Hampers the Usability of IVRs
5.2.3 Opportunities
5.2.3.1 Growing IVR Application Areas
5.2.3.2 Increasing Demand for IVR-Based Outbound Services
5.2.4 Challenges
5.2.4.1 Increasing Security Concerns in Data Encryption
6 Industry Trends (Page No. - 41)
6.1 Introduction
6.2 Value Chain Analysis
6.3 Interactive Voice Response Standards and Regulations
6.3.1 Codes and Standards Related to Interactive Voice Response
7 Interactive Voice Response Market, By Technology (Page No. - 44)
7.1 Introduction
7.2 Speech Based
7.3 Touch-Tone Based
8 Interactive Voice Response Market, By Deployment Mode (Page No. - 49)
8.1 Introduction
8.2 Cloud
8.2.1 Hosted
8.3 on Premise
9 Interactive Voice Response Market, By Organization Size (Page No. - 53)
9.1 Introduction
9.2 Small and Medium Enterprises (SMEs)
9.3 Large Enterprises
10 Interactive Voice Response Market, By Service (Page No. - 57)
10.1 Introduction
10.2 Installation
10.3 Training and Education
10.4 Maintenance and Support
11 Interactive Voice Response Market, By Vertical (Page No. - 60)
11.1 Introduction
11.2 BFSI
11.3 Travel and Hospitality
11.4 Pharma and Healthcare
11.5 Telecommunications
11.6 Government and Public Sector
11.7 Transportation and Logistics
11.8 Information Technology-Enabled Services
11.9 Media, Retail, and E-Commerce
11.10 Education
11.11 Others
12 Interactive Voice Response Market, By Solution (Page No. - 79)
12.1 Introduction
12.2 Call Routing
12.3 Outbound
12.4 Self-Service
13 Geographic Analysis (Page No. - 81)
13.1 Introduction
13.2 North America
13.2.1 US
13.2.2 Canada
13.2.3 Mexico
13.3 Europe
13.3.1 UK
13.3.2 Germany
13.3.3 Italy
13.3.4 France
13.3.5 Rest of Europe
13.4 Asia Pacific
13.4.1 Japan
13.4.2 China
13.4.3 India
13.4.4 Philippines
13.4.5 South Korea
13.4.6 Rest of APAC
13.5 Rest of the World
13.5.1 South America
13.5.2 Middle East and Africa
14 Competitive Landscape (Page No. - 106)
14.1 Overview
14.2 Market Ranking Analysis: Interactive Voice Response
14.3 Competitive Leadership Mapping
14.3.1 Visionary Leaders
14.3.2 Dynamic Differentiators
14.3.3 Innovators
14.3.4 Emerging Companies
14.4 Business Strategy Excellence
14.5 Strength of Product Portfolio
25 Companies analyzed across the ecosystem are — 8X8, Inc. (US), Nuance Communications, Inc. (US), Convergys Corporation (US), Avaya Inc. (US), Cisco Systems, Inc. (US), AT&T Inc. (US), West Corporation (US), Genesys Telecommunication Laboratories, Inc. (US), Verizon Communications Inc. (US), IVR Lab (US), Aspect Software Parent Inc. (US), 24/7 Customer, Inc. (US), inContact Inc. (US), NewVoiceMedia (UK), Five9, Inc. (US), Enghouse Systems (US), BCE Inc. (Canada), Verint Systems Inc (US), NEC Corporation (Japan), XO Communications, LLC (US), CenturyLink (US), DialogTech (US), DiRAD Technologies, Inc. (US), Solutions Infini (India), and Arise Virtual Solutions (US).
14.6 Competitive Situations and Trends
14.6.1 Product Launches and Developments
14.6.2 Partnerships and Agreements
14.6.3 Mergers and Acquisitions
14.6.4 Others
15 Company Profiles (Page No. - 119)
15.1 Introduction
(Business Overview, Products Offered & Services Strategies, Key Insights, Recent Developments)*
15.2 inContact Inc.
15.3 Nuance Communications, Inc.
15.4 Genesys Telecommunication Laboratories, Inc.
15.5 8x8, Inc.
15.6 AT&T Inc.
15.7 Avaya Inc.
15.8 Aspect Software Parent, Inc.
15.9 24/7 Customer, Inc.
15.10 Verizon Communications Inc.
15.11 Five9, Inc.
15.12 Cisco Systems, Inc.
15.13 Convergys Corporation
15.14 West Corporation
15.15 IVR Lab
15.16 NewVoiceMedia
15.17 Key Innovators
15.17.1 Liveops, Inc.
15.17.2 Ozonetel Communications Pvt. Ltd.
15.17.3 Evolve Ip, LLC
*Details on Business Overview, Products Offered & Services Strategies, Key Insights, Recent Developments, MnM View Might Not Be Captured in Case of Unlisted Companies.
16 Appendix (Page No. - 169)
16.1 Insights of Industry Experts
16.2 Questionnaire for Market
16.3 Knowledge Store: Marketsandmarkets’ Subscription Portal
16.4 Introducing RT: Real-Time Market Intelligence
16.5 Available Customizations
16.6 Related Reports
16.7 Author Details
List of Tables (68 Tables)
Table 1 Interactive Voice Response Market, By Technology, 2015–2023 (USD Million)
Table 2 IVR Market for Speech-Based Technology, By Vertical, 2015–2023 (USD Million)
Table 3 IVR Market for Touch-Tone-Based Technology, By Vertical, 2015–2023 (USD Million)
Table 4 Market, By Deployment Mode, 2015–2023 (USD Million)
Table 5 Market, By Organization Size
Table 6 Market, By Organization Size, 2015–2023 (USD Million)
Table 7 Market for SMEs, By Region, 2015–2023 (USD Million)
Table 8 Market for Large Enterprises, By Region, 2015–2023 (USD Million)
Table 9 Market, By Service, 2015–2023 (USD Million)
Table 10 Market, By Vertical, 2015–2023 (USD Million)
Table 11 Market for BFSI, By Technology, 2015–2023 (USD Million)
Table 12 Market in BFSI, By Region, 2015–2023 (USD Million)
Table 13 Market in Travel and Hospitality, By Technology, 2015–2023 (USD Million)
Table 14 for Travel and Hospitality, By Region, 2015–2023 (USD Million)
Table 15 Market for Pharma and Healthcare, By Technology, 2015–2023 (USD Million)
Table 16 Market for Pharma and Healthcare, By Region, 2015–2023 (USD Million)
Table 17 Market for Telecommunications, By Technology, 2015–2023 (USD Million)
Table 18 Market for Telecommunications, By Region, 2015–2023 (USD Million)
Table 19 Market for Government and Public Sector, By Technology, 2015–2023 (USD Million)
Table 20 Market for Government and Public Sector, By Region, 2015–2023 (USD Million)
Table 21 Market for Transportation and Logistics, By Technology, 2015–2023 (USD Million)
Table 22 Market for Transportation and Logistics, By Region, 2015–2023 (USD Million)
Table 23 Market for Ites, By Technology, 2015–2023 (USD Million)
Table 24 Market for Ites, By Region, 2015–2023 (USD Million)
Table 25 Market for Media, Retail, and E-Commerce, By Technology, 2015–2023 (USD Million)
Table 26 Market for Media, Retail, and E-Commerce, By Region, 2015–2023 (USD Million)
Table 27 Market for Education, By Technology, 2015–2023 (USD Million)
Table 28 Market for Education, By Region, 2015–2023 (USD Million)
Table 29 Market for Others, By Technology, 2015–2023 (USD Million)
Table 30 Market for Others, By Region, 2015–2023 (USD Million)
Table 31 Market, By Region, 2015–2023 (USD Million)
Table 32 Market in North America, By Vertical, 2016–2023 (USD Million)
Table 33 Market in North America, By Deployment Mode, 2015–2023 (USD Million)
Table 34 Market in North America, By Organization Size, 2015–2023 (USD Million)
Table 35 Market in North America, By Country, 2015–2023 (USD Million)
Table 36 Market in US, By Organization Size, 2015–2023 (USD Million)
Table 37 Market in Canada, By Organization Size, 2015–2023 (USD Million)
Table 38 Market in Mexico, By Organization Size, 2015–2023 (USD Million)
Table 39 Market in Europe, By Vertical, 2015–2023 (USD Million)
Table 40 Market in Europe, By Deployment Mode, 2015–2023 (USD Million)
Table 41 Market in Europe, By Organization Size, 2015–2023 (USD Million)
Table 42 Market in Europe, By Country, 2015–2023 (USD Million)
Table 43 Market in UK, By Organization Size, 2015–2023 (USD Million)
Table 44 Market in Germany, By Organization Size, 2015–2023 (USD Million)
Table 45 Market in Italy, By Organization Size, 2015–2023 (USD Million)
Table 46 Market in France, By Organization Size, 2015–2023 (USD Million)
Table 47 Market in RoE, By Organization Size, 2015–2023 (USD Million)
Table 48 Market in APAC, By Vertical, 2015–2023 (USD Million)
Table 49 Market in APAC, By Deployment Mode, 2015–2023 (USD Million)
Table 50 Market in APAC, By Organization Size, 2015–2023 (USD Million)
Table 51 Market in APAC, By Country, 2015–2023 (USD Million)
Table 52 Market in Japan, By Organization Size, 2015–2023 (USD Million)
Table 53 Market in China, By Organization Size, 2015–2023 (USD Million)
Table 54 Market in India, By Organization Size, 2015–2023 (USD Million)
Table 55 Market in Philippines, By Organization Size, 2015–2023 (USD Million)
Table 56 Market in South Korea, By Organization Size, 2015–2023 (USD Million)
Table 57 Market in RoAPAC, By Organization Size, 2015–2023 (USD Million)
Table 58 Market in RoW, By Vertical, 2015–2023 (USD Million)
Table 59 Market in RoW, By Deployment Mode, 2015–2023 (USD Million)
Table 60 Market in RoW, By Organization Size, 2015–2023 (USD Million)
Table 61 Market in RoW, By Region, 2015–2023 (USD Million)
Table 62 Market in South America, By Organization Size, 2015–2023 (USD Million)
Table 63 Market in Mea, By Organization Size, 2015–2023 (USD Million)
Table 64 Market: Company Ranking Analysis
Table 65 Product Launches and Developments (2015 – 2017)
Table 66 Partnerships and Agreements (2015–2017)
Table 67 Mergers and Acquisitions (2015 & 2017)
Table 68 Collaborations and Expansions (2017)
List of Figures (52 Figures)
Figure 1 Interactive Voice Response Market Segmentation
Figure 2 Market: Research Design
Figure 3 Market Size Estimation Methodology: Bottom-Up Approach
Figure 4 Market Size Estimation Methodology: Top-Down Approach
Figure 5 Data Triangulation
Figure 6 Snapshot of the Market, 2015-2023 (USD Billion)
Figure 7 BFSI Vertical to Hold the Largest Share of IVR Market During Forecast Period
Figure 8 Cloud-Based Deployment Mode to Hold A Larger Share in Comparison With on Premise By 2023
Figure 9 Touch-Tone Based to Hold Larger Share of Overall IVR Market By 2023
Figure 10 Overall Market, By Country, 2017
Figure 11 Market in APAC to Grow at Highest CAGR During the Forecast Period
Figure 12 SME to Lead Market During the Forecast Period
Figure 13 Maintenance and Support to Hold Largest Share of Market in North America in 2017
Figure 14 Cloud to Hold Larger Share of Market By 2023
Figure 15 Philippines Expected to Grow at Highest CAGR in Market During Forecast Period
Figure 16 Increasing Investments in IoT Technology and Growing Applications of Smart Wireless Sensors Fuel Growth of Market
Figure 17 Value Chain Analysis of Interactive Voice Response (IVR) Market
Figure 18 Market Segmentation, By Technology
Figure 19 Interactive Voice Response (IVR) Market, By Technology, 2017 & 2023
Figure 20 Market Segmentation, By Deployment Mode
Figure 21 Market, By Deployment Mode, 2017 & 2023
Figure 22 Small and Medium Enterprises to Hold Largest Share of Market During Forecast Period, 2017 & 2023
Figure 23 Market Segmentation, By Service
Figure 24 Market, By Vertical
Figure 25 North America Held Largest Share of Market for BFSI in 2017
Figure 26 APAC to Hold Share of Market for Travel and Hospitality By 2023
Figure 27 North America to Hold Largest Share of Market for Pharma and Healthcare By 2023
Figure 28 APAC to Hold Largest Share of Market for Telecommunications By 2023
Figure 29 North America to Hold Largest Share of Market for Government and Public Sector By 2023
Figure 30 APAC to Hold Largest Share of Market for Transportation and Logistics By 2023
Figure 31 APAC to Hold Largest Share of Market for Ites By 2023
Figure 32 APAC to Hold Largest Share of Market for Media, Retail, and E-Commerce By 2023
Figure 33 North America to Hold Largest Share of Market for Education By 2023
Figure 34 North America Held Largest Share of Market for Other Verticals in 2017
Figure 35 Market Segmentation, By Solution
Figure 36 Market: APAC Would Be Fastest Growing Region Over Next Six Years
Figure 37 Snapshot of Market in North America
Figure 38 Snapshot of Market in Europe
Figure 39 Snapshot of Market in APAC
Figure 40 Market (Global): Competitive Leadership Mapping, 2017
Figure 41 Market Evolution Framework – Product Launches and Developments Were Key Strategies Adopted By Market Players
Figure 42 Battle for Market Share: Product Launches and Developments Were Key Growth Strategies
Figure 43 Nice Ltd.: Company Snapshot
Figure 44 Nuance Communications, Inc.: Company Snapshot
Figure 45 8x8, Inc.: Company Snapshot
Figure 46 AT&T Inc.: Company Snapshot
Figure 47 Avaya Inc.: Company Snapshot
Figure 48 Verizon Communications Inc.: Company Snapshot
Figure 49 Five9, Inc.: Company Snapshot
Figure 50 Cisco Systems, Inc.: Company Snapshot
Figure 51 Convergys Corporation: Company Snapshot
Figure 52 West Corporation: Company Snapshot
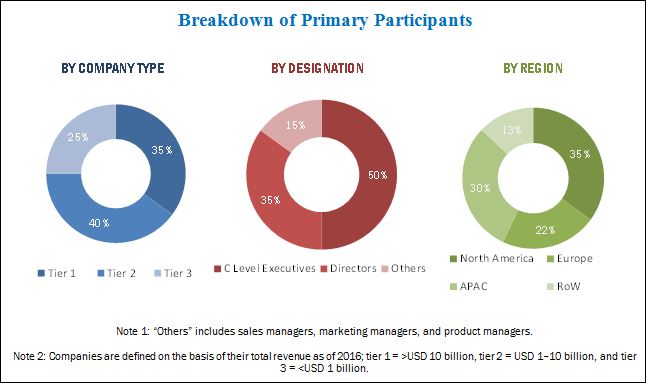
This research study incorporates the usage of secondary sources, directories, and databases, such as Hoovers, Bloomberg BusinessWeek, Factiva, and OneSource, to identify and collect information useful for the extensive technical, market-oriented, and commercial study of the interactive voice response market. Primary sources mainly comprise several experts from core and related industries, along with preferred suppliers, manufacturers, distributors, service providers, technology developers, alliances, standards, and certification organizations related to various parts of this industry’s value chain. In-depth interviews with various primary respondents, including key industry participants, subject matter experts (SMEs), C-level executives of key companies, and consultants, have been conducted to obtain and verify critical qualitative and quantitative information as well as assess prospects. The breakdown of the profiles of primaries has been depicted in the following figure:
To know about the assumptions considered for the study, download the pdf brochure
This report provides valuable insights into the ecosystem of the interactive voice response market. The major players profiled in this report include 8X8, Inc. (US), Nuance Communications, Inc. (US), Convergys Corporation (US), Avaya Inc. (US), Cisco Systems, Inc. (US), AT&T Inc. (US), West Corporation (US), Genesys Telecommunication Laboratories, Inc. (US), Verizon Communications Inc. (US), IVR Lab (US), Aspect Software Parent Inc. (US), 24/7 Customer, Inc. (US), inContact Inc. (US), NewVoiceMedia (UK), and Five9, Inc. (US)
Scope of the Report:
|
Report Metric |
Details |
|
Report Name |
Interactive Voice Response (IVR) Market |
|
Base year |
2016 |
|
Forecast period |
2017–2023 |
|
Units |
Value (USD) |
|
Segments covered |
Type, End User, Offerings, and Region |
|
Geographic regions covered |
North America, APAC, Europe, and RoW |
|
Companies covered |
8X8, Inc. (US), Nuance Communications, Inc. (US), Convergys Corporation (US), Avaya Inc. (US), Cisco Systems, Inc. (US), AT&T Inc. (US), West Corporation (US), Genesys Telecommunication Laboratories, Inc. (US), Verizon Communications Inc. (US), IVR Lab (US), Aspect Software Parent Inc. (US), 24/7 Customer, Inc. (US), inContact Inc. (US), NewVoiceMedia (UK), and Five9, Inc. (US) |
Key Target Audience:
- Raw material and manufacturing equipment suppliers
- Semiconductor foundries
- Original equipment manufacturers (OEMs) (application or electronic product manufacturers)
- Original design manufacturer (ODM) and OEM technology solution providers
- Small and large technology centers
- Interactive voice response systems manufacturing companies
- Research institutes or organizations
- Market research and consulting firms
- IVR forums, alliances, and associations
- Software companies that provide solutions for various industries that use IVRs
- Manufacturers and suppliers of displays
- Manufacturers and suppliers of media players, mounts, and other accessories
- Research institutes and organizations
- Government bodies, venture capitalists, and private equity firms
Scope of the Report:
The research report segments the interactive voice response market into the following subsegments:
Broadcast Equipment Market, by Technology
- Speech Based
- Touch-tone Based
Broadcast Equipment Market, by Deployment Mode
- Cloud
- On Premise
Broadcast Equipment Market, by Organization Size
- Small and Medium Enterprise (SME)
- Large Enterprise
Broadcast Equipment Market, by Services
- Installation
- Training & Education
- Maintenance & Support
Broadcast Equipment Market, by Vertical
- BFSI
- Travel and Hospitality
- Pharma and Healthcare
- Telecommunications
- Government and Public Sector
- Transportation and Logistics
- ITES
- Media, Retail, and E-commerce
- Education
- Others
Broadcast Equipment Market, by Solution
- Call Routing
- Outbound
- Self-Service
Broadcast Equipment Market, by Geography
- North America
- Europe
- Asia Pacific (APAC)
- Rest of the World (RoW)
Available Customizations:
With the given market data, MarketsandMarkets offers customizations according to the companies’ specific needs. The following customization options are available for the report.
-
- Company Information
- Detailed analysis and profiling of additional market players (up to five)


Growth opportunities and latent adjacency in Interactive Voice Response Market