Hydraulic Power Unit Market by Applications (Mobile, Industrial & Others), Operating pressure, (pSI), (<750, 750-2000, 2000-3000, >3000), & by Region (APAC, North America, Latin America, Europe, the Middle East & Africa) - Global Trends & Forecast to 2019


This report estimates the hydraulic power unit market in terms of value in $million. This has been broken down into regions, and further split into countries.
The construction and agricultural industry witness a large number of construction activities every year, which is undertaken to provide better living standards. HPU is the main component of hydraulic systems producing enormous amount of power, driving various hydraulic rams and equipment. Furthermore, various international events such as the World Expo in Dubai in 2020 and FIFA World Cup in Qatar in 2022, which will be hosted by the Middle East countries, has resulted in the surge for the demand of construction equipment in the region, acting as a catalyst for the hydraulic power unit market.
The size of the overall market has been determined by forecast techniques, based on region-wise demand for equipment such as excavators, loaders, and threshers. The market is expected to grow at a CAGR of approximately 5.6 % from 2014 to 2019.
This report also includes the profiles of leading equipment manufacturers, namely Bosch Rexroth AG (Lohr a. Main, Germany); Parker Hannifin Corporation (Ohio, U.S.); Nachi-Fujikoshi Corporation (Tokyo, Japan); Brevini Fluid Power S.p.A (Milan, Italy); and Hydac International GmbH (Sulbach, Germany), Weber Hydraulik GmbH (G�glingen, Germany).
Scope of the report: This study estimates the global HPU market in terms of application and operating pressure till 2019. It also offers a detailed qualitative and quantitative analysis of this market. This report provides a comprehensive review of major market drivers, restraints, opportunities, challenges, winning imperatives, and key issues of the market. It also covers various important aspects of the market. These include analysis of value chain, Porter�s Five Forces model, competitive landscape, market dynamics, market estimates in terms of value, and future trends in the hydraulic power unit market.
Various secondary sources such as encyclopedias, directories, and databases have been used to identify and collect information that was useful for this extensive commercial study of the global HPU market. Primary sources, experts, manufacturers, and service providers from the industry, have been interviewed to obtain and verify critical information as well as assess future prospects of the global hydraulic power unit market.
On the basis of application: mobile, industrial, and others
On the basis of operating pressure: <750 PSI, 750-200 psi, 2000-3000 psi, & >3000 PSI
On the basis of region: North America, Europe, Latin America, Asia-Pacific, and the Middle-East & Africa
Increasing population and better living standards in developing countries have led to a surge in energy and infrastructural demands. The total world population was 7.3 Billion in 2014, and is expected to grow at a rate of 1.14% per year. Emerging economies such as China, India, and Brazil are trying to develop infrastructure to provide their people the basic amenities. This is likely to boost the construction market of these countries, thereby augmenting the Hydraulic Power Unit Market (HPU) in the region. Asia-Pacific held the largest share of approximately 34% in 2013, followed by North America, which held 22% of the total market share in the same year, and is expected to grow at a CAGR of 4.3% during the forecast period. The hydraulic power unit market is estimated to reach $6.0 Billion at a CAGR of 5.6% from 2014 to 2019.
The HPU is an integrated package comprising hydraulic motor, hydraulic pump, and reservoir/accumulators along with other accessories such as valves, tubes, filter, regulators, and instruments to monitor the performance of the unit. It is used to transmit, control, and distribute energy from a pressurized fluid to perform various mechanical tasks. It is the main component of hydraulic systems producing enormous amount of power, driving various hydraulic rams and equipment. The applications of HPU are wide and varied; they are used in various applications such as presses, machine tools, Computerized Numerical Control (CNC), saws, and lifts among others. Construction, agriculture, truck& bus, and industrial machineries such as machining tools, saws, and (CNC) are the major end-users of Hydraulic Power Unit (HPU). These are also used in construction equipment such as fork lifters, crushers, cranes, and excavators among others. Each region has been analyzed with respect to its market trends, growth, and future prospects, in terms of the HPU market. This report basically aims to estimate the global market for hydraulic power unit from 2014 to 2019.
Potential growth of the manufacturing business in countries such as Mexico, Germany, and China has led to an increase in the HPU market. The demand for Hydraulic Power Unit (HPU) is high in developing countries such as Indonesia and China due to an increase in construction activities in the region. In addition hydraulic power unit is installed in both mobile and industrial applications.
Asia-Pacific is the largest and fastest growing market for HPUs, owing to increased construction activities. The Middle East is also one of the attractive markets for HPUs due to construction activities taking place in the region for upcoming international events.
HPU Market Share (Value), by Application, 2019
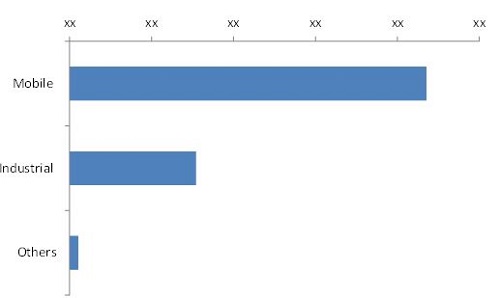
Currently, the mobile application dominates the Hydraulic Power Unit Market (HPU) mainly due to continuous and large increment in the U.S. construction and industrial production activities. Industrial applications, such as the usage of HPU in hydraulic presses, for the purpose of stamping in the automotive industry, forming, wind turbine, solar panel, and others occupy the second largest market; this application is expected to witness a moderate growth rate during the forecast period.
 Exclusive indicates content/data unique to MarketsandMarkets and not available with any competitors.
Table of Contents
1 Introduction (Page No. - 13)
1.1 Objectives of the Study
1.2 Market Definition
1.2.1 Industrial Application
1.2.2 Mobile Application
1.2.3 Other Application
1.3 Study Scope
1.3.1 Markets Covered
1.3.2 Years Considered for the Study
1.4 Currency
1.5 Limitations
1.6 Stakeholders
2 Research Methodology (Page No. - 17)
2.1 Research Data
2.1.1 Secondary Data
2.1.1.1 Key Data From Secondary Sources
2.1.2 Primary Data
2.1.2.1 Breakdown of Primary Interviews
2.1.2.2 Key Insights of Industry Experts
2.2 Factor Analysis
2.2.1 Introduction
2.2.2 Demand Side Analysis
2.2.3 Supply Side Analysis
2.3 Market Size Estimation
2.4 Market Breakdown & Data Triangulation
2.5 Research Assumptions
2.5.1 Assumptions
3 Executive Summary (Page No. - 28)
4 Premium Insights (Page No. - 33)
4.1 Attractive Market Opportunities in the Hydraulic Power Unit Market
4.2 HPU Market- Top Application Segment
4.3 HPU Market in North America
4.4 Asia-Pacific Dominates the Hydraulic Power Unit Market
4.5 Mobile Application
4.6 HPU Market: Developed vs. Developing Nations
5 Market Overview (Page No. - 40)
5.1 Introduction
5.2 By Application
5.2.1 Industrial Application
5.2.2 Mobile Application
5.2.3 Other Application
5.3 Market Dynamics
5.3.1 Drivers
5.3.1.1 Increased Spending in Industrial Activities
5.3.1.2 Increase in Demand for Agricultural Products
5.3.2 Restraint
5.3.2.1 Alternatives Such as Electro-Mechanical & Electric Drives Having Efficient, Cheap, & Shorter Lead Time
5.3.3 Opportunities
5.3.3.1 Increase in Defence Spending
5.3.3.2 Increased Spending in Automation/Automotive Industry
5.3.4 Challenge
5.3.4.1 Product Failures
5.4 Impact of Market Dynamics
6 Industry Trends (Page No. - 46)
6.1 Value Chain Analysis
6.2 Porter�s Five Forces Analysis
6.2.1 Threat of New Entrants
6.2.1.1 Common Technology
6.2.1.2 No Specific Assets Required
6.2.2 Threat of Substitutes
6.2.2.1 Availability of Similar Products
6.2.3 Bargaining Power of Suppliers
6.2.3.1 Lower Switching Costs
6.2.3.2 Non-Concentration of Suppliers
6.2.3.3 Product Not Critical
6.2.4 Bargaining Power of Buyers
6.2.4.1 Low Product Differentiation
6.2.4.2 Large Number of Suppliers
6.2.5 Intensity of Rivalry
6.2.5.1 Several Equally Sized Competitors
6.2.5.2 Lower Switching Cost for Buyers
7 HPU Market, By Pressure Rating (Page No. - 52)
7.1 Introduction
7.2 By Pressure Rating
7.2.1 0-750 PSI
7.2.2 750-2000 PSI
7.2.3 2000-3000 PSI
7.2.4 >3000 PSI
8 HPU Market, By Application (Page No. - 58)
8.1 Introduction
8.2 By Application
8.2.1 Mobile Market
8.2.1.1 North America
8.2.1.2 Asia-Pacific
8.2.1.3 Europe
8.2.1.4 South America
8.2.1.5 Africa
8.2.1.6 Middle East
8.2.2 Industrial Application
8.2.2.1 North America
8.2.2.2 Asia-Pacific
8.2.2.3 Europe
8.2.2.4 South America
8.2.2.5 Africa
8.2.2.6 Middle East
8.2.3 Other Applications
8.2.3.1 North America
8.2.3.2 Asia-Pacific
8.2.3.3 Europe
8.2.3.4 South America
8.2.3.5 Africa
8.2.3.6 Middle East
9 HPU Market, By Region (Page No. - 80)
9.1 Introduction
9.2 Regional Analysis
9.2.1 North America
9.2.1.1 U.S.
9.2.1.2 Canada
9.2.1.3 Mexico
9.2.1.4 By Application
9.2.2 Asia-Pacific
9.2.2.1 China
9.2.2.2 India
9.2.2.3 Japan
9.2.2.4 Rest of Asia-Pacific
9.2.2.5 By Application
9.2.3 Europe
9.2.3.1 Germany
9.2.3.2 France
9.2.3.3 U.K.
9.2.3.4 Rest of Europe
9.2.3.5 By Application
9.2.4 South America
9.2.4.1 Brazil
9.2.4.2 Argentina
9.2.4.3 Rest of South America
9.2.4.4 By Application
9.2.5 Africa
9.2.5.1 South Africa
9.2.5.2 Kenya
9.2.5.3 Rest of Africa
9.2.5.4 By Application
9.2.6 Middle East
9.2.6.1 UAE
9.2.6.2 Saudi Arabia
9.2.6.3 Qatar
9.2.6.4 Rest of Middle East
9.2.6.5 By Application
10 Competitive Landscape (Page No. - 115)
10.1 Overview
10.2 Market Share Analysis, By Key Players
10.3 Competitive Situation & Trends
10.3.1 New Product/Technology Launches
10.3.2 Mergers & Acquisitions
10.3.3 Expansions
10.3.4 Joint Ventures
11 Company Profiles (Page No. - 123)
(Company at A Glance, Recent Financials, Products & Services, Strategies & Insights, & Recent Developments)*
11.1 Introduction
11.2 Bosch Rexroth AG.
11.3 Eaton Corporation.
11.4 MTS Systems Corporation.
11.5 Nachi-Fujikoshi Corporation
11.6 Parker Hannifin Corporation
11.7 Bailey International LLC
11.8 Brevini Fluid Power SPA
11.9 Hydac International GmbH
11.10 Hydro-Tek Co Ltd.
11.11 Shanghai Mocen Fluid Power
11.12 Weber Hydraulik GmbH.
*Details on Company at A Glance, Recent Financials, Products & Services, Strategies & Insights, & Recent Developments Might Not Be Captured in Case of Unlisted Companies.
12 Appendix (Page No. - 148)
12.1 Insights From Industry Experts
12.2 Discussion Guide
12.3 Available Customizations
12.4 Introducing RT: Real Time Market Intelligence
12.5 Related Reports
List of Tables (66 Tables)
Table 1 Impact Analysis of Market Dynamics
Table 2 Hydraulic Power Unit Market Size, By Pressure Rating, 2012-2019 ($Million)
Table 3 0-750 PSI Market Size, By Region, 2012-2019 ($Million)
Table 4 750-2000 PSI Market Size, By Region, 2012-2019 ($Million)
Table 5 2000-3000 PSI Market Size, By Region, 2012-2019 ($Million)
Table 6 >3000 PSI Market Size, By Region, 2012-2019 ($Million)
Table 7 Hydraulic Power Unit Market Size, By Application, 2012-2019 ($Million)
Table 8 Mobile Market Size, By Region, 2012-2019 ($Million)
Table 9 North America: Mobile Market Size, By Country, 2012-2019 ($Million)
Table 10 Asia-Pacific: Mobile Market Size, By Country, 2012-2019 ($Million)
Table 11 Europe: Mobile Market Size, By Country, 2012-2019 ($Million)
Table 12 South America: Mobile Market Size, By Country, 2012-2019 ($Million)
Table 13 Africa: Mobile Market Size, By Country, 2012-2019 ($Million)
Table 14 Middle East: Mobile Market Size, By Country, 2012-2019 ($Million)
Table 15 Industrial Market Size, By Region, 2012-2019 ($Million)
Table 16 North America: Industrial Market Size, By Country, 2012-2019 ($Million)
Table 17 Asia-Pacific: Industrial Market Size, By Country, 2012-2019 ($Million)
Table 18 Europe: Industrial Market Size, By Country, 2012-2019 ($Million)
Table 19 South America: Industrial Market Size, By Country, 2012-2019, ($Million)
Table 20 Africa: Industrial Market Size, By Country, 2012-2019 ($Million)
Table 21 Middle East: Industrial Market Size, By Country, 2012-2019 ($Million)
Table 22 Others Market Size, By Region, 2012-2019 ($Million)
Table 23 North America: Others Market Size, By Country, 2012-2019 ($Million)
Table 24 Asia-Pacific: Others Market Size, By Country, 2012-2019 ($Million)
Table 25 Europe: Others Market Size, By Country, 2012-2019 ($Million)
Table 26 South America: Others Market Size, By Country, 2012-2019 ($Million)
Table 27 Africa: Others Market Size, By Country, 2012-2019 ($Million)
Table 28 Middle East: Others Market Size, By Country 2012-2019 ($Million)
Table 29 Hydraulic Power Unit Market Size, By Region, 2012-2019 ($Million)
Table 30 North America: HPU Market Size, By Country, 2012-2019 ($Million)
Table 31 U.S.: Hydraulic Power Unit Market Size, By Application, 2012-2019 ($Million)
Table 32 Canada: Hydraulic Power Unit Market Size, By Application, 2012-2019 ($Million)
Table 33 Mexico: Hydraulic Power Unit Market Size, By Application, 2012-2019 ($Million)
Table 34 North America: Hydraulic Power Unit Market Size, By Application, 2012-2019 ($Million)
Table 35 Asia-Pacific: Hydraulic Power Unit Market Size, By Country, 2012-2019 ($Million)
Table 36 China: Market Size, By Application, 2012-2019 ($Million)
Table 37 India: Market Size, By Application, 2012-2019 ($Million)
Table 38 Japan: Market Market Size, By Application, 2012-2019 ($Million)
Table 39 Rest of Asia-Pacific: HPU Market Size, By Application, 2012-2019 ($Million)
Table 40 Asia-Pacific: Market Size, By Application, 2012-2019, ($Million)
Table 41 Europe: Market Size, By Country, 2012-2019 ($Million)
Table 42 Germany: Market Size,, By Application, 2012-2019 ($Million)
Table 43 France: Market Size, By Application, 2012-2019 ($Million)
Table 44 U.K.: Market Size, By Application, 2012-2019 ($Million)
Table 45 Rest of Europe: Market Size, By Application, 2012-2019 ($Million)
Table 46 Europe: Market Size, By Application, 2012-2019 ($Million)
Table 47 South America: Market Size, By Country, 2012-2019 ($Million)
Table 48 Brazil: Market Size, By Application, 2012-2019 ($Million)
Table 49 Argentina: Market Size, By Application, 2012-2019 ($Million)
Table 50 Rest of South America: Market Size, By Application, 2012-2019 ($Million)
Table 51 South America: Hydraulic Power Unit Market Size, By Application, 2012-2019 ($Million)
Table 52 Africa: Hydraulic Power Unit Market Size, By Country, 2012-2019 ($Million)
Table 53 South Africa: Hydraulic Power Unit Market Size, By Application, 2012-2019 ($Million)
Table 54 Kenya: Hydraulic Power Unit Market Size, By Application, 2012-2019 ($Million)
Table 55 Rest of Africa: HPU Market Size, By Application, 2012-2019 ($Million)
Table 56 Africa: Hydraulic Power Unit Market Size, By Application, 2012-2019 ($Million)
Table 57 Middle East: HPU Market Size, By Country, 2012-2019 ($Million)
Table 58 UAE: Hydraulic Power Unit Market Size, By Application, 2012-2019 ($Million)
Table 59 Saudi Arabia: HPU Market Size, By Application, 2012-2019 ($Million)
Table 60 Qatar: HPU Market Size, By Application, 2012-2019 ($Million)
Table 61 Rest of Middle East: HPU Market Size, By Application, 2012-2019 ($Million)
Table 62 Middle East: Hydraulic Power Unit Market Size, By Application, 2012-2019 ($Million)
Table 63 New Product/Technology Launches, 2013-2015
Table 64 Mergers & Acquisitions, 2011-2014
Table 65 Expansion, 2013
Table 66 Joint Venture, 2014
List of Figures (42 Figures)
Figure 1 Markets Covered: HPU Market
Figure 2 HPU Market: Research Design
Figure 3 Breakdown of Primary Interviews: By Company Type, Designation, & Region
Figure 4 World Construction Output Growth Rates(%), 2005-2015
Figure 5 Market Size Estimation Methodology: Bottom-Up Approach
Figure 6 Market Size Estimation Methodology: Top-Down Approach
Figure 7 Market Breakdown & Data Triangulation
Figure 8 Asia-Pacific Occupied the Largest Market Share in 2013
Figure 9 Hydraulic Power Unit Market Snapshot (2014 vs. 2019): Asia-Pacific is Expected to Exhibit the Highest Growth Rate in the Next Five Years, (2014-2019)
Figure 10 HPU Market Share (Value), By Pressure Rating, 2014
Figure 11 Mobile Application Will Continue to Dominate the Hydraulic Power Unit Market in the Next Five Years, 2014-2019
Figure 12 Hydraulic Power Unit Market Size, 2014 & 2019 ($Million)
Figure 13 An Increase in Construction Activities Worldwide Would Boost the Hydraulic Power Unit Market
Figure 14 The Demand for the Mobile Application is Expected to Be the Highest in the Coming Five Years, 2014-2019
Figure 15 Mobile Application Accounted for the Maximum Share in the Hydraulic Power Unit Market Market in 2013
Figure 16 The Mobile Application in Africa is Expected to Hold the Largest Market Share By 2019 ($Million)
Figure 17 Asia-Pacific Commanded More Than One-Third of the Market in 2013
Figure 18 Mobile- Based Hydraulic Power Unit Occupied the Largest Market Share in Asia-Pacific, 2013
Figure 19 China is Expected to Show High Growth Potential in the Next Five Years, 2014-2019
Figure 20 Market Segmentation: By Type & Region
Figure 21 Rapid Industrialization is Driving the Hydraulic Power Unit Market
Figure 22 Value Chain Analysis: Major Value is Added During Manufacturing & Assembly Phase
Figure 23 Porter�s Five Forces Analysis: Hydraulic Power Unit Market
Figure 24 Pressure Rating >3000 PSI Market to Show the Highest Growth Rate During the Forecast Period
Figure 25 Mobile Application is Expected to Dominate the Hydraulic Power Unit Market During the Forecast Period
Figure 26 Geographic Snapshot �Developing Economies Emerging as New Hotspots
Figure 27 China - an Attractive Destination for All Product Categories
Figure 28 Companies Adopted New Product Launches & Mergers & Acquisitions as the Key Growth Strategies in the Past Four Years, 2011-2014
Figure 29 Hydraulic Power Unit Market, By Major Market Players, 2013
Figure 30 Market Evaluation Framework
Figure 31 Battle for Market Share: New Product Launches Was the Key Strategy
Figure 32 Geographic Revenue Mix of the Top Market Players
Figure 33 Bosch Rexroth AG: Company Snapshot
Figure 34 Bosch Rexroth AG: SWOT Analysis
Figure 35 Eaton Corporation: Company Snapshot
Figure 36 Eaton Corporation: SWOT Analysis
Figure 37 MTS Systems Corporation: Company Snapshot
Figure 38 MTS Systems Corporation: SWOT Analysis
Figure 39 Nachi-Fujikoshi Corporation: Company Snapshot
Figure 40 Nachi-Fujikoshi Corporation: SWOT Analysis
Figure 41 Parker Hannifin Corporation: Company Snapshot
Figure 42 Parker Hannifin Corporation: SWOT Analysis


Growth opportunities and latent adjacency in Hydraulic Power Unit Market