Grain Analysis Market by Grain Type (Cereals, Oilseeds, Pulses), Target Tested (Pathogens, Pesticides, GMO, Mycotoxins), Technology (Traditional, Rapid), End Use (Food, Feed), Component, and Region - Global Forecast to 2022


[150 Pages Report] The grain analysis market was valued at USD 1,665.8 Million in 2016 and is projected to reach 2,323.1 Million by 2022, at a CAGR of 5.8% during the forecast period. Increase in outbreak of foodborne illnesses, globalization in grain trade, and stringent safety and quality regulation for food & feed are the factors driving this market.
The years considered for the study are as follows:
- Base year � 2016
- Estimated year � 2017
- Projected year � 2022
- Forecast period � 2017 to 2022
The objectives of the report
- To define, segment, and forecast the size of the grain analysis market, by services on the basis of grain type, target tested, technology, end use, and region
- To define, segment, and forecast the size of the grain analysis market, by equipment on the basis of component
- To forecast the size of the global grain analysis market and its various submarkets with respect to four main regions, namely, North America, Asia Pacific, Europe, and the Rest of the World (RoW)
- To provide detailed information about crucial factors that are influencing the growth of the market (drivers, restraints, opportunities, industry-specific challenges)
- To analyze opportunities in the market for stakeholders and provide details of the competitive landscape for market leaders
- To strategically profile key players and comprehensively analyze their market share and core competencies
- To analyze competitive developments such as expansions, investment, acquisitions, and new service launches, new product launches, joint venture, collaboration, and other strategies in this market
Research Methodology:
- Major regions were identified, along with countries contributing the maximum share
- Secondary research was conducted to find the value of grain analysis for regions such as North America, Europe, Asia-Pacific, and RoW
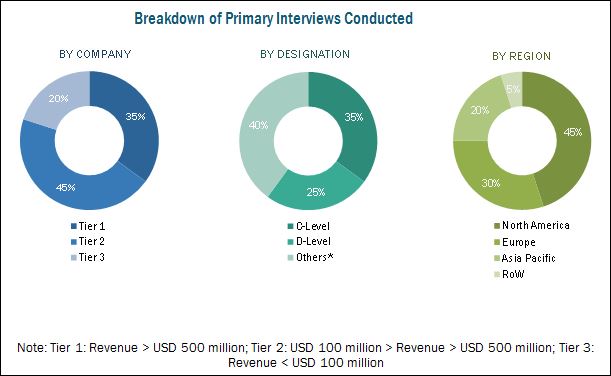
The key players have been identified through secondary sources such as the Food & Drug Administration (FDA), the United States Department of Agriculture (USDA), and the Canadian Food Inspection Agency (CFIA), while their market shares in respective regions have been determined through both, primary and secondary research. The research methodology includes the study of annual and financial reports of top market players, as well as interviews with industry experts (such as CEOs, VPs, directors, and marketing executives) for key insights (both quantitative and qualitative) for the food thickeners market.
To know about the assumptions considered for the study, download the pdf brochure
The various contributors involved in the value chain of grain analysis market include raw material suppliers, R&D institutes, grain analysis service providing companies as SGS SA (Switzerland), Bureau Veritas SA (France), Intertek Group plc (UK), Eurofins Scientific (Luxembourg), grain analysis equipment manufacturing companies such as Thermo Fisher Scientific, Inc. (US), Shimadzu Corporation (Japan), Waters Corporation (US), and government bodies & regulatory associations such as the United States Department of Agriculture (USDA), the Food and Drug Administration (FDA), and the European Food Safety Authority (EFSA).
Target Audience
The stakeholders for the report are as follows:
- Manufacturers, importers & exporters, traders, distributors, and suppliers of grain testing kits, equipment, reagents, chemicals, and other related consumables
- Grain analysis service providers
- Food processors
- Food manufacturers
- Grain producers, traders, and distributors
- Trade associations and industry bodies
- Government and research organizations
- Regulatory bodies such as Food and Drugs Organization (FDA), European Food Safety Authority (EFSA), Food Standards Australia New Zealand (FSANZ), and Food Safety Commission of Japan
Scope of the Report:
This research report categorizes the grain analysis market based on grain type, target tested, technology, end use, component, and region.
Based on Grain Type, the market has been segmented as follows:
- Cereals
- Oilseeds
- Pulses
Based on Target Tested, the market has been segmented as follows:
- Pathogens
- Pesticides
- GMOs
- Mycotoxin
- Others (Food allergen, heavy metals, and organic contaminants)
Based on Technology, the market has been segmented as follows:
- Traditional
- Rapid
Based on End Use, the market has been segmented as follows:
- Food
- Feed
Based on Component, the market has been segmented as follows:
- Instruments
- Consumables & reagents
- Reference materials
Based on Region, the market has been segmented as follows:
- North America
- Europe
- Asia Pacific
- RoW (South America, and the Middle East & Africa)
Available Customizations
With the given market data, MarketsandMarkets offers customizations according to client-specific scientific needs.
The following customization options are available for the report:
Segmental Analysis
- Segmental analysis, which provides further breakdown of the �Others� category in the target tested segment into food allergens, heavy metals, and organic contaminants
Geographic Analysis
- Further breakdown of the Rest of Asia Pacific grain testing market, by country
- Further breakdown of other countries in the RoW grain testing market, by key country
Company Information
- Detailed analyses and profiling of additional market players (up to five)
The grain analysis market is projected to reach 2,323.1 Million by 2022, at a CAGR of 5.8% from 2017 to 2022. The grain analysis market, by equipment, is projected to reach USD 761.7 Million in 2022 during the forecast period. The market is driven by increase in outbreak of foodborne illnesses, globalization in grain trade, and stringent safety and quality regulation for food & feed.
The grain analysis market, based on grain type, has been segmented into cereals, oilseeds, and pulses. The market for cereals dominated this market in 2016 and is also projected to be fastest-growing segment during the forecast period. This is attributable to their large-scale production and trade along with higher testing of pathogens, mycotoxins, GMOs, allergens, heavy metals, and other contaminants in this segment.
The grain analysis market, based on target tested, has been segmented into pathogens, pesticides, GMO, mycotoxins, and others. The mycotoxins segment dominated the grain testing services market in 2016, and is also the fastest-growing market during the forecast period. Mycotoxins are chemically stable at high temperatures, and therefore can travel all the way through the food supply chain causing various safety incidences due to which their occurrence in grains is most prevalent, thereby driving the market for mycotoxin testing.
The grain analysis market, by technology, has been segmented into traditional and rapid. The rapid technology segment dominated the market in 2016 and is projected to be the fastest growing by 2022. This is due to low turnaround time, higher accuracy, sensitivity, and ability to test a wide range of contaminants in comparison to traditional technology.
The grain analysis market, by end use, has been segmented into food and feed. The food segment dominated the market in 2016 and is projected to be the fastest growing by 2022. This is due to the increase in grain trade including import and export, their growing use as an ingredient in new food products, government efforts to ensure optimum nutrition in food, and complexities in the food supply chain have led to the rigorous testing of grains.
The grain analysis market, by component, has been segmented into instruments, consumables & reagents, and reference materials. This market was dominated by the instruments segment in 2016. The market for consumables & reagents is projected to be the fastest-growing during the forecast period.
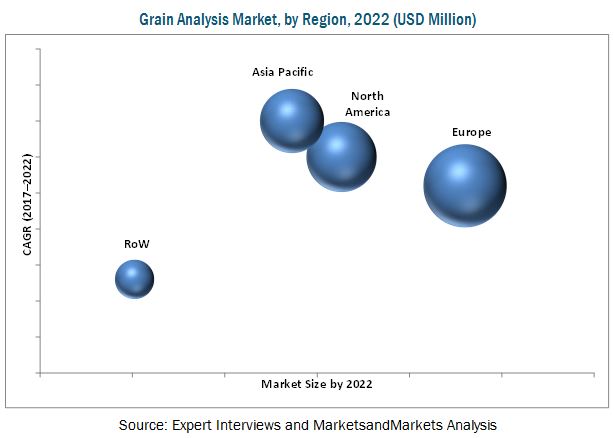
Europe accounted for the largest market share in the grain analysis market. The dominant share of the European region is attributed to stringent regulations in place to make sure that grains used in both food and feed are safe for human as well as animal consumption. Further, it has the highest number of testing laboratories among all other regions and tests the most number of grain samples. Asia Pacific is projected to be the fastest-growing region during the forecast period due to growing consumer awareness and increasing health consciousness coupled with growing investments by testing companies in the region.
Lack of coordination between market stakeholders and improper enforcement of regulatory laws & supporting infrastructure in developing economies are the major restraints for this market.
The global market for grain analysis is dominated by large-scale players including SGS SA (Switzerland), Bureau Veritas SA (France), Intertek Group plc (UK), Eurofins Scientific (Luxembourg), T�V S�D (Germany), T�V Nord Group (Germany), and ALS Limited (Australia). Neogen Corporation (US) and Romer Labs Division Holding GmbH (Austria) are the key market players that provide both services as well as equipment for the grain analysis market. Further, Thermo Fisher Scientific, Inc. (US), Shimadzu Corporation (Japan), Waters Corporation (US), and AB Sciex (US) are some key equipment providers in this market.
To speak to our analyst for a discussion on the above findings, click Speak to Analyst
 Exclusive indicates content/data unique to MarketsandMarkets and not available with any competitors.
Table of Contents
1 Introduction (Page No. - 15)
1.1 Objectives of the Study
1.2 Market Definition
1.3 Markets Covered
1.4 Years Considered for the Study
1.5 Currency
1.6 Stakeholders
2 Research Methodology (Page No. - 19)
2.1 Research Data
2.1.1 Secondary Data
2.1.1.1 Key Data From Secondary Sources
2.1.2 Primary Data
2.1.2.1 Key Data From Primary Sources
2.1.2.2 Breakdown of Primaries
2.2 Market Size Estimation
2.3 Market Breakdown & Data Triangulation
2.4 Research Assumptions & Limitations
3 Executive Summary (Page No. - 27)
4 Premium Insights (Page No. - 32)
4.1 Opportunities in the Grain Analysis Market
4.2 Market, By Key Country/Region
4.3 Europe: Market, By Target Tested & Country
4.4 Food vs Feed Market Share, By Region
4.5 Market, By Rapid Technology & Region
5 Market Overview (Page No. - 36)
5.1 Introduction
5.2 Market Dynamics
5.2.1 Drivers
5.2.1.1 Increase in Outbreaks of Foodborne Illnesses
5.2.1.2 Consumer Concerns With GM Content in Food Products
5.2.1.3 Globalization in Grain Trade
5.2.1.4 Stringent Safety and Quality Regulations for Food and Feed
5.2.1.5 Labeling Mandates on GMO and Allergens in Food
5.2.1.5.1 Labeling Laws for GM Foods
5.2.1.5.2 Labeling Compliance for Allergen Contents
5.2.2 Restraints
5.2.2.1 Lack of Coordination Between Market Stakeholders and Improper Enforcement of Regulatory Laws & Supporting Infrastructure in Developing Economies
5.2.3 Opportunities
5.2.3.1 Technological Advancements in the Testing Industry
5.2.4 Challenges
5.2.4.1 Lack of Harmonization in Food Safety Standards
5.3 Supply Chain Analysis
5.3.1 Upstream Process
5.3.1.1 Research & Development
5.3.1.2 Production
5.3.2 Midstream Process
5.3.2.1 Processing & Transformation
5.3.2.2 Transportation
5.3.3 Downstream Process
5.3.3.1 Final Preparation
5.3.3.2 Distribution
6 Grain Analysis Market, By Grain Type (Page No. - 44)
6.1 Introduction
6.2 Cereals
6.3 Oilseeds
6.4 Pulses
7 Grain Analysis Market, By Target Tested (Page No. - 48)
7.1 Introduction
7.2 Pathogens
7.3 Pesticides
7.4 GMO
7.5 Mycotoxins
7.6 Others
8 Grain Analysis Market, By Technology (Page No. - 55)
8.1 Introduction
8.2 Traditional Technology
8.2.1 Agar Culturing
8.3 Rapid Technology
8.3.1 Convenience-Based
8.3.2 Polymerase Chain Reaction (PCR)
8.3.3 Immunoassay
8.3.4 Chromatography & Spectrometry
9 Grain Analysis Market, By End Use (Page No. - 63)
9.1 Introduction
9.2 Food
9.2.1 Safety
9.2.2 Quality
9.3 Feed
10 Grain Analysis Market, By Component (Page No. - 68)
10.1 Introduction
10.2 Instruments
10.3 Reagents & Consumables
10.4 Reference Materials
11 Grain Analysis Market, By Region (Page No. - 70)
11.1 Introduction
11.2 North America
11.2.1 US
11.2.2 Canada
11.2.3 Mexico
11.3 Europe
11.3.1 Germany
11.3.2 France
11.3.3 UK
11.3.4 Italy
11.3.5 Poland
11.3.6 Spain
11.3.7 Rest of Europe
11.4 Asia Pacific
11.4.1 China
11.4.2 India
11.4.3 Japan
11.4.4 Australia
11.4.5 Rest of Asia Pacific
11.5 Rest of the World (RoW)
11.5.1 South America
11.5.2 Middle East & Africa
12 Regulatory Framework (Page No. - 95)
12.1 Introduction
12.2 U.S.
12.3 European Union
12.4 China
12.5 Japan
12.6 India
12.7 Australia
13 Competitive Landscape (Page No. - 99)
13.1 Introduction
13.2 Competitive Leadership Mapping
13.2.1 Visionary Leaders
13.2.2 Innovators
13.2.3 Dynamic Differentiators
13.2.4 Emerging Companies
13.3 Competitive Benchmarking
13.3.1 Strength of Service Offering (For 25 Companies)
13.3.2 Business Strategy Excellence (For 25 Companies)
*Top 25 companies analyzed for this study are � SGS SA (Switzerland), Bureau Veritas SA (France), Eurofins Scientific (Luxembourg), Intertek Group plc (UK), ALS Limited (Australia), T�V S�D (Germany), T�V Nord Group (Germany), M�rieux NutriSciences (US), Covance Inc. (US), SCS Global Services (US), Symbio Laboratories (Australia), Neogen Corporation (US), Genetic ID NA, Inc. (US), Alex Stewart International (UK), Romer Labs Division Holding GmbH (Austria), TLR International Laboratories (Netherlands), Microbac Laboratories, Inc. (US), Cotecna Inspection SA (Switzerland), R J Hill Laboratories Ltd (New Zealand), AsureQuality Ltd (New Zealand), Agrifood Technology (Australia), BioProfile Testing Laboratories, LLC (US), Bedfordia Farms Ltd (UK), Futari Grain Technology Services (Australia), Great Tew Grain Processing Ltd (US)
13.4 Market Share Analysis, By Key Player, 2016
14 Company Profiles (Page No. - 105)
(Business Overview, Products Offered, Product Offering Scorecard, Business Strategy Scorecard, Recent Developments, Key Relationships)*
14.1 Testing Service Providers
14.1.1 SGS SA
14.1.2 Bureau Veritas SA
14.1.3 Eurofins Scientific
14.1.4 Intertek Group PLC
14.1.5 T�V S�D
14.1.6 T�V Nord Group
14.1.7 ALS Limited
14.2 Testing Services & Products Providers
14.2.1 Neogen Corporation
14.2.2 Romer Labs Division Holding GmbH
14.2.3 Thermo Fisher Scientific, Inc.
14.2.4 Shimadzu Corporation
14.2.5 Waters Corporation
14.2.6 AB Sciex
*Details on Business Overview, Products Offered, Product Offering Scorecard, Business Strategy Scorecard, Recent Developments, Key Relationships Might Not Be Captured in Case of Unlisted Companies.
15 Appendix (Page No. - 142)
15.1 Discussion Guide
15.2 Knowledge Store: Marketsandmarkets� Subscription Portal
15.3 Introducing RT: Real-Time Market Intelligence
15.4 Available Customizations
15.5 Related Reports
15.6 Author Details
List of Tables (66 Tables)
Table 1 Grain Analysis Market Snapshot (Value)
Table 2 GM Labeling Requirements in Different Countries
Table 3 Grain Analysis Market Size, By Grain Type, 2015�2022 (USD Million)
Table 4 Cereals: Market Size, By Region, 2015�2022 (USD Million)
Table 5 Oilseeds: Market Size, By Region, 2015�2022 (USD Million)
Table 6 Pulses: Market Size, By Region, 2015�2022 (USD Million)
Table 7 Grain Analysis Market Size, By Target Tested, 2015�2022 (USD Million)
Table 8 Pathogens: Market Size, By Region, 2015�2022 (USD Million)
Table 9 Pesticides: Market Size, By Region, 2015�2022 (USD Million)
Table 10 GMO: Market Size, By Region, 2015�2022 (USD Million)
Table 11 Mycotoxin Occurrence in Grains & Their Effects on Health
Table 12 Mycotoxins: Market Size, By Region, 2015�2022 (USD Million)
Table 13 Others: Grain Analysis Market Size, By Region, 2015�2022 (USD Million)
Table 14 Grain Analysis Market Size, By Technology, 2015�2022 (USD Million)
Table 15 Traditional Technology: Market Size, By Region, 2015�2022 (USD Million)
Table 16 Rapid Technology: Market Size, By Type, 2015�2022 (USD Million)
Table 17 Rapid Technology: Market Size, By Region, 2015�2022 (USD Million)
Table 18 Convenience-Based: Market Size, By Region, 2015�2022 (USD Million)
Table 19 PCR: Market Size, By Region, 2015�2022 (USD Million)
Table 20 Immunoassay: Market Size, By Region, 2015�2022 (USD Million)
Table 21 Chromatography & Spectrometry: Market Size, By Region, 2015�2022 (USD Million)
Table 22 Grain Analysis Market Size, By End Use, 2015�2022 (USD Million)
Table 23 Food Grain Analysis Market Size, By Region, 2015�2022 (USD Million)
Table 24 Food Grain Analysis Market Size, By Purpose, 2015�2022 (USD Million)
Table 25 Safety: Food Grain Analysis Market Size, By Region, 2015�2022 (USD Million)
Table 26 Quality: Food Grain Analysis Market Size, By Region, 2015�2022 (USD Million)
Table 27 Feed Grain Analysis Market Size, By Region, 2015�2022 (USD Million)
Table 28 Grain Analysis Market Size, By Component, 2015�2022 (USD Million)
Table 29 Market Size, By Region, 2015�2022 (USD Million)
Table 30 North America: Grain Analysis Market Size, By Country, 2015�2022 (USD Million)
Table 31 North America: Market Size, By Grain Type, 2015�2022 (USD Million)
Table 32 North America: Market Size, By Target Tested, 2015�2022 (USD Million)
Table 33 North America: Market Size, By Technology, 2015�2022 (USD Million)
Table 34 North America: Market Size, By Rapid Technology, 2015�2022 (USD Million)
Table 35 US: Market Size, By Grain Type, 2015�2022 (USD Million)
Table 36 Canada: Market Size, By Grain Type, 2015�2022 (USD Million)
Table 37 Mexico: Market Size, By Grain Type, 2015�2022 (USD Million)
Table 38 Europe: Grain Analysis Market Size, By Country, 2015�2022 (USD Million)
Table 39 Europe: Market Size, By Grain Type, 2015�2022 (USD Million)
Table 40 Europe: Market Size, By Target Tested, 2015�2022 (USD Million)
Table 41 Europe: Market Size, By Technology, 2015�2022 (USD Million)
Table 42 Europe: Market Size, By Rapid Technology, 2015�2022 (USD Million)
Table 43 Germany: Market Size, By Grain Type, 2015�2022 (USD Million)
Table 44 France: Market Size, By Grain Type, 2015�2022 (USD Million)
Table 45 UK: Market Size, By Grain Type, 2015�2022 (USD Million)
Table 46 Italy: Market Size, By Grain Type, 2015�2022 (USD Million)
Table 47 Poland: Market Size, By Grain Type, 2015�2022 (USD Million)
Table 48 Spain: Market Size, By Grain Type, 2015�2022 (USD Million)
Table 49 Rest of Europe: Market Size, By Grain Type, 2015�2022 (USD Million)
Table 50 Asia Pacific: Grain Analysis Market Size, By Country, 2015�2022 (USD Million)
Table 51 Asia Pacific: Market Size, By Grain Type, 2015�2022 (USD Million)
Table 52 Asia Pacific: Market Size, By Target Tested, 2015�2022 (USD Million)
Table 53 Asia Pacific: Market Size, By Technology, 2015�2022 (USD Million)
Table 54 Asia Pacific: Market Size, By Rapid Technology, 2015�2022 (USD Million)
Table 55 China: Market Size, By Grain Type, 2015�2022 (USD Million)
Table 56 India: Market Size, By Grain Type, 2015�2022 (USD Million)
Table 57 Japan: Market Size, By Grain Type, 2015�2022 (USD Million)
Table 58 Australia: Market Size, By Grain Type, 2015�2022 (USD Million)
Table 59 Rest of Asia Pacific: Market Size, By Grain Type, 2015�2022 (USD Million)
Table 60 RoW: Grain Analysis Market Size, By Country, 2015�2022 (USD Million)
Table 61 RoW: Market Size, By Grain Type, 2015�2022 (USD Million)
Table 62 RoW: Market Size, By Target Type, 2015�2022 (USD Million)
Table 63 RoW: Market Size, By Technology, 2015�2022 (USD Million)
Table 64 RoW: Market Size, By Rapid Technology, 2015�2022 (USD Million)
Table 65 South America: Market Size, By Grain Type, 2015�2022 (USD Million)
Table 66 Middle East & Africa: Market Size, By Grain Type, 2015�2022 (USD Million)
List of Figures (43 Figures)
Figure 1 Grain Analysis Market Segmentation
Figure 2 Grain Analysis Geographic Segmentation
Figure 3 Grain Analysis Market: Research Design
Figure 4 Market Size Estimation Methodology: Bottom-Up Approach
Figure 5 Market Size Estimation Methodology: Top-Down Approach
Figure 6 Data Triangulation
Figure 7 Grain Analysis Market Size, By Grain Type, 2017 vs 2022 (USD Million)
Figure 8 Market Snapshot, By Target Tested, 2017 vs 2022 (USD Million)
Figure 9 Market Share, By Technology, 2017 vs 2022
Figure 10 Market Size, By End Use, 2017 vs 2022 (USD Million)
Figure 11 Market Size, By Component, 2017 vs 2022 (USD Million)
Figure 12 Europe Dominated the Grain Analysis Market in 2016
Figure 13 Consumer Concerns With GM Content in Food Products Drive the Demand for Grain Analysis
Figure 14 Geographic Snapshot: New Hotspots Emerging in Asia Pacific, 2017�2022
Figure 15 Mycotoxins Accounted for the Largest Share in 2016
Figure 16 Food to Be the Dominant End Use in the Grain Analysis Market From 2017 to 2022
Figure 17 Chromatography & Spectrometry is Projected to Be the Fastest-Growing During the Forecast Period
Figure 18 Grain Consumption By End-Use Industries
Figure 19 Market Dynamics: Grain Analysis Market
Figure 20 World Grain Consumption & Trade
Figure 21 Consumer Preference Toward GM Foods, By Region, 2015
Figure 22 Supply Chain Analysis: Grain Analysis Market
Figure 23 Grain Analysis Market Share, By Grain Type, 2017 vs 2022
Figure 24 Market Share, By Target Tested, 2017 vs 2022
Figure 25 Global Area of Biotech Crops, 2000�2016 (Million Hectares)
Figure 26 Grain Analysis Market Share, By Technology, 2017 vs 2022
Figure 27 Market Share, By End Use, 2017 vs 2022
Figure 28 Market Share, By Component, 2017 vs 2022
Figure 29 US Accounted for the Largest Share in the Grain Analysis Market in 2016
Figure 30 European Market Snapshot
Figure 31 Asia Pacific Market Snapshot
Figure 32 Grain Analysis Market (Global): Competitive Leadership Mapping, 2017
Figure 33 SGS SA: Company Snapshot
Figure 34 Bureau Veritas S.A.: Company Snapshot
Figure 35 Eurofins Scientific: Company Snapshot
Figure 36 Intertek Group PLC: Company Snapshot
Figure 37 T�V S�D: Company Snapshot
Figure 38 T�V Nord Group: Company Snapshot
Figure 39 ALS Limited: Company Snapshot
Figure 40 Neogen Corporation: Company Snapshot
Figure 41 Thermo Fisher Scientific, Inc.: Company Snapshot
Figure 42 Shimadzu Corporation: Company Snapshot
Figure 43 Waters Corporation: Company Snapshot

 Generating Response ...


Growth opportunities and latent adjacency in Grain Analysis Market