Gear Motors Market by Product (Gearbox & Gear Motor), by Gear Type (Helical, Planetary, Helical-Bevel, Worm, & Others), by Rated Power, by Torque (Up to 10,000 Nm, Above 10,000 Nm), by Industry & by Region - Global Trends & Forecast to 2021


[163 Pages Report] The global gear motors market is estimated to be USD 18.08 Billion in 2016, and is projected to reach USD 23.94 Billion by 2021, growing at a CAGR of 5.8% from 2016 to 2021. Factors driving the gear motors market include increasing wind power installations, the minimal cost and compact nature of gear motors, and growing concerns regarding the efficiency of mechanical power transmission. The gear motors market is segmented on the basis of product type, gear type, rated power, torque range, industries, and region. The years considered for the study are:
- Historical Year � 2014
- Base Year � 2015
- Estimated Year � 2016
- Projected Year � 2021
- Forecast Period � 2016 to 2021
2015 has been considered the base year for company profiles. Whenever information was unavailable for the base year, the prior year has been considered.
Research Methodology:
- This research study has involved extensive usage of secondary sources, directories, and databases (such as Hoovers, Bloomberg Businessweek, Factiva, and OneSource) to identify and collect information useful for a technical, market-oriented, and commercial study of the gear motors market
- In-depth interviews have been conducted with various primary respondents that include key industry participants, subject matter experts, C-level executives of key market players, and industry consultants, among other experts
- After arriving at the overall market size, the total market has been split into several segments and subsegments. To complete the overall market engineering process and arrive at exact statistics for all the segments and subsegments, the data triangulation and market breakdown procedures have been employed, wherever applicable
- The data has been triangulated by studying various factors and trends from both, the demand and supply sides. Along with this, the market size has been validated using both, the top-down and bottom-up approaches
The figure below shows the breakdown of the primaries on the basis of company, designation, and region, conducted during the research study.
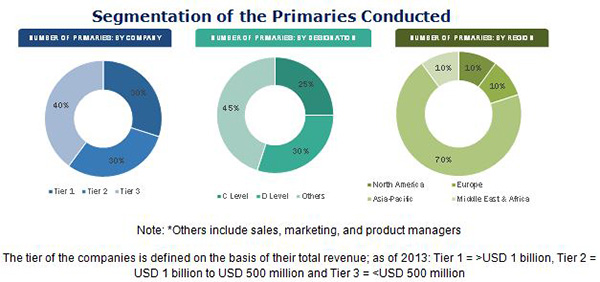
To know about the assumptions considered for the study, download the pdf brochure
�The study answers several questions for stakeholders, primarily which market segments to focus on in the next two to five years for prioritizing efforts and investments.�
Target Audience:
- OEMS
- Distributers & suppliers
- Consulting firms
- Private equity groups
- Investment houses
- Equity research firms
- Other similar entities
Scope of the Report:
- By Product Type:
- Gearbox
- Gear Motor
- By Gear Type:
- Helical
- Helical-Bevel
- Planetary
- Worm
- Others
- By Rated Power:
- Up to 7.5 kW
- 7.5 kW to 75 kW
- Above 75 kW
- By Torque
- Up to 10,000 Nm
- Above 10,000 Nm
- By Industry
- Wind Power
- Material Handling
- Food & Beverage
- Cement & Aggregates
- Metals & Mining
- Automotive
- Construction
- Power Generation (Excluding Wind Power)
- Chemicals, Rubber, & Plastics
- Marine
- Others
- By Region
- Asia-Pacific
- Europe
- North America
- South America
- The Middle East & Africa
Available Customizations:
With the given market data, MarketsandMarkets offers customizations as per the client�s specific needs. The following customization options are available for this report:
Regional Analysis
- Further breakdown of region/country-specific analysis
Company Information
- Detailed analysis and profiling of additional market players (Up to 5)
The global gear motors market is projected to grow at a CAGR of 5.8% from 2016 to 2021, to reach USD 23.94 Billion by 2021. This growth can be attributed to increasing wind power installations and growing concerns regarding the efficiency and cost-effectiveness of mechanical power transmission technologies.
The report segments the gear motors market on the basis of major end-user industries into wind power, material handling, food & beverage, metals & mining, cement & aggregates, automotive, power generation (excluding wind power), construction, chemicals, rubber, & plastics, marine, and other industries. The wind power and material handling industries are projected to be the fastest-growing segments in the gear motors market during the forecast period.
In terms of gear type, planetary gears are estimated to constitute the fastest-growing segment in the market. The demand for helical gear motors is higher than that of other gear types. Helical gear motors held the largest share in the total gear motors market in 2015. These motors are expected to dominate the market during the forecast period.
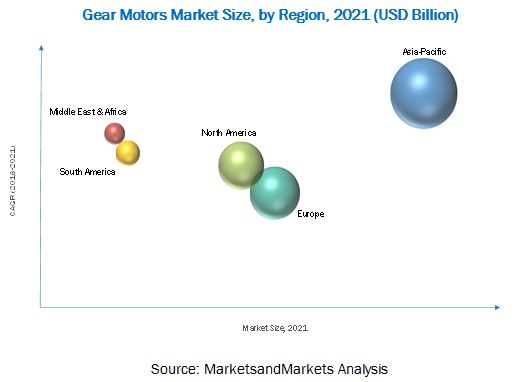
Asia-Pacific led the market for gear motors in 2015, owing to large-scale industrialization and infrastructural development in the region. Governments in Asia-Pacific are currently focusing on developing existing infrastructure. India and China are expected to be the fastest-growing markets in the region from 2016 to 2021. The figure below shows the market sizes of Asia-Pacific countries in 2016 and 2021, with CAGR from 2016 to 2021.
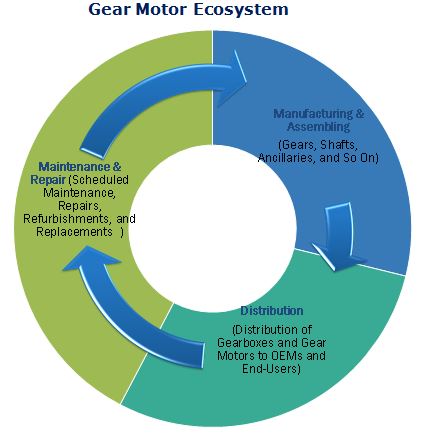
Manufacturing a gear motor requires a gear assembly, shaft, motor (integrated unit in case of a gear motor), an enclosure of desired specification, wirings, and so on. The prices of the major components required for gear motors are relatively less volatile, which makes the overall assembly of the device inexpensive compared to competing products such as direct drives. This makes the gear motor a highly attractive product. However, the price difference has little consequence when the process is very critical and requires superior efficiency and control. This factor has proved to be a restraint for the gear motors market.
Siemens AG (Germany), a frontrunner in the market, tries to set benchmarks by improving innovation and providing leading technologies related to power products. The company has designed a comprehensive strategic framework called Vision 2020, with the aim of driving performance in the short term, strengthening core in the medium term, and scaling up in the long term. The company is consolidating particular segments, such as the solution-driven segment, and is focusing on attaining in-depth expertise in niche markets and convergence in product-driven markets.
Leading players are trying to penetrate developing economies, and are adopting various methods to increase their market share. Contracts & agreements was the strategy most commonly adopted by top players in the market, constituting 40% of the total development share from 2012 to 2015. It was followed by new product development, expansion, and other developments.
To speak to our analyst for a discussion on the above findings, click Speak to Analyst
 Exclusive indicates content/data unique to MarketsandMarkets and not available with any competitors.
Table of Contents
1 Introduction (Page No. - 16)
1.1 Objectives of the Study
1.2 Market Definition
1.3 Market Scope
1.3.1 Gear Motors Market: Markets Covered
1.3.2 Years Considered for the Study
1.4 Currency
1.5 Limitations
1.6 Stakeholders
2 Research Methodology (Page No. - 20)
2.1 Research Data
2.1.1 Secondary Data
2.1.1.1 Key Data From Secondary Sources
2.1.2 Primary Data
2.1.2.1 Key Data From Primary Sources
2.1.2.2 Key Industry Insights
2.1.2.3 Breakdown of Primaries
2.2 Market Size Estimation
2.2.1 Bottom-Up Approach
2.2.2 Top-Down Approach
2.3 Market Breakdown & Data Triangulation
2.4 Research Assumptions & Limitations
2.4.1 Assumptions
2.4.2 Limitations
3 Executive Summary (Page No. - 28)
3.1 Introduction
3.1.1 Historical Background
3.1.2 Current Scenario
3.1.3 Future Outlook
3.1.4 Conclusion
4 Premium Insights (Page No. - 34)
4.1 Attractive Opportunities in the Gear Motors Market
4.2 Gear Motors Market: Power Rating Segment
4.3 Asia-Pacific to Dominate the Gear Motors Market During the Forecast Period
4.4 Gearbox Segment to Dominate the Gear Motors Market During the Forecast Period
4.5 Gear Motors Market: Asia-Pacific
4.6 Gear Motors Market, By Gear Type
4.7 Gear Motors Market, By Torque
5 Market Overview (Page No. - 39)
5.1 Introduction
5.2 Market Segmentation
5.2.1 By Rated Power
5.2.2 By Torque
5.2.3 By Gear Type
5.2.4 By Product Type
5.2.5 By Industry
5.2.6 By Region
5.3 Market Dynamics
5.3.1 Drivers
5.3.1.1 Modular & Compact Design
5.3.1.2 Mechanical Simplicity
5.3.1.3 Growth of the Renewable Energy Sector
5.3.2 Restraints
5.3.2.1 High Maintenance Cost
5.3.2.2 Use of Direct Drives & Variable Speed Drives
5.3.3 Opportunities
5.3.3.1 Development of Hybrid Technology
5.3.4 Challenges
5.3.4.1 Gray Market
5.3.4.2 High Manufacturing Cost
6 Industry Trends (Page No. - 49)
6.1 Introduction
6.2 Supply Chain Analysis
6.3 Porter�s Five Forces Analysis
6.3.1 Threat of New Entrants
6.3.2 Threat of Substitutes
6.3.3 Bargaining Power of Suppliers
6.3.4 Bargaining Power of Buyers
6.3.5 Intensity of Competitive Rivalry
7 Gear Motors Market, By Gear Type (Page No. - 53)
7.1 Introduction
7.2 Helical Gear Motors
7.3 Planetary Gear Motors
7.4 Helical-Bevel Gear Motors
7.5 Worm Gear Motors
7.6 Others
8 Gear Motors Market, By Product Type (Page No. - 59)
8.1 Introduction
8.2 Gearbox
8.3 Integrated Gear Motor Unit
9 Gear Motors Market, By Rated Power (kW) (Page No. - 63)
9.1 Introduction
9.2 Rated Power Up to 7.5 kW
9.3 Rated Power 7.5 kW to 75 kW
9.4 Rated Power Above 75 kW
10 Gear Motors Market, By Torque (Nm) (Page No. - 67)
10.1 Introduction
10.2 Up to 10,000 Nm Torque
10.3 Above 10,000 Nm Torque
11 Gear Motors Market, By Industry (Page No. - 71)
11.1 Introduction
11.2 Wind Power
11.3 Material Handling
11.4 Food & Beverage
11.5 Cement & Aggregates
11.6 Metals & Mining
11.7 Automotive
11.8 Construction
11.9 Power Generation (Excluding Wind Power)
11.10 Chemicals, Rubber, & Plastics
11.11 Marine
11.12 Others
12 Gear Motors Market, By Region (Page No. - 81)
12.1 Introduction
12.2 Asia-Pacific
12.3 By Product Type
12.4 By Gear Type
12.5 By Rated Power
12.6 By Torque
12.7 By Industry
12.8 By Country
12.8.1 China
12.8.2 Japan
12.8.3 India
12.8.4 Australia
12.8.5 South Korea
12.8.6 Rest of Asia-Pacific
12.9 Europe
12.10 By Product Type
12.11 By Gear Type
12.12 By Rated Power
12.13 By Torque
12.14 By Industry
12.15 By Country
12.15.1 Germany
12.15.2 Italy
12.15.3 France
12.15.4 Russia
12.15.5 U.K.
12.15.6 Rest of Europe
12.16 North America
12.17 By Product Type
12.18 By Gear Type
12.19 By Rated Power
12.20 By Torque
12.21 By Industry
12.22 By Country
12.22.1 the U.S.
12.22.2 Canada
12.22.3 Mexico
12.23 South America
12.24 By Product Type
12.25 By Gear Type
12.26 By Rated Power
12.27 By Torque
12.28 By Industry
12.29 By Country
12.29.1 Brazil
12.29.2 Argentina
12.29.3 Rest of South America
12.30 The Middle East & Africa
12.31 By Product Type
12.32 By Gear Type
12.33 By Rated Power
12.34 By Torque
12.35 By Industry
12.36 By Country
12.36.1 Saudi Arabia
12.36.2 UAE
12.36.3 Qatar
12.36.4 South Africa
12.36.5 Rest of the Middle East & Africa
13 Competitive Landscape (Page No. - 114)
13.1 Overview
13.2 Competitive Situation & Trends
13.3 Contracts & Agreements
13.4 New Product Developments
13.5 Expansions
13.6 Other Developments
14 Company Profiles (Page No. - 121)
(Company at A Glance, Recent Financials, Products & Services, Strategies & Insights, & Recent Developments)*
14.1 Introduction
14.2 Eaton Corporation PLC.
14.3 Siemens AG
14.4 Baldor Electric Company
14.5 Sew-Eurodrive GmbH & Co. Kg
14.6 Winergy
14.7 Bonfiglioli Riduttori S.P.A.
14.8 Brevini Power Transmission S.P.A.
14.9 China High Speed Transmission Equipment Group Co. Ltd.
14.10 Elecon Engineering Company Ltd.
14.11 Emerson Electric Co.
14.12 Johnson Electric Holdings Limited
14.13 Sumitomo Heavy Industries Ltd.
14.14 Bauer Gear Motor GmbH
14.15 Watt Drive Antriebstechnik GmbH
*Detailson Company at A Glance, Recent Financials, Products & Services, Strategies & Insights, & Recent Developments Might Not Be Captured in Case of Unlisted Companies.
15 Appendix (Page No. - 153)
15.1 Insights of Industry Experts
15.2 Other Developments
15.3 Discussion Guide
15.4 Knowledge Store: Marketsandmarkets� Subscription Portal
15.5 Introducing RT: Real Time Market Intelligence
15.6 Available Customizations
15.7 Related Reports
List of Tables (90 Tables)
Table 1 The Modular & Compact Design of Gear Motors is the Key Factor Driving the Market
Table 2 High Maintenance Cost Could Restrain the Growth of the Gear Motor Market
Table 3 Development of Hybrid Technology is an Opportunity for the Gear Motor Market
Table 4 Gray Market is A Challenge for the Gear Motor Market
Table 5 Gear Motor Market Size, By Gear Type, 2014�2021 (USD Billion)
Table 6 Helical: Gear Motor Market Size, By Region, 2014�2021 (USD Million)
Table 7 Planetary: Gear Motor Market Size, By Region, 2014�2021 (USD Million)
Table 8 Helical-Bevel: Gear Motor Market Size, By Region, 2014�2021 (USD Million)
Table 9 Worm: Gear Motor Market Size, By Region, 2014�2021 (USD Million)
Table 10 Others: Gear Motor Market Size, By Region, 2014�2021 (USD Million)
Table 11 Gear Motor Market Size, By Product Type, 2014�2021 (USD Billion)
Table 12 Gearbox: Gear Motor Market Size, By Region, 2014�2021 (USD Million)
Table 13 Integrated Gear Motor Unit: Gear Motor Market Size, By Region, 2014�2021 (USD Million)
Table 14 Gear Motor Market Size, By Rated Power (kW), 2014�2021 (USD Billion)
Table 15 Rated Power Up to 7.5 kW: Gear Motor Market Size, By Region, 2014�2021 (USD Million)
Table 16 Rated Power 7.5 kW to 75 kW: Gear Motor Market Size, By Region, 2014�2021 (USD Million)
Table 17 Rated Power Above 75 kW: Gear Motor Market Size, By Region, 2014�2021 (USD Million)
Table 18 Gear Motor Market Size, By Torque (Nm), 2014�2021 (USD Billion)
Table 19 Torque Up to 10,000 Nm: Gear Motors Market Size, By Region, 2014�2021 (USD Million)
Table 20 Torque Above 10,000 Nm: Gear Motors Market Size, By Region, 2014�2021 (USD Million)
Table 21 Gear Motors Market Size, By Industry, 2014�2021 (USD Million)
Table 22 Wind Power: Gear Motors Market Size, By Region, 2014�2021 (USD Million)
Table 23 Material Handling: Gear Motors Market Size, By Region, 2014�2021 (USD Million)
Table 24 Food & Beverage: Gear Motors Market Size, By Region, 2014�2021 (USD Million)
Table 25 Cement & Aggregates: Gear Motors Market Size, By Region, 2014�2021 (USD Million)
Table 26 Metals & Mining: Gear Motors Market Size, By Region, 2014�2021 (USD Million)
Table 27 Automotive: Gear Motors Market Size, By Region, 2014�2021 (USD Million)
Table 28 Construction: Gear Motors Market Size, By Region, 2014�2021 (USD Million)
Table 29 Power Generation (Excluding Wind Power): Gear Motor Market Size, By Region, 2014�2021 (USD Million)
Table 30 Chemicals, Rubber, & Plastics: Gear Motor Market Size, By Region, 2014�2021 (USD Million)
Table 31 Marine: Gear Motor Market Size, By Region, 2014�2021 (USD Million)
Table 32 Others: Gear Motor Market Size, By Region, 2014�2021 (USD Million)
Table 33 Gear Motor Market Size, By Region, 2014�2021 (USD Billion)
Table 34 Asia-Pacific: Gear Motor Market Size, By Country, 2014�2021(USD Million)
Table 35 Asia-Pacific: By Market Size, By Product Type, 2014�2021 (USD Million)
Table 36 Asia-Pacific: By Market Size, By Gear Type, 2014�2021 (USD Million)
Table 37 Asia-Pacific: By Market Size, By Rated Power, 2014�2021 (USD Million)
Table 38 Asia-Pacific: By Market Size, By Torque , 2014�2021 (USD Million)
Table 39 Asia-Pacific: By Market Size, By Industry, 2014�2021 (USD Million)
Table 40 China: By Market Size, By Product Type, 2014�2021 (USD Million)
Table 41 Japan: By Market Size, By Product Type, 2014�2021 (USD Million)
Table 42 India: By Market Size, By Product Type, 2014�2021 (USD Million)
Table 43 Australia: Gear Motors Market Size, By Product Type, 2014�2021 (USD Million)
Table 44 South Korea: Gear Motors Market Size, By Product Type, 2014�2021 (USD Million)
Table 45 Rest of Asia-Pacific: Gear Motors Market Size, By Product Type, 2014�2021 (USD Million)
Table 46 Europe: Gear Motors Market Size, By Country, 2014�2021 (USD Million)
Table 47 Europe: By Market Size, By Product Type, 2014�2021 (USD Million)
Table 48 Europe: By Market Size, By Gear Type, 2014�2021 (USD Million)
Table 49 Europe: By Market Size, By Rated Power, 2014�2021 (USD Million)
Table 50 Europe: By Market Size, By Torque, 2014�2021 (USD Million)
Table 51 Europe: By Market Size, By Industry, 2014�2021 (USD Million)
Table 52 Germany: Gear Motors Market Size, By Product Type, 2014�2021 (USD Million)
Table 53 Italy: By Market Size, By Product Type 2014�2021 (USD Million)
Table 54 France: By Market Size, By Product Type, 2014�2021 (USD Million)
Table 55 Russia: By Market Size, By Product Type, 2014�2021 (USD Million)
Table 56 U.K.: By Market Size, By Product Type, 2014�2021 (USD Million)
Table 57 Rest of Europe: Gear Motors Market Size, By Product Type, 2014�2021 (USD Million)
Table 58 North America: By Market Size, By Country, 2014�2021 (USD Million)
Table 59 North America: By Market Size, By Product Type, 2014�2021 (USD Million)
Table 60 North America: By Market Size, By Gear Type, 2014�2021 (USD Million)
Table 61 North America: By Market Size, By Rated Power , 2014�2021 (USD Million)
Table 62 North America: By Market Size, By Torque, 2014�2021 (USD Million)
Table 63 North America: By Market Size, By Industry, 2014�2021 (USD Million)
Table 64 U.S.: Gear Motors Market Size, By Product Type, 2014�2021 (USD Million)
Table 65 Canada: Gear Motors Market Size, By Product Type, 2014�2021 (USD Million)
Table 66 Mexico: Gear Motors Market Size, By Product Type, 2014�2021 (USD Million)
Table 67 South America: Gear Motors Market Size, By Country, 2014�2021 (USD Million)
Table 68 South America: By Market Size, By Product Type, 2014�2021 (USD Million)
Table 69 South America: By Market Size, By Gear Type, 2014�2021 (USD Million)
Table 70 South America: By Market Size, By Rated Power , 2014�2021 (USD Million)
Table 71 South America: By Market Size, By Torque, 2014�2021 (USD Million)
Table 72 South America: By Market Size, By Industry, 2014�2021 (USD Million)
Table 73 Brazil: Gear Motors Market Size, By Product Type, 2014�2021 (USD Million)
Table 74 Argentina: Gear Motors Market Size, By Product Type, 2014�2021 (USD Million)
Table 75 Rest of South America: Gear Motors Market Size, By Product Type, 2014�2021 (USD Million)
Table 76 The Middle East & Africa: Gear Motors Market Size, By Country, 2014�2021 (USD Million)
Table 77 The Middle East & Africa: By Market Size, By Product Type, 2014�2021 (USD Million)
Table 78 The Middle East & Africa: By Market Size, By Gear Type, 2014�2021 (USD Million)
Table 79 The Middle East & Africa: By Market Size, By Rated Power, 2013�2021 (USD Million)
Table 80 The Middle East & Africa: By Market Size, By Torque, 2014�2021 (USD Million)
Table 81 The Middle East & Africa: By Market Size, By Industry, 2014�2021 (USD Million)
Table 82 Saudi Arabia: Gear Motor Market Size, By Product Type, 2014�2021 (USD Million)
Table 83 UAE: Gear Motor Market Size, By Product Type, 2014�2021 (USD Million)
Table 84 Qatar: Gear Motor Market Size, By Product Type, 2014�2021 (USD Million)
Table 85 South Africa: Gear Motor Market Size, By Product Type , 2014�2021 (USD Million)
Table 86 Rest of the Middle East & Africa: Gear Motor Market Size, By Product Type, 2014�2021 (USD Million)
Table 87 Contracts & Agreements, 2012�2015
Table 88 New Product Developments, 2013�2015
Table 89 Expansions, 2012�2015
Table 90 Other Developments, 2012�2014
List of Figures (57 Figures)
Figure 1 Gear Motors Market: Research Design
Figure 2 Bottom-Up Approach
Figure 3 Top-Down Approach
Figure 4 Data Triangulation Methodology
Figure 5 Assumptions of the Research Study
Figure 6 Limitations of the Research Study
Figure 7 Gear Motor Components
Figure 8 Asia-Pacific Expected to Be the Largest Market for Gear Motors During the Forecast Period
Figure 9 Wind Power Industry Estimated to Dominate the Market in 2016
Figure 10 Torque Range Up to 10,Ooo Nm to Occupy the Largest Market Share During the Forecast Period
Figure 11 Gear Motors Rated Up to 7.5 kW to Account for the Largest Share in the Global Gear Motors Market
Figure 12 Helical Gears Expected to Be the Largest Segment, By Gear Type, From 2016 to 2021
Figure 13 Asia-Pacific Expected to Be the Largest & Fastest-Growing Market for Gear Motors
Figure 14 Increasing Wind Power Installations are Expected to Drive the Demand for Gear Motors
Figure 15 Gear Motors Rated Up to 7.5 kW are Expected to Hold the Largest Market Share During the Forecast Period
Figure 16 China to Hold the Largest Share in the Asia-Pacific Gear Motors Market
Figure 17 Gearbox Segment to Account for the Largest Market Share
Figure 18 Asia-Pacific Held the Largest Share in the Global Gear Motors Market in 2015
Figure 19 Helical Gear Motors Held the Largest Market Share in 2015
Figure 20 Gear Motors With Torque Range Up to 10,000 Nm are Expected to Dominate the Market From 2016 to 2021
Figure 21 Gear Motors Market: Market Segmentation
Figure 22 By Rated Power
Figure 23 By Torque Rating
Figure 24 By Gear Type
Figure 25 By Product Type
Figure 26 By Industry
Figure 27 By Region
Figure 28 Growth in the Renewable Power Generation Sector to Drive the Gear Motors Market
Figure 29 Electricity Production From Renewable Sources, Excluding Hydroelectric (kWh), 1992�2002
Figure 30 Supply Chain Analysis: Gear Motors Market
Figure 31 Porter�s Five Forces Analysis: Gear Motors Market
Figure 32 Helical Gear Motors Segment to Dominate the Gear Motors Market During the Forecast Period
Figure 33 Gearbox Segment to Dominate the Gear Motors Market During the Forecast Period
Figure 34 Gear Motors With Rated Power Up to 7.5 kW to Dominate the Market During 2016 to 2021
Figure 35 Gear Motors Employed for Torque Range Up to 10,000 Nm to Dominate the Market During the Forecast Period
Figure 36 Wind Power Accounted for the Largest Market Share in 2015
Figure 37 Regional Snapshot: Asia-Pacific, Europe, & North America are Major Markets for Gear Motors During the Forecast Period
Figure 38 China: an Attractive Market for Gear Motors
Figure 39 Gear Motors Market: Regional Snapshot
Figure 40 Gear Motors Market: Regional Snapshot
Figure 41 Companies Adopted Contracts & Agreements as the Key Growth Strategy Between 2012 & 2015
Figure 42 Market Evaluation Framework: Gear Motors Market (2012�2015)
Figure 43 Battle for Market Share: Contracts & Agreements Was the Key Strategy From 2012 to 2015
Figure 44 Region-Wise Revenue Mix of the Top 5 Players
Figure 45 Eaton Corporation PLC.: Company Snapshot
Figure 46 Eaton Corporation PLC.: SWOT Analysis
Figure 47 Siemens AG: Company Snapshot
Figure 48 Siemens AG: SWOT Analysis
Figure 49 Baldor Electric Company: SWOT Analysis
Figure 50 Sew-Eurodrive GmbH & Co. Kg: SWOT Analysis
Figure 51 Winergy: SWOT Analysis
Figure 52 Brevini Power Transmission S.P.A.: Company Snapshot
Figure 53 China High Speed Transmission Equipment Group Co. Ltd.: Company Snapshot
Figure 54 Elecon Engineering Company Ltd.: Company Snapshot
Figure 55 Emerson Electric Co.: Company Snapshot
Figure 56 Johnson Electric Holdings Limited: Company Snapshot
Figure 57 Sumitomo Heavy Industries Ltd.: Company Snapshot


Growth opportunities and latent adjacency in Gear Motors Market