Fusion Splicer Market by Offering (Hardware (Sheath Clamps, Electrodes, Electric ARC, CO2 Laser, Cleaver and Stripper), and Software & Services), Alignment Type (Core, and Cladding Alignment), Application, and Geography - Global Forecast to 2022


[154 Pages Report] The fusion splicer market was valued at USD 570.5 Million in 2016 and is expected to reach USD 762.3 Million by 2022, at a CAGR of 4.72%. Moreover, the registered a shipment of 65,735 units in 2016 and is expected to reach 97,353 units by 2022, at a CAGR of 6.52% during the forecast period. The base year considered for the study is 2016 and the forecast period is between 2017 and 2022.
The main objectives of this study are as follows:
- To define, describe, and forecast the market on the basis of offering, alignment type, application, and geography
- To provide detailed information regarding the major factors influencing the growth of the market (drivers, restraints, opportunities, and challenges)
- To provide a DIVE chart along with the product offerings and business strategy for the players in the market
The fusion splicer market was valued at USD 570.5 Million in 2016 and is expected to reach USD 762.3 Million by 2022, at a CAGR of 4.72% during the forecast period. Moreover, the market registered a shipment of 65,735 units in 2016 and is expected to reach 97,353 units by 2022, at a CAGR of 6.52% during the forecast period. Many countries are focusing on innovations and expansions in the fiber optic network in various telecommunication projects, which would help increase the demand for fusion splicer systems in the future.
The fusion splicer market has been segmented on the basis of offering into hardware, software and services. The market for software and services is expected to grow at a higher CAGR during the forecast period. This growth is attributed to the high adoption of software across telecommunication, cable TV, enterprise, and various specialty applications. The services for the fusion splicer machine includes warranty, training, optimization, replacement, and maintenance and troubleshooting.
The market has been segmented on the basis of alignment type, which includes core alignment and cladding alignment. Lower cost and faster alignment are the key factors contributing to the growth of cladding alignment compared with the core alignment in the overall fusion splicer market.
Furthermore, the market is segmented on the basis of application such as telecommunication, enterprise, cable TV, aerospace and defense, and specialty. Among all the applications, the enterprise application is expected to grow at the highest CAGR during the forecast period. The enterprise application is currently exhibiting a rapid adoption of fiber optic cables. Currently, many enterprises in China are engaged in developing new information infrastructures, which would include a huge number of fiber optic cables. This factor is indirectly expected to drive the growth of fusion splicer market in enterprise application also.
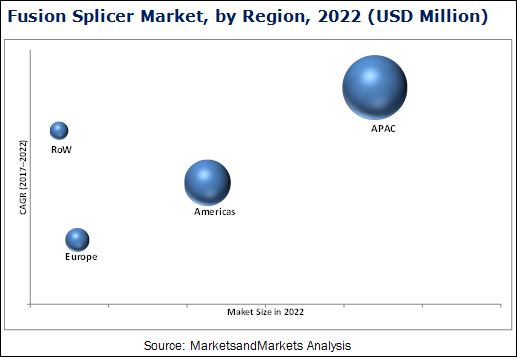
On the basis of geography, the market has been segmented into the Americas, Europe, Asia Pacific (APAC), and Rest of the World (RoW). The market in APAC is expected to grow at the highest CAGR during the forecast period. The market growth can be attributed to several initiatives by the governments in APAC and many major players in the fusion splicer ecosystem who are investing more to upgrade and expand the fiber optic network, thereby resulting in the increased adoption of fusion splicers. However, high initial cost of equipment is a major restraint for the fusion splicer market.
Key players in this market focus on organic strategy such as new product launches and expansions to increase their revenue. In March 2017, Fujikura Ltd. launched two new tools RS02 and RS03 for stripping telecommunication optical ribbon fiber. These fiber stripping tools are designed and developed with emphasis on operability and usability, where less force is required for the stripping process
To speak to our analyst for a discussion on the above findings, click Speak to Analyst
 Exclusive indicates content/data unique to MarketsandMarkets and not available with any competitors.
Table of Contents
1 Introduction (Page No. - 17)
1.1 Objectives of the Study
1.2 Market Definition
1.3 Study Scope
1.3.1 Markets Covered
1.3.2 Years Considered for the Study
1.4 Currency
1.5 Limitations
1.6 Stakeholders
2 Research Methodology (Page No. - 20)
2.1 Research Data
2.1.1 Secondary Data
2.1.1.1 Major Secondary Sources
2.1.1.2 Key Data From Secondary Sources
2.1.2 Primary Data
2.1.2.1 Primary Interviews With Experts
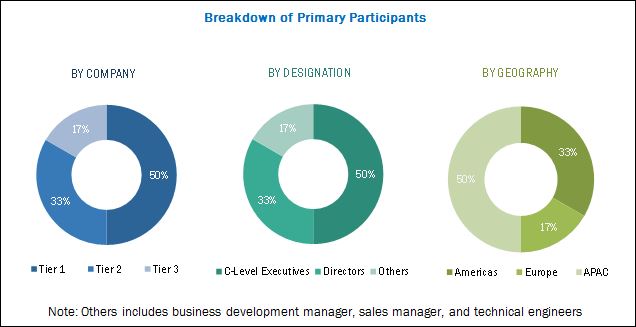
2.1.2.2 Breakdown of Primaries
2.1.2.3 Key Data From Primary Sources
2.1.2.4 Key Industry Insights
2.2 Secondary and Primary Research
2.3 Market Size Estimation
2.3.1 Bottom-Up Approach
2.3.1.1 Approach for Capturing the Market Share By Bottom-Up Analysis (Demand Side)
2.3.1.2 Approach for Capturing the Market Share With the Help of Various Players in the Value Chain of the Fusion Splicer Market
2.3.2 Top-Down Approach
2.3.2.1 Approach for Capturing the Market Share By Top-Down Analysis (Supply Side)
2.4 Market Breakdown and Data Triangulation
2.5 Research Assumptions
3 Executive Summary (Page No. - 32)
4 Premium Insights (Page No. - 37)
4.1 Attractive Opportunities in the Fusion Splicer Market
4.2 Market: By Offering
4.3 APAC to Hold the Largest Share of the Market in 2017
4.4 China Estimated to Dominate the Market in APAC in 2017
4.5 Market, By Alignment Type
5 Market Overview (Page No. - 41)
5.1 Market Dynamics
5.1.1 Drivers
5.1.1.1 Low Insertion Loss
5.1.1.2 High Demand for Increased Network Bandwidth
5.1.1.3 Increase in Government Funding for Fiber Optic Networks
5.1.2 Restraints
5.1.2.1 High Cost of Equipment
5.1.3 Opportunities
5.1.3.1 Rise in the Implementation of Ftth
5.1.3.2 Growth of the Telecommunications Industry
5.1.3.3 Upgrade of the Existing Fiber Optics Network
5.1.4 Challenges
5.1.4.1 Lack of Technical Knowledge and Skills
6 Industry Trends (Page No. - 48)
6.1 Value Chain Analysis
6.2 Regulatory Standards
6.2.1 ANSI/Eia/TIA Standards
6.2.1.1 ANSI/TIA-568-C
6.2.1.2 ANSI/TIA-568-B
6.2.1.3 ANSI/TIA-568 A
6.2.1.4 Other ANSI/TIA and ANSI/ICEA Standards
7 Fusion Splicer Market, By Offering (Page No. - 51)
7.1 Introduction
7.2 Hardware
7.2.1 Electrodes
7.2.2 Cleaver
7.2.3 Sheath Clamps
7.2.4 Batteries and Power Chords
7.2.5 Tube Heater
7.2.6 Stripper
7.2.7 Display and Microscope
7.2.8 Heating Element
7.2.8.1 Electric Arc
7.2.8.2 Co2 Laser
7.2.8.3 Gas Flames
7.2.8.4 Nichrome Wire
7.2.9 Others
7.3 Software & Services
8 Market, By Alignment Type (Page No. - 57)
8.1 Introduction
8.2 Core Alignment
8.3 Cladding Alignment
9 Fusion Splicer Market, By Application (Page No. - 64)
9.1 Introduction
9.2 Telecommunications
9.3 Enterprise
9.4 Cable TV
9.5 Aerospace and Defense
9.6 Specialty
10 Geographic Analysis (Page No. - 82)
10.1 Introduction
10.2 Americas
10.2.1 Focusing on Expansion of Infrastructure in Terms of Capacity
10.2.2 North America
10.2.2.1 Increasing Demand for the Data Centers
10.2.2.2 US
10.2.2.2.1 Increasing Deployment of Broadband and Wireless Network
10.2.2.3 Rest of North America
10.2.2.3.1 High Demand for Fiber Optic Network for Household and Official Purpose
10.2.3 South America
10.2.3.1 Expansion of Internet Connectivity
10.2.3.2 Brazil
10.2.3.2.1 Increasing Deployment of Fiber Optic TV
10.2.3.3 Rest of South America
10.2.3.3.1 Increasing Investment in Communication Infrastructure
10.3 Europe
10.3.1 Growing Fiber Optic Network
10.3.2 Germany
10.3.2.1 Strong Support From the Government Helps in the Faster Growth of the Fusion Splicer Market
10.3.3 UK
10.3.3.1 Expansion in the Ftth Network
10.3.4 France
10.3.4.1 Several Initiatives Taken By the Private Companies
10.3.5 Spain
10.3.5.1 Increase in Number of Projects in the Fiber Optic Network
10.3.6 Rest of Europe
10.3.6.1 Large Deployment of Ftth
10.4 Asia Pacific
10.4.1 Largest Hub for Consumer Electronics and Optical Fiber Network
10.4.2 China
10.4.2.1 Increasing Deployment of Fiber Optic Network
10.4.3 Japan
10.4.3.1 Huge Investment for the Expansion of Fiber Optic Network
10.4.4 India
10.4.4.1 Several Government Initiatives Help in the Growth of the Fusion Splicer Market
10.4.5 Malaysia
10.4.5.1 Increasing Demand for the Applications Such as Cable TV and CCTV
10.4.6 Rest of APAC
10.4.6.1 Technological Innovation in Private Enterprises and Cable TV Technology
10.5 Rest of the World
10.5.1 Expansion of Various Network Such as Ipv4 and Ipv6
10.5.2 Middle East
10.5.2.1 Focusing on Fiber Optic Infrastructure
10.5.3 Africa
10.5.3.1 Several Activities Being Conducted for Awareness and Expansion of Fiber Optic
11 Competitive Landscape (Page No. - 107)
11.1 Introduction
11.2 Market Ranking Analysis: Fusion Splicer Market
11.3 Vendor Dive Overview
11.3.1 Vanguards (Leaders)
11.3.2 Dynamic
11.3.3 Innovators
11.3.4 Emerging
11.4 Competitive Benchmarking
11.4.1 Market Product Portfolio Analysis (25 Companies)
11.4.2 Market Business Strategy Analysis (25 Companies)
Top 25 Companies Analysed for This Study Are- Sumitomo Electric Industries Ltd.; Furukawa Electric Co., Ltd.; Fujikura Ltd.; Ilsintech Co., Ltd.; INNO Instruments Inc.; Darkhorsechina (Beijing) Telecom Tech. Co., Ltd.; China Electronics Technology Group Corporation; Nanjing Jilong Optical Communication Co., Ltd.; Nanjing DVP OE Tech Co., Ltd.; Shenzhen Ruiyan Communication Equipment Co., Ltd.; Signal Fire Technology Co., Ltd.; Shanghai Xianghe Optical Fiber Communication Co., Ltd.; Eloik Communication Equipment Technology Co., Ltd.; Fiber Fox, Inc.; Greenlee Communication; Comway Technology LLC; Promax Electronica Sl; Multicom, Inc.; Yamasaki Optical Technology; Deviser Technology; Easysplicer; Gao Tek & Gao Group Inc.; 3sae Technologies Inc.; Aurora Optics, Inc.; and China Web Group, Inc.
12 Company Profile (Page No. - 113)
(Business Overview, Products Offered & Services Strategies, Key Insights, Recent Developments, MnM View)*
12.1 Introduction
12.2 Sumitomo Electric Industries, Ltd.
12.3 Furukawa Electric Co., Ltd.
12.4 Fujikura Ltd.
12.5 Ilsintech Co., Ltd.
12.6 INNO Instruments, Inc.
12.7 Darkhorsechina (Beijing) Telecom. Tech. Co., Ltd.
12.8 China Electronics Technology Group Corporation
12.9 Nanjing Jilong Optical Communication Co., Ltd.
12.10 Nanjing DVP O.E. Tech. Co., Ltd.
12.11 Shenzhen Ruiyan Communication Equipment Co., Ltd.
12.12 Key Innovators and Start-Ups
12.12.1 Signal Fire Technology Co., Ltd.
12.12.2 Shanghai Xianghe Optical Fiber Communication Co., Ltd.
12.12.3 Eloik Communication Equipment Technology Co., Ltd.
12.12.4 Fiberfox, Inc.
12.12.5 Greenlee Communication
*Details on Business Overview, Products Offered & Services Strategies, Key Insights, Recent Developments, MnM View Might Not Be Captured in Case of Unlisted Companies.
13 Appendix (Page No. - 145)
13.1 Insights of Industry Experts
13.2 Discussion Guide
13.3 Knowledge Store: Marketsandmarkets’ Subscription Portal
13.4 Introducing RT: Real-Time Market Intelligence
13.5 Available Customizations
13.6 Related Reports
13.7 Author Details
List of Tables (66 Tables)
Table 1 Comparison Between Mechanical Splicing and Fusion Splicing Technique, in Terms of Costs
Table 2 Fusion Splicer Market, By Offering, 2014–2022 (USD Million)
Table 3 Market for Hardware, By Alignment Type, 2014–2022 (USD Million)
Table 4 Market for Software & Services, By Alignment Type, 2014–2022 (USD Million)
Table 5 Market, By Alignment Type, 2014–2022 (USD Million)
Table 6 Market, By Alignment Type, 2014–2022 (Units)
Table 7 Market for Core Alignment , By Application, 2014–2022 (USD Million)
Table 8 Market for Core Alignment, By Application, 2014–2022 (Units)
Table 9 Market for Core Alignment, By Offering, 2014–2022 (USD Million)
Table 10 Market for Cladding Alignment, By Application, 2014–2022 (USD Million)
Table 11 Market for Cladding Alignment, By Application, 2014–2022 (Units)
Table 12 Market for Cladding Alignment, By Offering, 2014–2022 (USD Million)
Table 13 Market, By Application, 2014–2022 (USD Million)
Table 14 Market, By Application , 2014–2022 ( Units)
Table 15 Fusion Splicer Market for Telecommunications, By Alignment Type, 2014–2022 (USD Million)
Table 16 Market for Telecommunications, By Alignment Type, 2014–2022 (Units)
Table 17 Market for Telecommunications, By Region, 2014–2022 (USD Million)
Table 18 Market for Telecommunications, By Region, 2014–2022 (Units)
Table 19 Market in Americas for Telecommunications, By Region, 2014–2022 (USD Million)
Table 20 Market in Americas for Telecommunications, By Region, 2014–2022 ( Units)
Table 21 Market for Enterprise, By Alignment Type, 2014–2022 (USD Million)
Table 22 Market for Enterprise, By Alignment Type, 2014–2022 (Units)
Table 23 Market for Enterprise, By Region , 2014–2022 (USD Million)
Table 24 Market for Enterprise, By Region , 2014–2022 (Units)
Table 25 Market in Americas for Enterprise, By Region, 2014–2022 (USD Million)
Table 26 Market in Americas for Enterprise, By Region, 2014–2022 (Units)
Table 27 Market for Cable TV, By Alignment Type, 2014–2022 (USD Million)
Table 28 Market for Cable TV, By Alignment Type, 2014–2022 (Units)
Table 29 Market for Cable TV, By Region, 2014–2022 (USD Million)
Table 30 Fusion Splicer Market for Cable TV, By Region, 2014–2022 (Units)
Table 31 Market in Americas for Cable TV, By Region, 2014–2022 (USD Million)
Table 32 Market in Americas for Cable TV, By Region, 2014–2022 (Units)
Table 33 Market for Aerospace & Defense, By Alignment Type, 2014–2022 (USD Million)
Table 34 Market for Aerospace & Defense, By Alignment Type, 2014–2022 (Units)
Table 35 Market for Aerospace & Defense, By Region, 2014–2022 (USD Thousand)
Table 36 Market for Aerospace & Defense, By Region, 2014–2022 (Units)
Table 37 Market in Americas for Aerospace & Defense, By Region, 2014–2022 (USD Thousand)
Table 38 Market in Americas for Aerospace & Defense, By Region, 2014–2022 (Unit)
Table 39 Market for Specialty, By Alignment Type, 2014–2022 (USD Million)
Table 40 Market for Specialty, By Alignment Type, 2014–2022 (Units)
Table 41 Market for Specialty, By Region, 2014–2022 (USD Million)
Table 42 Market for Specialty, By Region, 2014–2022 (Units)
Table 43 Market in Americas for Specialty, By Region, 2014–2022 (USD Million)
Table 44 Market in Americas for Specialty, By Region, 2014–2022 (Units)
Table 45 Market, By Region, 2014–2022 (USD Million)
Table 46 Market, By Region, 2014–2022 (Units)
Table 47 Fusion Splicer Market in Americas, By Application, 2014–2022 (USD Million)
Table 48 Market in Americas, By Application, 2014–2022 (Units)
Table 49 Market in Americas, By Region, 2014–2022 (USD Million)
Table 50 Market in Americas, By Region, 2014–2022 (Units)
Table 51 Market in North America, By Application, 2014–2022 (USD Million)
Table 52 Market in North America, By Application, 2014–2022 (Units)
Table 53 Market in North America, By Country, 2014–2022 (USD Million)
Table 54 Market in South America, By Application, 2014–2022 (USD Thousand)
Table 55 Market in South America, By Application, 2014–2022 (Units)
Table 56 Market in South America, By Country, 2014–2022 (USD Million)
Table 57 Market in Europe, By Application, 2014–2022 (USD Million)
Table 58 Market in Europe, By Application, 2014–2022 (Units)
Table 59 Market in Europe, By Country, 2014–2022 (USD Million)
Table 60 Market in APAC, By Application, 2014–2022 (USD Million)
Table 61 Market in APAC, By Application, 2014–2022 (Units)
Table 62 Market in APAC, By Country, 2014–2022 (USD Million)
Table 63 Market in RoW, By Application, 2014–2022 (USD Thousand)
Table 64 Fusion Splicer Market in RoW, By Application, 2014–2022 (Units)
Table 65 Market in RoW, By Region, 2014–2022 (USD Million)
Table 66 Market Ranking of the Top 5 Players in the Fusion Splicer Market, 2016
List of Figures (66 Figures)
Figure 1 Fusion Splicer Market: Research Design
Figure 2 Market Size Estimation Methodology: Bottom-Up Approach
Figure 3 Major Players Comprising Each Stage of Value Chain
Figure 4 Market Size Estimation Methodology: Top-Down Approach
Figure 5 Data Triangulation
Figure 6 Fusion Splicer Market for Enterprise Application Expected to Grow at the Highest Rate Between 2017 and 2022
Figure 7 Market for Software & Services Based on Cladding Alignment Type to Grow at A Higher Rate During the Forecast Period
Figure 8 Market for Enterprise Application in APAC to Grow at the Highest Rate During the Forecast Period
Figure 9 Market for Telecommunications Based on Cladding Alignment Type to Grow at A Higher Rate During the Forecast Period
Figure 10 Market in APAC Expected to Grow at the Highest Rate Between 2017 and 2022
Figure 11 Significant Increase in the Number of Cladding Alignment Type Fusion Splicer Expected to Drive the Growth of the Market During the Forecast Period
Figure 12 Software & Services to Grow at A Higher Rate in the Fusion Splicer Market During the Forecast Period
Figure 13 India Expected to Witness the Highest Growth Rate During the Forecast Period
Figure 14 Telecommunications Estimated to Hold the Largest Market Share in APAC in 2017
Figure 15 Cladding Alignment Type Estimated to Grow at A Higher Rate Between 2017 and 2022
Figure 16 High Demand for Increased Bandwidth Expected to Drive the Growth of the Fusion Splicer Market
Figure 17 Worldwide International Bandwidth Growth, 2011-2015
Figure 18 Telecom Industry in India
Figure 19 Major Value Added During the Hardware and Software Provider and System Integrator Phase
Figure 20 Fusion Splicer Market Segmentation, By Offering
Figure 21 Cladding Alignment Type is Expected to Grow at A Higher Rate in the Fusion Splicer Market for Software & Services During the Forecast Period
Figure 22 Fusion Splicer Market Segmentation, By Alignment Type
Figure 23 Software & Services is Expected to Grow at A Higher Rate in the Fusion Splicer Market for Core Alignment
Figure 24 Telecommunications is Expected to Grow at the Highest Rate in the Fusion Splicer Market for Cladding Alignment During the Forecast Period
Figure 25 Fusion Splicer Market Segmentation, By Application
Figure 26 South America is Expected to Grow at A Higher Rate in the Fusion Splicer Market for Telecommunications Application
Figure 27 Cladding Alignment is Expected to Grow at A Higher Rate in the Market for Cable TV
Figure 28 South America is Expected to Grow at A Higher Rate in the Market for Aerospace & Defense
Figure 29 Market Segmentation: By Geography
Figure 30 Geographic Snapshot: Market in APAC Expected to Grow at the Highest Rate During the Forecast Period
Figure 31 Market in India is Estimated to Grow at the Highest Rate Between 2017 and 2022
Figure 32 Segmentation: the Americas
Figure 33 Segmentation: North America
Figure 34 Rest of South America is Expected to Grow at A Higher Rate in the Fusion Splicer Market
Figure 35 Segmentation: South America
Figure 36 Segmentation: Europe
Figure 37 Europe: Fusion Splicer Market Snapshot
Figure 38 Segmentation: APAC
Figure 39 APAC: Market Snapshot
Figure 40 Segmentation: RoW
Figure 41 Key Growth Strategies Adopted By Top Companies, 2014–2017
Figure 42 Dive Chart
Figure 43 Geographic Revenue Mix of Top Market Players
Figure 44 Sumitomo Electric Industries, Ltd.: Company Snapshot
Figure 45 Sumitomo Electric Industries, Ltd.: Product Offering Scorecard
Figure 46 Sumitomo Electric Industries, Ltd.: Business Strategy Scorecard
Figure 47 Furukawa Electric Co., Ltd.: Company Snapshot
Figure 48 Furukawa Electric Co., Ltd.: Product Offering Scorecard
Figure 49 Furukawa Electric Co., Ltd.: Business Strategy Scorecard
Figure 50 Fujikura Ltd.: Company Snapshot
Figure 51 Fujikura Ltd.: Product Offering Scorecard
Figure 52 Fujikura Ltd.: Business Strategy Scorecard
Figure 53 Ilsintech Co., Ltd: Product Offering Scorecard
Figure 54 Ilsintech Co., Ltd: Business Strategy Scorecard
Figure 55 INNO Instruments, Inc.: Product Offering Scorecard
Figure 56 INNO Instruments, Inc.: Business Strategy Scorecard
Figure 57 Darkhorsechina (Beijing) Telecom. Tech. Co., Ltd.: Product Offering Scorecard
Figure 58 Darkhorsechina (Beijing) Telecom. Tech. Co., Ltd.: Business Strategy Scorecard
Figure 59 China Electronics Technology Group Corporation: Product Offering Scorecard
Figure 60 China Electronics Technology Group Corporation: Business Strategy Scorecard
Figure 61 Nanjing Jilong Optical Communication Co., Ltd.: Product Offering Scorecard
Figure 62 Nanjing Jilong Optical Communication Co., Ltd.: Business Strategy Scorecard
Figure 63 Nanjing DVP O.E. Tech Co., Ltd.: Product Offering Scorecard
Figure 64 Nanjing DVP OE Tech Co., Ltd.: Business Strategy Scorecard
Figure 65 Shenzhen Ruiyan Communication Equipment Co., Ltd.: Product Offering Scorecard
Figure 66 Shenzhen Ruiyan Communication Equipment Co., Ltd.: Business Strategy Scorecard
The research methodology used to estimate and forecast the fusion splicer market begins with obtaining data on key vendor revenues through secondary research such as Fiber Optic Association, Inc. and Fibreoptic Industry Association. The vendor offerings have been taken into consideration to determine the market segmentation. The top-down procedure has been employed to arrive at the overall size of the market. After arriving at the overall market size, the total market has been split into several segments and subsegments, which have been verified through primary research by conducting extensive interviews with key experts such as CEOs, VPs, directors, and executives. The data triangulation and market breakdown procedures have been employed to complete the overall market engineering process and arrive at the exact statistics for all segments and subsegments.
To know about the assumptions considered for the study, download the pdf brochure
Market Ecosystem:
The fusion splicer market comprises hardware and software providers, and system integrators.
- Hardware Providers: AFL (Australia), PROMAX Electronica SL (Spain), Multicom, Inc. (US), Yamasaki Optical Technology (Australia), Deviser Technology (UK), EasySplicer (Sweden), GAO Tek & GAO Group Inc. (US), 3SAE Technologies (US).
- Software Providers: Signal Fire Technology Co., Ltd. (China), ILSINTECH (Korea), Fujikura ltd (Japan), 3SAE Technologies, Incorporated (US), Vytran LLC (UK).
- Complete Solution Providers: Sumitomo Electric Industries (SEI) (Japan), Furukawa Electric Co Ltd (Japan), Fujikura ltd (Japan), ILSINTECH (Korea), INNO Instruments (Korea), Darkhorsechina (Beijing) Telecom. Tech. Co., Ltd. (China), CETC, Nanjing Jilong Optical Communication Co., Ltd (China).
Target Audience:
- Raw material and equipment suppliers
- Hardware providers
- Service providers
- Fusion splicer systems integrators and developers
- Fiber optic cable providers
- Government agencies
- Distributors
- Investor community
- End users
This study also answers several questions for the stakeholders, such as which market segments to focus on in the next two to five years for prioritizing the efforts and investments.
Scope of the Report:
The overall fusion splicer market has been segmented on the basis of offering, alignment type, application, and geography.
Fusion Splicer Market, by Offering
- Hardware
- Software & Services
Market, by Alignment Type
- Core Alignment
- Cladding Alignment
Fusion Splicer Market, by Application
- Telecommunication
- Cable TV
- Enterprise
- Aerospace & Defense
- Specialty
Market, by Geography
- Americas
- Europe
- APAC
- RoW
Available Customizations:
With the given market data, MarketsandMarkets offers customizations according to the company’s specific needs. The following customization options are available for the report:
-
Geographic Analysis
- Comprehensive coverage of regulations followed in each region (the Americas, APAC, Europe, and RoW)
-
Company Information
- Detailed analysis and profiling of additional market players (up to five)


Growth opportunities and latent adjacency in Fusion Splicer Market
Interest in current market share and expect forecast for the coming 1 year, 3 years and 5 years of Fusion Splicer market growth and number of units.