Flavored Syrups Market by Flavor (Fruit, Chocolate, Vanilla, Coffee, Herbs & Seasoning), Flavor Type (Sweet, Salty, Savory, Sour, Mint), Application (Beverage, Dairy & Frozen Dessert, Confectionery, Bakery), & by Region - Global Forecast to 2021


The flavored syrups market is estimated to be valued at USD 42.27 Billion in 2016. The market is projected to grow at a CAGR of 4.0% from 2016, to reach USD 51.31 Billion by 2021. The market for flavored syrups is segmented on the basis of type, application, flavor, and region. In 2015, the fruit flavored syrups segment accounted for the largest share of the market for flavored syrups during the forecast period. In addition, the market for flavored syrups is expected to grow due to increasing consumer demand for a variety of flavors in food products and personalized flavor options and product variety. Other factors driving the market growth include increasing consumer preference towards convenience foods & ready-to-eat products. The base year considered for this report is 2015 and the forecast period is from 2016 to 2021.
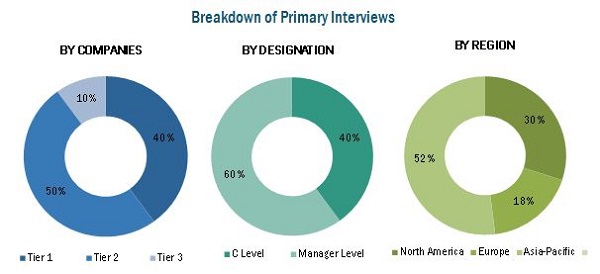
This research study involves the extensive usage of secondary sources to identify and collect information useful for this technical, market-oriented, and commercial study of the flavored syrups market. The primary sources are mainly several industry experts from core and related industries and preferred suppliers, manufacturers, distributors, service providers, reimbursement providers, technology developers, alliances, and standard and certification organizations related to all the segments of this industry�s value chain. In-depth interviews have been conducted with various primary respondents, including key industry participants, subject matter experts (SMEs), C-level executives of key market players, and industry consultants among other experts to obtain and verify critical qualitative and quantitative information as well as to assess future prospects.
To know about the assumptions considered for the study, download the pdf brochure
Target Audience:
The stakeholders for the report includes:
- Food & beverage manufacturers
- Flavored syrups manufacturers
- Research institutions
- Raw material suppliers
- Wholesalers
- Government bodies
- Institutions
Scope of the Report:
This study includes analysis of value chain, Porter�s Five Forces model, and competitive landscape, market dynamics, market estimates in terms of value, volume, and future trends in the flavored syrups market. This report categorizes the global market for market for flavored syrups on the basis of type, application, flavor, and region.
On the basis of Flavor, the market is segmented as follows:
- Fruit
- Chocolate
- Vanilla
- Coffee
- Herbs & Seasonings
- Others (nuts, floral, and confectionery)
On the basis of Application, the market is segmented as follows:
- Beverages
- Dairy & Frozen Desserts
- Confectionery
- Bakery
On the basis of Flavor Type, the market is segmented as follows:
- Sweet
- Salty
- Sour
- Savory
- Mint
On the basis of Region, the market is segmented as follows:
- North America
- Europe
- Asia-Pacific
- RoW
Available Customizations
With the given market data, MarketsandMarkets offers customizations according to the company�s specific needs.
The following customization options are available for the report:
Product Analysis
- Product matrix, which gives a detailed comparison of the product portfolio of each company
Company Information
- Detailed analysis and profiling of additional market players (up to five)
The market size is projected to reach USD 51.31 Billion by 2021, at a CAGR of around 4.0% from 2016 to 2021. The global flavored syrups market has grown exponentially in the last few years. Emerging countries such as China, Thailand, and Singapore are the primary targets of the industry. Increasing consumer demand for a variety of flavors in food products, personalized flavor options and product variety, and increasing consumer preference towards convenience foods & ready-to-eat products are some of the major driving factors for this market.
On the basis of type, the global market based on type is segmented into fruits, chocolate, vanilla, coffee, herbs & seasonings, and others (nuts, floral, and confectionery). Fruit flavored syrups accounted for the largest market share in 2015 followed by chocolate flavored syrups which is projected to grow at the highest CAGR during the forecast period due to its industrial application in bakery products, production of chocolate-flavored dairy drinks, frozen desserts, ice creams, chocolate confectionery, and chocolate-flavored beverages. Furthermore, the growing level of consumer demand for chocolate has boosted the consumption of chocolate flavors and their usage in a diverse range of food products as chocolate syrups are widely preferred by the final consumers in milkshakes, cold beverages, hot beverages such as tea and coffee, and as a topping on ice creams, pancakes, waffles, and cakes.
The global market, based on application, is segmented into beverages, dairy & frozen desserts, confectionery, and bakery. Beverages accounted for the largest share of this market in 2015. Beverage application in the flavored syrups market is growing as they are largely used in producing cold beverages such as iced tea, flavored sodas, mochas, and to make customized cocktails & mock tails at food service outlets. Furthermore, there is an increasing trend of using flavored syrups in hot beverages such as tea and coffee (lattes) to provide flavor variations to consumers to meet their tastes and preferences.
On the basis of flavor type, the market is segmented into sweet, salty, sour, savory, and mint. The sweet form accounted for the largest market share in 2015. The savory form is projected to grow at the highest CAGR from 2016 to 2021. The importance of savory flavor is increasing as its application has expanded beyond beverages and are now commonly used in meat recipes, salad dressings, and for the preparation of cupcakes & pancakes in bakery items among other applications. Savory flavored syrups, such as spicy and herb, are also increasingly used in food applications.
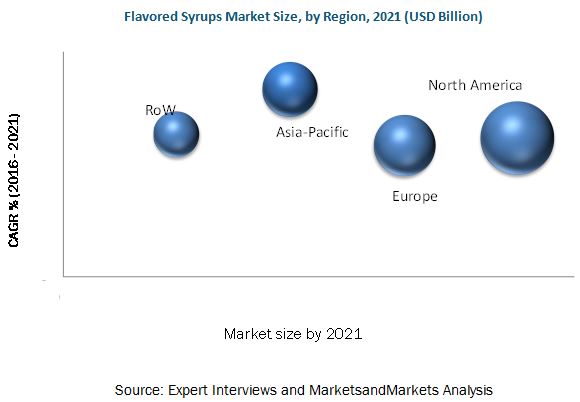
Asia-Pacific is projected to grow at the highest CAGR during the forecast period. Diverse food habits, increasing popularity of the varieties of flavors in food products, and rising disposable income are some of the factors driving this market.
The flavored syrups market is highly competitive and concentrated due to the presence of a number of large- and small-scale firms. Acquisitions, new product developments, and expansions & investments are the key strategies adopted by market players to ensure their growth in the market. Players such as Sensient Technologies Corporation (U.S.), Monin Inc. (France), Kerry Group plc (Ireland), The Hershey Company (U.S), and Tate & Lyle (U.K) collectively accounted for the largest portion of the flavored syrups market in 2015. Other players such as R. Torre & Company (U.S.), Fuerst Day Lawson (U.K.), Sensory Effects (U.S.), Concord Foods (U.S.), NutriFood (U.S.), Mitr Phol Group (Thailand), and Toschi Vignola (Italy) also have a strong presence in this market.
To speak to our analyst for a discussion on the above findings, click Speak to Analyst
 Exclusive indicates content/data unique to MarketsandMarkets and not available with any competitors.
Table of Contents
1 Introduction (Page No. - 14)
1.1 Objectives of The Study
1.2 Market Definition
1.3 Study Scope
1.3.1 Markets Covered
1.3.2 Geographic Scope
1.3.3 Periodization Considered for The Study
1.4 Currency Considered for The Study
1.5 Stakeholders
1.6 Limitations
2 Research Methodology (Page No. - 20)
2.1 Research Data
2.1.1 Secondary Data
2.1.1.1 Key Data From Secondary Sources
2.1.2 Primary Data
2.1.2.1 Key Data From Primary Sources
2.1.2.1.1 Breakdown of Primaries
2.2 Factor Analysis
2.2.1 Introduction
2.2.2 Demand-Side Analysis
2.2.2.1 Growth in The Global Beverage and Dairy Industry
2.2.2.2 Rising Demand for Bakery Products
2.2.2.3 Increasing Sales of Confectionery Products
2.2.3 Supply-Side Analysis
2.2.3.1 Raw Material Prices (High-Fructose Corn Syrup)
2.3 Market Size Estimation
2.4 Market Breakdown & Data Triangulation
2.5 Research Assumptions
3 Executive Summary (Page No. - 33)
4 Premium Insights (Page No. - 37)
4.1 Opportunities in this Market
4.2 Key Flavored Syrups Markets, 2016
4.3 Life Cycle Analysis: Flavored Syrups Market, By Region, 2015
4.4 Flavored Syrups Market, By Type, 2016 vs 2021
4.5 Asia-Pacific Flavored Syrups Market, By Application & Region, 2015
4.6 Developed vs Emerging Flavored Syrups Markets, 2016 vs 2021
4.7 Market Size for Flavored Syrups, By Flavor, 2016�2020 (USD Billion)
4.8 Market for Flavored Syrups, By Application & Region, 2015
5 Market Overview (Page No. - 44)
5.1 Introduction
5.2 Market Segmentation
5.2.1 By Flavor
5.2.2 By Flavor Type
5.2.3 By Application
5.3 Market Dynamics
5.3.1 Drivers
5.3.1.1 Increasing Consumer Demand for A Variety of Flavors in Food Products
5.3.1.2 Personalized Flavor Options and Product Variety to Boost The Sale of Flavored Syrups
5.3.1.3 Increasing Consumer Preference Towards Convenience Foods & Ready-To-Eat Products
5.3.2 Restraints
5.3.2.1 Health-Related Issues Associated With The Consumption of Sugar-Based Syrups
5.3.2.2 Shifting Preference of Consumers Towards Substitute Products Such as Organic Maple Syrup
5.3.2.3 Adverse Health Effects of Synthetic Additives Used in Flavored Syrups
5.3.3 Opportunities
5.3.3.1 Consumer Inclination Towards Natural and Organic Products
5.3.3.2 Development of New Food Applications
5.3.4 Challenges
5.3.4.1 Consumer Perception With Regard to The Heath-Related Issues Associated With Hfcs
6 Industry Trends (Page No. - 55)
6.1 Introduction
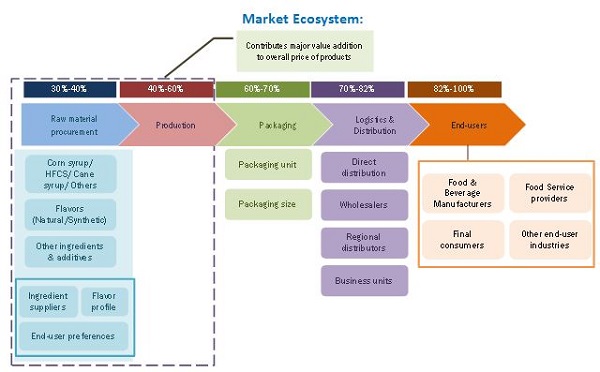
6.2 Value Chain Analysis
6.3 Supply Chain Analysis
6.4 Porter�s Five Forces Analysis
6.4.1 Threat of New Entrants
6.4.2 Threat of Substitutes
6.4.3 Bargaining Power of Suppliers
6.4.4 Bargaining Power of Buyers
6.4.5 Intensity of Competitive Rivalry
6.5 Regulations Affecting Flavored Syrups Market
6.5.1 Flavors
6.5.2 Colors
6.5.3 Sweeteners
6.5.4 Preservatives
6.6 Trade Data
6.6.1 Europe
6.6.2 U.S.
6.6.3 Canada
7 Flavored Syrups Market, By Flavor (Page No. - 65)
7.1 Introduction
7.2 Fruit
7.3 Chocolate
7.4 Vanilla
7.5 Coffee
7.6 Herbs & Seasonings
7.7 Others
8 Flavored Syrups Market, By Flavor Type (Page No. - 74)
8.1 Introduction
8.2 Sweet
8.3 Salty
8.4 Savory
8.5 Sour
8.6 Mint
9 Flavored Syrups Market, By Application (Page No. - 79)
9.1 Introduction
9.2 Beverage
9.3 Dairy & Frozen Desserts
9.4 Confectionery
9.5 Bakery
10 Flavored Syrups Market, By Brand (Page No. - 87)
10.1 Introduction
10.2 The Hershey Company
10.2.1 Hershey�s Chocolate Syrup
10.2.2 Hershey�s Strawberry Syrup
10.2.3 Hershey�s Caramel Syrup
10.3 Monin
10.4 Torani
10.5 Tate & Lyle
10.5.1 Caramel Pure Cane Syrup
10.5.2 Vanilla Pure Cane Syrup
10.5.3 Hazelnut Pure Cane Syrup
10.5.4 Zero Calorie Vanilla Syrup
10.6 Fuerst Day Lawson
10.7 Concord Foods
10.8 Kerry Group
11 Flavored Syrups Market, By Region (Page No. - 90)
11.1 Introduction
11.2 North America
11.2.1 U.S.
11.2.2 Canada
11.2.3 Mexico
11.3 Europe
11.3.1 Germany
11.3.2 France
11.3.3 U.K.
11.3.4 Italy
11.3.5 Spain
11.3.6 Rest of Europe
11.4 Asia-Pacific
11.4.1 China
11.4.2 Australia & New Zealand
11.4.3 Japan
11.4.4 India
11.4.5 Philippines
11.4.6 Thailand
11.4.7 Singapore
11.4.8 South Korea
11.4.9 Rest of Asia-Pacific
11.5 Rest of The World (RoW)
11.5.1 Latin America
11.5.2 Middle East
11.5.2.1 UAE
11.5.3 Africa
12 Competitive Landscape (Page No. - 125)
12.1 Overview
12.2 Flavored Syrups Market: Growth Strategies, By Company
12.3 Competitive Situation & Trends
12.4 Expansions & Investments
12.5 New Product Launches
12.6 Acquisitions
12.7 Joint Ventures & Agreement
13 Company Profiles (Page No. - 132)
(Company at A Glance, Business Overview, Products Offered, Key Strategy, Recent Developments, SWOT Analysis & MnM View)*
13.1 Introduction
13.2 Sensient Technologies Corporation
13.3 Kerry Group PLC
13.4 Sensoryeffects Flavor Systems
13.5 Concord Foods
13.6 Fuerst Day Lawson Ltd.
13.7 The Hershey Company
13.8 Monin Inc.
13.9 R. Torre & Company Inc.
13.10 Tate & Lyle
13.11 Toschi Vignola
13.12 Mitr Phol Group
13.13 Nutrifood
*Details on Company at A Glance, Recent Financials, Products Offered, Strategies & Insights, & Recent Developments Might Not Be Captured in Case of Unlisted Companies.
14 Appendix (Page No. - 158)
14.1 Industry Insights
14.2 Discussion Guide
14.3 Knowledge Store: Marketsandmarkets� Subscription Portal
14.4 Other Company Developments
14.4.1 New Product Launches & Approvals
14.4.2 Expansions & Investments
14.4.3 Acquisitions & Strategic Alliance
14.5 Introducing RT: Real Time Market Intelligence
14.6 Available Customizations
14.7 Related Reports
List of Tables (76 Tables)
Table 1 Top Five Consumers of Canadian Maple Syrup, 2010�2014 (Kt)
Table 2 Trade Between Eu and Non-Eu Countries for Flavored Or Colored Isoglucose (High Fructose Corn Syrup) Syrups, 2010-2015
Table 3 Trade Between U.S. and Rest of The World for Flavoring Syrups and Concentrate Manufacturing, 2011-2015 (Thousands of Dollars)
Table 4 Trade Between Canada and Rest of The World for Flavoring Syrups and Concentrate Manufacturing, 2011-2015 (Value in Thousands of Canadian Dollars)
Table 5 Market Size for Flavored Syrups, By Type, 2014�2021 (USD Billion)
Table 6 Fruit Flavored Syrups Market Size, By Application, 2014�2021 (USD Billion)
Table 7 Fruit Flavored Syrups Market Size, By Region, 2014�2021 (USD Billion)
Table 8 Chocolate Flavored Syrups Market Size, By Application, 2014�2021 (USD Billion)
Table 9 Market Size for Chocolate Flavored Syrups, By Region, 2014�2021 (USD Billion)
Table 10 Vanilla Flavored Syrups Market Size, By Application, 2014�2021 (USD Billion)
Table 11 Market Size for Vanilla Flavored Syrups, By Region, 2014�2021 (USD Billion)
Table 12 Coffee Flavored Syrups Market Size, By Application, 2014�2021 (USD Billion)
Table 13 Market Size for Coffee Flavored Syrups, By Region, 2014�2021 (USD Billion)
Table 14 Herb & Seasoning Flavored Syrups Market Size, By Application, 2014�2021 (USD Billion)
Table 15 Herb & Seasoning Flavored Syrups Market Size, By Region, 2014�2021 (USD Billion)
Table 16 Other Flavored Syrups Market Size, By Application, 2014�2021 (USD Billion)
Table 17 Other Flavored Syrups Market Size, By Region, 2014�2021 (USD Billion)
Table 18 Market Size for Flavored Syrups, By Flavor Type, 2014�2021 (USD Billion)
Table 19 Sweet Flavored Syrups & Their Use in Food Products
Table 20 Salt Flavored Syrups & Their Use in Food Products
Table 21 Savory Flavored Syrups & Their Use in Food Products
Table 22 Sour Flavored Syrups & Their Use in Food Products
Table 23 Mint Flavored Syrups & Their Use in Food Products
Table 24 Market Size for Flavored Syrups, By Application, 2014-2021 (USD Billion)
Table 25 Beverages: Flavored Syrups Market Size, By Region, 2014-2021 (USD Billion)
Table 26 Flavored Syrups in Beverages Market Size, By Type, 2014-2021 (USD Billion)
Table 27 Dairy & Frozen Desserts: Market Size for Flavored Syrups, By Region, 2014-2021 (USD Billion)
Table 28 Flavored Syrups in Dairy & Frozen Desserts Market Size, By Type, 2014-2021 (USD Billion)
Table 29 Confectionery: Flavored Syrups Market Size, By Region, 2014-2021 (USD Billion)
Table 30 Flavored Syrups in Confectionery Market Size, By Type, 2014-2021 (USD Billion)
Table 31 Bakery: Market Size for Flavored Syrups, By Region, 2014-2021 (USD Billion)
Table 32 Flavored Syrups in Bakery Market Size, By Type, 2014-2021 (USD Billion)
Table 33 Market Size for Flavored Syrups, By Region, 2014-2021 (USD Billion)
Table 34 North America: Flavored Syrups Market Size, By Country, 2014-2021 (USD Billion)
Table 35 North America: Market Size for Flavored Syrups, By Application, 2014-2021 (USD Billion)
Table 36 North America: Flavored Syrups in Beverages Market Size, By Type, 2014-2021 (USD Billion)
Table 37 U.S.: Flavored Syrups Market Size, By Application, 2014-2021 (USD Billion)
Table 38 Canada: Market Size for Flavored Syrups, By Application, 2014-2021 (USD Billion)
Table 39 Mexico: Market Size, By Application, 2014-2021 (USD Billion)
Table 40 Europe: Flavored Syrups Market Size, By Country, 2014-2021 (USD Billion)
Table 41 Europe: Market Size, By Country, 2014-2021 (USD Billion)
Table 42 Europe: Flavored Syrups in Dairy & Frozen Desserts Market Size, By Type, 2014-2021 (USD Billion)
Table 43 Germany: Market Size, By Application, 2014-2021 (USD Billion)
Table 44 France: Market Size, By Application, 2014-2021 (USD Billion)
Table 45 U.K.: Market Size, By Application, 2014-2021 (USD Billion)
Table 46 Italy: Market Size, By Application, 2014-2021 (USD Billion)
Table 47 Spain: Market Size, By Food Application, 2014-2021 (USD Billion)
Table 48 Rest of Europe Market Size for Flavored Syrups, By Application, 2014-2021 (USD Billion)
Table 49 Asia-Pacific: Flavored Syrups Market Size, By Country, 2014-2021 (USD Billion)
Table 50 Rest of Asia-Pacific: Market Size, By Country, 2014-2021 (USD Million)
Table 51 Asia-Pacific: Market Size, By Application, 2014-2021 (USD Billion)
Table 52 Asia-Pacific: Flavored Syrups in Confectionery Market Size, By Type, 2014-2021 (USD Billion)
Table 53 China: Market Size for Flavored Syrups, By Application, 2014-2021 (USD Billion)
Table 54 Australia & New Zealand: Flavored Syrups Market Size, By Application, 2014-2021 (USD Billion)
Table 55 Japan: Flavored Syrups Market Size, By Application, 2014-2021 (USD Billion)
Table 56 India: Market Size, By Application, 2014-2021 (USD Billion)
Table 57 Philippines: Market Size, By Application, 2014-2021 (USD Billion)
Table 58 Thailand: Market Size, By Application, 2014-2021 (USD Million)
Table 59 Singapore: Market Size for Flavored Syrups, By Application, 2014-2021 (USD Million)
Table 60 South Korea: Market Size, By Application, 2014-2021 (USD Million)
Table 61 Rest of Asia-Pacific: Flavored Syrups Market Size, By Application, 2014-2021 (USD Billion)
Table 62 RoW: Market Size, By Region, 2014-2021 (USD Billion)
Table 63 RoW: Market Size, By Application, 2014-2021 (USD Billion)
Table 64 RoW: Flavored Syrups in Bakery Market Size, By Type, 2014-2021 (USD Billion)
Table 65 Latin America: Market Size for Flavored Syrups, By Application, 2014-2021 (USD Billion)
Table 66 Middle East: Market Size, By Country, 2014-2021 (USD Million)
Table 67 Middle East: Market Size, By Application, 2014-2021 (USD Billion)
Table 68 UAE: Flavored Syrups Market Size, By Application, 2014-2021 (USD Million)
Table 69 Africa: Market Size, By Application, 2014-2021 (USD Billion)
Table 70 Expansions & Investments, 2013-2015
Table 71 New Product Launches, 2015�2016
Table 72 Acquisitions, 2012�2016
Table 73 Joint Ventures & Agreement, 2014
Table 74 New Product Launches & Approvals, 2011�2016
Table 75 Expansions & Investments, 2011�2016
Table 76 Acquisitions & Strategic Alliance, 2011�2015
List of Figures (48 Figures)
Figure 1 Market Snapshot: Flavored Syrups
Figure 2 Flavored Syrups Market, By Region
Figure 3 Flavored Syrups: Research Design
Figure 4 Growth Rate of Global Beverage Sales, 2011�2016
Figure 5 Annual Per Capita Consumption of Dairy Products and Flavored Milk & Drinks in U.S., 2011�2016 (Pounds)
Figure 6 Annual Bakery Products Market Size, 2010�2015 (USD Billion)
Figure 7 Global Growth in Sale of Confectionery Products, By Region, 2013�2015 (USD Billion)
Figure 8 High-Fructose Corn Syrup, Price Trend, 2000�2015
Figure 9 Market Size Estimation Methodology: Bottom-Up Approach
Figure 10 Market Size Estimation Methodology: Top-Down Approach
Figure 11 Data Triangulation Methodology
Figure 12 Flavored Syrups Market Snapshot, By Type, 2016 vs 2021 (USD Billion)
Figure 13 The Asia-Pacific Market for Flavored Syrups is Projected to Grow at The Highest Rate, 2016�2021
Figure 14 Market Size for Flavored Syrups, By Type, 2016�2021 (USD Billion)
Figure 15 Market Share (Value), By Region, 2016
Figure 16 Consumer Demand for Flavor Varieties in Food Products and Personalized Flavor Options to Drive Growth of Flavored Syrups Market
Figure 17 Emerging Markets in Asia-Pacific & RoW Poised for High Growth From 2016
Figure 18 Asia-Pacific Market Poised for Robust Growth, 2016 to 2021
Figure 19 The Market for Chocolate Flavored Syrups is Projected to Record High Growth Between 2016 & 2021
Figure 20 Beverages Segment Dominated The Asia-Pacific Market in 2015
Figure 21 Emerging Economies are Projected to Drive The Consumption of Flavored Syrups During The Forecast Period
Figure 22 Savory Flavors Segment Projected to Grow at The Highest Rate From 2016 to 2021
Figure 23 Dairy & Frozen Desserts Segment Poised for Significant Growth in this Market, 2016�2020
Figure 24 Flavored Syrups Market, By Flavor
Figure 25 Market, By Flavor Type
Figure 26 Market, By Application
Figure 27 Market Dynamics
Figure 28 Largest Producers and Traders of Maple Syrups, 2009�2014
Figure 29 Value Chain: Flavored Syrups Market
Figure 30 Supply Chain: Flavored Syrups Market
Figure 31 Porter�s Five Forces Analysis
Figure 32 Flavored Syrups Market Share, By Flavor, 2016
Figure 33 Market Share, By Flavor Type, 2016
Figure 34 Market Share, By Application, 2016
Figure 35 Beverage Market Size, By Region, 2016 vs 2021
Figure 36 U.S. Held The Largest Share in this Market in 2015
Figure 37 North America Flavored Syrups Market: U.S. is Expected to Lead The Market in 2016
Figure 38 Europe Flavored Syrups Market Snapshot: U.K. is Expected to Be The Fastest Growing Country in 2015
Figure 39 Asia-Pacific Flavored Syrups Market Snapshot: Japan is Expected to Hold The Largest Share in 2016
Figure 40 Latin America Led The Flavored Syrups Market in RoW in 2015
Figure 41 Expansions & Investments and New Product Launches: Leading Approaches of Key Companies, 2011�2016
Figure 42 Expanding Revenue Base and Geographic Presence Through Expansion & Investment, 2014�2016
Figure 43 Expansions & Investments: The Key Strategy, 2011�2016
Figure 44 Geographic Revenue Mix of Top Market Players
Figure 45 Sensient Technologies Corporation: Company Snapshot
Figure 46 Kerry Group PLC: Company Snapshot
Figure 47 The Hershey Company: Company Snapshot
Figure 48 Tate & Lyle PLC: Company Snapshot


Growth opportunities and latent adjacency in Flavored Syrups Market
My company is introducing some additions to its product line and wants to expand in Africa, the Middle East, SAARC, and Southeast Asia as well. Will this Flavored Syrups Market report be useful to us?
We want a detailed sales analysis of the following regions of the syrups market as mentioned: Africa, the Middle East, and Asia.