Field-Erected Cooling Tower Market by Type (Wet, Dry, and Hybrid), Design (Natural, Forced, and Induced), End-User (Power Generation, Petrochemical and Oil & Gas, Iron & Steel and Metallurgy, Paper Mills), and Region - Global Forecasts to 2022


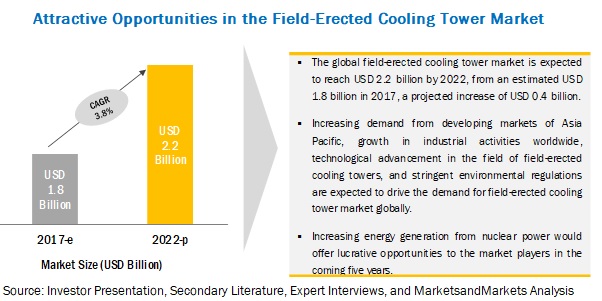
[130 Pages Report] MarketsandMarkets forecasts the field-erected cooling tower market to grow from USD 1.8 billion in 2017 to USD 2.2 billion by 2022, at a Compound Annual Growth Rate (CAGR) of 3.8% during the forecast period. Increasing demand from developing markets of Asia Pacific, growth in industrial activities worldwide, technological advancement in the field of field-erected cooling towers, and stringent environmental regulations are expected to drive the demand for field-erected cooling tower market globally. The objective of the report is to define, describe, and forecast the field-erected cooling tower market size based on type (wet, dry, and hybrid), design (natural, forced, and induced), end-user (power generation, petrochemical and oil & gas, iron & steel and metallurgy, paper mills, and others), and region.
The wet field-erected towers segment is expected to hold the largest share of the field erected cooling tower market, by type, during the forecast period.
The field-erected cooling tower market has been segmented, by type, into wet, dry, and hybrid. The wet field-erected cooling tower segment held the major market share, whereas the dry type segment is projected to witness the highest growth rate during the forecast period. This growth is due to water consumption efficiencies associated with dry type field-erected cooling towers. More industries are accepting this kind of design to align with environmental regulations within their respective countries.
The induced draft segment is the fastest growing market of the field erected cooling tower, by design, during the forecast period.
In terms of design, cooling towers by design are categorized based on the air circulation process. There are three types of design available for a cooling tower, namely, natural draft, forced draft, and induced draft. An induced draft is more efficient compared to a forced draft cooling tower. These cooling towers are used in various end-use industries such as pharmaceutical, cement industries, power generation, mining, and iron & steel industries among others.
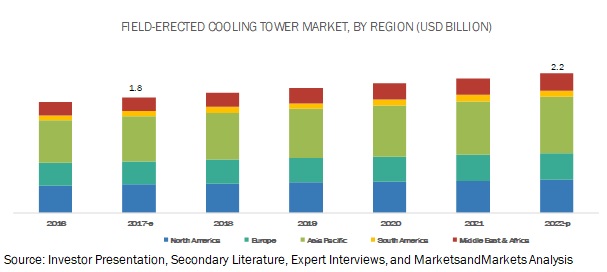
Asia-Pacific: Expected to be the leading market for field erected cooling tower during the forecast period.
China, India, and Japan are some of the key countries in the Asia-Pacific region, which accounted for majority of the field-erected cooling towers market, in 2017. Rising population, urbanization, and industrialization along with growing concerns related to infrastructure development in China and India are some of the factors that would drive the market in the region. Increasing energy demand and growing industrial activity in the region are some of the key parameters driving the market in Asia-Pacific.
Market Dynamics
Driver: Stringent environmental regulations
Process plants are under pressure to meet environmental targets. Government laws and regulations mandate the reduction of the volumes of water used for cooling and minimizing of thermal pollution by industries. For example, in cooling applications, key players help in minimizing the temperature difference between input and discharged water to meet regulations even during peak demand. Industries are supposed to provide reliable, environmentally friendly service as per government regulations.
The production of electricity, particularly by nuclear- and fossil fuel-based power plants, requires a lot of high-temperature and high-pressure steam to turn the turbine. The steam turbine rotates the electric generator�s rotor to produce electricity. The exhaust/extra steam after rotating the turbine is then cooled using either once-through or closed-loop field-erected cooling towers.
The US Environmental Protection Agency (EPA) has proposed the replacement of existing legacy cooling systems with closed loop cooling systems at chemical industries and thermal power plants. The existing systems demand significant quantities of water; closed-loop cooling systems, which reduce water inflow by over 90.0%, are replacing these existing legacy cooling systems. Thus, increasing government regulations mandating the use of closed-loop systems for cooling processes are driving the demand for field-erected cooling towers globally.
Restraint: Rise in alternative energy programs
Renewable energy is expected to be the fastest-growing source of electricity in the world. In 2015, renewables contributed to 38% of the world�s primary energy growth and 7% of the world�s electricity, according to the BP Statistical Review of World Energy 2016. Over the recent years, solar and wind energy have gained more prominence. In 2015, global investments in solar energy saw a 12% increase from the previous year to USD 161 billion and investments in wind energy increased by 4% to reach USD 109 billion, as per the United Nations Environment Program (UNEP) survey.
According to the EIA, renewable energy is projected to increase by 40% from 2012 to 2018. The BP Energy Outlook 2016 predicts that renewable energy sources would overtake natural gas generation and coal-based generation by 2035. As per the European Photovoltaic Industry Association, the total installed capacity of solar energy was 138 GW in 2013 and approximately 65 GW of capacity is expected to be installed over the next 5 years. Keeping up with this growth in renewable energy sources would prove to be a significant restraint for the existing players in the field-erected cooling tower market. Moreover, renewable energy deployment in off-grid systems is growing steadily in both developed and developing countries. Favorable government policies, declining costs, and the increasing efficiency of solar photovoltaic are also major drivers for renewable energy generation. Thus, the growth in renewable energy reduces the scope for the growth of the field-erected cooling tower market in the long term.
Opportunity: Increasing energy generation from nuclear power
Cooling towers are an essential component of a nuclear reactor; the performance of a cooling tower has significant impact on the overall efficiency and power output of a nuclear power plant. Cooling towers for nuclear power plants are primarily hybrid or wet type as they provide better efficiency. Cooling towers are used in nuclear power plants that function on high pressure and temperature applications. These are used by different nuclear processes such as closed-loop system cooling, central cooling, and moisture separator reheating.
About 11.0% of the world�s electricity is produced from nuclear power and its capacity worldwide is rising gradually; significant capacity is being further created by plant upgradation. There are about 350 nuclear power reactors operating, with over 58 reactors under construction worldwide. The widespread use of field-erected cooling towers in nuclear reactors, upgradation of existing nuclear plants, and proposed nuclear power plant projects are expected to drive the market during the forecast period. The increasing energy generation from nuclear power could also provide ample growth opportunities for the players in the field-erected cooling tower market.
Challenge: Need for large quantities of water
Field-erected cooling towers require large amounts of water for cooling and its availability is a major concern. Thermal power plants, for instance, consume large quantities of water for cooling and require a constant water source for the cooling requirements. A majority of the industries use once-through cooling systems in which water once used for cooling is discharged and is discarded. Furthermore, to initiate the cooling cycle, new water is used and again discharged. These cooling systems result in excessive water loss in industries such as oil & gas, construction, and chemicals.
Scope of the Report
|
Report Metric |
Details |
|
Market size available for years |
2015�2022 |
|
Base year considered |
2016 |
|
Forecast period |
2017�2022 |
|
Forecast units |
Billion (USD) |
|
Segments covered |
Type (Wet, Dry, and Hybrid), Design (Natural, Forced, and Induced), End-User (Power Generation, Petrochemical and Oil & Gas, Iron & Steel and Metallurgy, Paper Mills, and others), and Region |
|
Geographies covered |
North America, Europe, Asia Pacific, Middle East & Africa, and South America |
|
Companies covered |
SPX (US), Enexio (Germany), Hamon & Cie (Belgium), Baltimore Aircoil (US), Paharpur (India), Babcock & Wilcox (B&W) (US), Brentwood Industries (US), Delta Cooling Towers (US), Evapco (US), International Cooling Tower (Canada), Mesan (Hong Kong), Star Cooling Towers (India) |
The research report categorizes the field-erected cooling tower to forecast the revenues and analyze the trends in each of the following sub-segments:
Field-Erected Cooling Tower Market By Type
- Wet Field-Erected cooling Tower
- Dry Field-Erected cooling Tower
- Hybrid Field-Erected cooling Tower
Field-Erected Cooling Tower Market By Design
- Natural Draft
- Forced Draft
- Induced Draft
Field-Erected Cooling Tower Market By End-User
- Power Generation
- Petrochemical and Oil & Gas
- Iron & Steel and Metallurgy
- Paper Mills
- Others
Field-Erected Cooling Tower Market By Region
- North America
- Europe
- Asia Pacific
- Middle East & Africa
- South America
Key Market Players
SPX (US), Enexio (Germany), Hamon & Cie (Belgium), Baltimore Aircoil (US), Paharpur (India), Babcock & Wilcox (B&W) (US), Brentwood Industries (US), Delta Cooling Towers (US), Evapco (US), International Cooling Tower (Canada), Mesan (Hong Kong), Star Cooling Towers (India) are the companies profiled for field-erected cooling tower market.
SPX is one of the leading manufacturers of cooling towers, evaporative fluid coolers, evaporative condensers, and air-cooled heat exchangers. The products and services offered by the company serves the process cooling, industrial, refrigeration, and HVAC markets. The company operates its business through three segments, namely, engineered solutions, HVAC, and detection & measurement. The engineered solutions business segment offers field-erected cooling towers which accounted for 50.0% of the total net sales in 2016. The engineered solutions segment offers a wide array of product portfolio which encompasses transformers, cooling towers, heat exchangers, and critical components for grid and industrial applications. North America and South Africa is the major market for this segment. The company uses direct distribution channels (direct to customers) and third-party representatives to supply its products to the end-use industries. The process cooling products and heat exchangers are sold under the brand names of SPX Cooling, Marley, Yuba, and Ecolaire. SPX has a strong regional presence in about 15 countries. In 2016, the company has generated 83.9% of its revenue from the US market. The major competitors of SPX in the field-erected cooling tower market includes Enexio, Hamon & Cie, Thermal Engineering International, Howden Group Ltd, Siemens AG, and Alstom SA.
Recent Developments
- In December 2017, Enexio has received an order for an air-cooled condenser from the Tecnicas Reunidas, based in Madrid. The scope of the project is to supply air-cooled condenser for an 875 MW Combined Cycle Power Plant (CCPP) project in Mexico.
- In February 2017, Baltimore Aircoil introduced its new 14-foot models to the PT2 cooling tower product line. The PT2 is a counter flow cooling tower and provides an efficient solution for installations with space constraints.
- In January 2017, Baltimore Aircoil launched its new 10-foot models to the Series V closed-circuit cooling tower product line. The Series V closed-circuit cooling tower offers four new configurations (10��12�, 10��18�, 10��24�, and 10��36� box sizes) that are certified by the Cooling Technology Institute (CTI).
- In November 2016, SPX launched its new Marley CP fiberglass, induced draft, counterflow cooling tower, designed for space- and sound-sensitive applications.
- In May 2016, Hamon & Cie was awarded a contract from Jiangsu Electric Power Design Institute. The scope of the contract was to supply two natural draft cooling towers with water collecting devices for the Phase II of the Jurong coal-fired power plant.
Critical questions the report answers:
- Where will all these developments take the industry in the long term?
- What are the upcoming trends for the field-erected cooling tower market?
- Which segment provides the most opportunity for growth?
- Who are the leading vendors operating in this market?
- What are the opportunities for new market entrants?
To speak to our analyst for a discussion on the above findings, click Speak to Analyst
 Exclusive indicates content/data unique to MarketsandMarkets and not available with any competitors.
Table of Contents
1 Introduction (Page No. - 12)
1.1 Objectives of the Study
1.2 Definition
1.3 Market Scope
1.3.1 Market Segmentation
1.3.2 Regional Scope
1.4 Years Considered for the Study
1.5 Currency
1.6 Stakeholders
2 Research Methodology (Page No. - 16)
2.1 Research Data
2.1.1 Secondary Data
2.1.1.1 Secondary Sources
2.1.2 Primary Data
2.1.2.1 Key Data From Primary Sources
2.1.2.2 Key Industry Insights
2.1.2.3 Breakdown of Primaries
2.2 Market Size Estimation
2.2.1 Bottom-Up Approach
2.2.2 Top-Down Approach
2.3 Market Breakdown and Data Triangulation
2.4 Assumptions
3 Executive Summary (Page No. - 24)
4 Premium Insights (Page No. - 29)
4.1 Attractive Opportunities in the Market
4.2 Market, By Country
4.3 Asia Pacific Market, By Type & Country
4.4 Market, By Type
4.5 Market, By Design
4.6 Market, By End-User
5 Market Overview (Page No. - 34)
5.1 Introduction
5.2 Market Dynamics
5.2.1 Drivers
5.2.1.1 Stringent Environmental Regulations
5.2.1.2 Growth in Industrial Activities
5.2.1.3 Increasing Number of Natural Gas-Fired Power Plants
5.2.1.4 Growing Power Sector and Augmented Power Generation Capacities Worldwide
5.2.2 Restraints
5.2.2.1 Highly Fragmented & Competitive Industry
5.2.2.2 Rise in Alternative Energy Programs
5.2.3 Opportunities
5.2.3.1 Increasing Energy Generation From Nuclear Power
5.2.4 Challenges
5.2.4.1 Need for Large Quantities of Water
6 Market, By Type (Page No. - 39)
6.1 Introduction
6.2 Wet
6.3 Dry
6.4 Hybrid
7 Market, By Design (Page No. - 44)
7.1 Introduction
7.2 Natural Draft
7.3 Forced Draft
7.4 Induced Draft
8 Market, By End-User (Page No. - 48)
8.1 Introduction
8.2 Power Generation
8.3 Petrochemicals & Oil & Gas
8.4 Iron & Steel & Metallurgy
8.5 Paper Mills
8.6 Others
9 Market, By Region (Page No. - 56)
9.1 Introduction
9.2 North America
9.2.1 US
9.2.2 Canada
9.2.3 Mexico
9.3 Europe
9.3.1 Germany
9.3.2 France
9.3.3 Italy
9.3.4 UK
9.3.5 Russia
9.3.6 Rest of Europe
9.4 Asia Pacific
9.4.1 China
9.4.2 India
9.4.3 Japan
9.4.4 Rest of Asia Pacific
9.5 South America
9.5.1 Brazil
9.5.2 Argentina
9.5.3 Rest of South America
9.6 Middle East & Africa
9.6.1 Saudi Arabia
9.6.2 UAE
9.6.3 Kuwait
9.6.4 South Africa
9.6.5 Rest of the Middle East & Africa
10 Competitive Landscape (Page No. - 96)
10.1 Overview
10.2 Ranking of Players and Industry Concentration, 2016
10.3 Competitive Scenario
10.3.1 New Product Developments
10.3.2 Contracts & Agreements
10.3.3 New Product Developments
11 Company Profiles (Page No. - 100)
(Business Overview, Products Offered, Recent Developments & MnM View)*
11.1 Benchmarking
11.2 SPX
11.3 Enexio
11.4 Hamon & Cie
11.5 Baltimore Aircoil
11.6 Paharpur
11.7 Babcock & Wilcox (B&W)
11.8 Brentwood Industries
11.9 Delta Cooling Towers
11.10 Evapco
11.11 International Cooling Tower
11.12 Mesan
11.13 Star Cooling Towers
*Details on Business Overview, Products Offered, Recent Developments & MnM View Might Not Be Captured in Case of Unlisted Companies.
12 Appendix (Page No. - 122)
12.1 Insights of Industry Experts
12.2 Discussion Guide
12.3 Knowledge Store: Marketsandmarkets� Subscription Portal
12.4 Introducing RT: Real-Time Market Intelligence
12.5 Available Customizations
12.6 Related Reports
12.7 Author Details
List of Tables (63 Tables)
Table 1 Field-Erected Cooling Tower Market Snapshot
Table 2 Countries With the Fastest-Growing Power Generation Sectors, 2005�2015
Table 3 Market Size, By Type, 2015�2022 (USD Million)
Table 4 Wet: Market Size, By Region, 2015�2022 (USD Million)
Table 5 Dry: Market Size, By Region, 2015�2022 (USD Million)
Table 6 Hybrid: Market Size, By Region, 2015�2022 (USD Million)
Table 7 Field-Erected Market Size, By Design, 2015�2022 (USD Million)
Table 8 Natural Draft: Field-Erected Cooling Tower Market Size, By Region, 2015�2022 (USD Million)
Table 9 Forced Draft: Market Size, By Region, 2015�2022 (USD Million)
Table 10 Induced Draft: Market Size, By Region, 2015�2022 (USD Million)
Table 11 Field-Erected Tower Market Size, By End-User, 2015�2022 (USD Million)
Table 12 Power Generation, Top 5 Largest Market of Field-Erected Cooling Tower, By Country (USD Million)
Table 13 Petrochemical and Oil & Gas, Top 5 Fastest Growing Market of Field-Erected Cooling Tower, By Country (USD Million)
Table 14 Power Generation: Market Size, By Region, 2015�2022 (USD Million)
Table 15 Petrochemicals & Oil & Gas: Market Size, By Region, 2015�2022 (USD Million)
Table 16 Iron & Steel & Metallurgy: Market Size, By Region, 2015�2022 (USD Million)
Table 17 Paper Mills: Market Size, By Region, 2015�2022 (USD Million)
Table 18 Others: Market Size, By Region, 2015�2022 (USD Million)
Table 19 Field-Erected Tower Market Size, By Region, 2015�2022 (USD Million)
Table 20 Top 5 Largest Markets for Field-Erected Cooling Towers, By Country, 2015�2022 (USD Million)
Table 21 Top 5 Fastest-Growing Markets for Field-Erected Cooling Towers, By Country, 2015�2022 (USD Million)
Table 22 North America: Market Size, By Country, 2015�2022 (USD Million)
Table 23 North America: Market Size, By Type, 2015�2022 (USD Million)
Table 24 North America: Market Size, By Design, 2015�2022 (USD Million)
Table 25 North America: Market Size, By End-User, 2015�2022 (USD Million)
Table 26 US: Market Size, By End-User, 2015�2022 (USD Million)
Table 27 Canada: Market Size, By End-User, 2015�2022 (USD Million)
Table 28 Mexico: Market Size, By End-User, 2015�2022 (USD Million)
Table 29 Europe: Market Size, By Country, 2015�2022 (USD Million)
Table 30 Europe: Market Size, By Type, 2015�2022 (USD Million)
Table 31 Europe: Market Size, By Design, 2015�2022 (USD Million)
Table 32 Europe: Market Size, By End-User, 2015�2022 (USD Million)
Table 33 Germany: Market Size, By End-User, 2015�2022 (USD Million)
Table 34 France: Market Size, By End-User, 2015�2022 (USD Million)
Table 35 Italy: Market Size, By End-User, 2015�2022 (USD Million)
Table 36 UK: Market Size, By End-User, 2015�2022 (USD Million)
Table 37 Russia: Field-Erected Cooling Tower Market Size, By End-User, 2015�2022 (USD Million)
Table 38 Rest of Europe: Market Size, By End-User, 2015�2022 (USD Million)
Table 39 Asia Pacific: Market Size, By Country, 2015�2022 (USD Million)
Table 40 Asia Pacific: Market Size, By Type, 2015�2022 (USD Million)
Table 41 Asia Pacific: Market Size, By Design, 2015�2022 (USD Million)
Table 42 Asia Pacific: Market Size, By End-User, 2015�2022 (USD Million)
Table 43 China: Market Size, By End-User, 2015�2022 (USD Million)
Table 44 India: Market Size, By End-User, 2015�2022 (USD Million)
Table 45 Japan: Market Size, By End-User, 2015�2022 (USD Million)
Table 46 Rest of Asia Pacific: Market Size, By End-User, 2015�2022 (USD Million)
Table 47 South America: Market Size, By Country, 2015�2022 (USD Million)
Table 48 South America: Market Size, By Type, 2015�2022 (USD Million)
Table 49 South America: Market Size, By Design, 2015�2022 (USD Million)
Table 50 South America: Market Size, By End-User, 2015�2022 (USD Million)
Table 51 Brazil: Market Size, By End-User, 2015�2022 (USD Million)
Table 52 Argentina: Field-Erected Cooling Tower Market Size, By End-User, 2015�2022 (USD Million)
Table 53 Rest of South America: Market Size, By End-User, 2015�2022 (USD Million)
Table 54 Middle East & Africa: Market Size, By Country, 2015�2022 (USD Million)
Table 55 Middle East & Africa: Market Size, By Type, 2015�2022 (USD Million)
Table 56 Middle East & Africa: Market Size, By Design, 2015�2022 (USD Million)
Table 57 Middle East & Africa: Market Size, By End-User, 2015�2022 (USD Million)
Table 58 Saudi Arabia: Market Size, By End-User, 2015�2022 (USD Million)
Table 59 UAE: Market Size, By End-User, 2015�2022 (USD Million)
Table 60 Kuwait: Market Size, By End-User, 2015�2022 (USD Million)
Table 61 South Africa: Market Size, By End-User, 2015�2022 (USD Million)
Table 62 Rest of the Middle East & Africa: Market Size, By End-User, 2015�2022 (USD Million)
Table 63 Baltimore, the Most Active Player in the Market Between the Years 2014 and 2017
List of Figures (29 Figures)
Figure 1 Research Design
Figure 2 Market Size Estimation Methodology: Bottom-Up Approach
Figure 3 Market Size Estimation Methodology: Top-Down Approach
Figure 4 Data Triangulation Methodology
Figure 5 Asia Pacific Held the Largest Share of the Market in 2016
Figure 6 The Wet Field-Erected Cooling Towers Segment is Expected to Dominate the Market During the Forecast Period
Figure 7 The Induced Draft Segment is Expected to Be the Largest Market By 2022
Figure 8 The Power Generation Segment is Expected to Dominate the Market During the Forecast Period
Figure 9 Increase in Demand for Power and Government Regulations are Expected to Drive the Market During the Forecast Period
Figure 10 China is Expected to Grow at the Highest CAGR During the Forecast Period
Figure 11 The Wet Type Segment is Estimated to Lead the Market in Asia Pacific
Figure 12 The Wet Segment is Expected to Be the Largest Market Between 2017�2022
Figure 13 The Induced Draft Segment is Expected to Lead the Market During the Forecast Period
Figure 14 Power Generation Held the Largest Market Share in 2017
Figure 15 Drivers, Restraints, Opportunities, & Challenges in the Market
Figure 16 Dry Shale Gas Production
Figure 17 Under-Construction Nuclear Reactors
Figure 18 The Wet Field-Erected Cooling Tower Segment Led the Market in 2016
Figure 19 The Induced Draft Segment Led the Market in 2016
Figure 20 The Power Generation Segment Led the Market in 2016
Figure 21 Regional Snapshot: the Market in Asia Pacific is Expected to Grow at the Highest CAGR During the Forecast Period
Figure 22 Asia Pacific Led the Market in 2016
Figure 23 Asia Pacific: Market Snapshot
Figure 24 Middle East & Africa: Market Snapshot
Figure 25 Key Developments in the Market, 2014�2017
Figure 26 SPX Led the Market in 2016
Figure 27 SPX: Company Snapshot
Figure 28 Hamon & CIE: Company Snapshot
Figure 29 Babcock & Wilcox (B&W): Company Snapshot


Growth opportunities and latent adjacency in Field-Erected Cooling Tower Market