Enterprise File Synchronization and Sharing (EFSS) Market by Offering (Solutions, Services), Application (File Storage & Backup, Content Management System, Document Collaboration), Business Function, Vertical and Region - Global Forecast to 2028
[288 Pages Report] The global market for EFSS is projected to grow from USD 9.4 billion in 2023 to USD 35.5 billion by 2028, at a CAGR of 30.4% during the forecast period. The growing sophistication of cyber threats has made data security a top priority for organizations. EFSS solutions that offer robust security measures such as encryption, data loss prevention (DLP), and threat detection are in high demand to mitigate these risks.
To know about the assumptions considered for the study, Request for Free Sample Report
To know about the assumptions considered for the study, download the pdf brochure
Market Dynamics
Driver: Demand for collaboration tools
The Enterprise File Sync and Share (EFSS) market is experiencing a growing demand for collaboration tools as organizations increasingly recognize the value of seamless and efficient teamwork. Collaboration tools within EFSS solutions facilitate real-time document editing, version control, and team communication, enabling dispersed teams to work together effectively regardless of geographical locations. With the rise of remote and hybrid work models, the need for robust collaboration features has intensified, driving EFSS providers to enhance their offerings with features like integrated messaging, task management, and video conferencing. Additionally, the integration of artificial intelligence and machine learning in collaboration tools is enabling advanced functionalities such as intelligent file recommendations, content discovery, and automated workflows, further enhancing the collaborative experience.
Restraint: Legacy System Integration in Highly Regulated Industries
In heavily regulated sectors such as healthcare and finance, integrating EFSS (Enterprise File Sync and Share) solutions with legacy systems poses a significant challenge. These older systems were not initially designed to accommodate modern file-sharing capabilities, making seamless integration while maintaining security and compliance a complex task. Compliance with stringent regulations like HIPAA in healthcare and financial laws adds further complexity, requiring EFSS providers to offer robust integration solutions tailored to the unique requirements of each industry. This includes extensive testing, customization, and ongoing support to ensure that the integrated EFSS solution meets the specific needs of these regulated environments without compromising data security or regulatory compliance.
Opportunity: Increasing adoption of cloud-based solutions
With advancements in cloud computing, data centers, and the network infrastructure, EFSS vendors offer cloud-based EFSS solutions to customers across the globe. The cloud model offers a range of benefits to customers. Some of these benefits include scalability, flexibility, ease of access, multi-device support, and lower costs. Therefore, large enterprises and SMEs are rapidly implementing cloud-based EFSS solutions. Cloud-based EFSS solutions facilitate remote work by providing secure access to files and data from any location or device. This capability has become crucial in enabling businesses to maintain productivity and collaboration in the face of remote work trends.
Challenge: Presence of various EFSS vendors and intense market competition
In the competitive landscape of enterprise file sync and sharing (EFSS), businesses can overcome challenges by prioritizing differentiation, targeted marketing, strategic partnerships, customer experience, innovation, agility, cost-effectiveness, and brand building. By emphasizing unique features, tailoring marketing strategies, fostering collaborations, enhancing customer satisfaction, driving innovation, maintaining flexibility, ensuring competitive pricing, and building a strong brand image, companies can effectively navigate the competitive EFSS market and establish themselves as leaders in the industry.
EFSS Market Ecosystem
By offering services to hold the highest CAGR during the forecast period.
EFSS services are cloud-based solutions that enable organizations to securely synchronize and share files, documents, and other data across multiple devices and with external collaborators. These services provide a centralized platform for storing, accessing, and collaborating on files, which helps improve productivity, streamline workflows, and enhance data security. EFSS solutions typically offer features such as file versioning, access controls, real-time collaboration, and integration with existing enterprise systems.
Based on Business Function, Human Resource segment to hold the highest CAGR during the forecast period.
In the EFSS market, Human Resources (HR) plays a crucial role in managing and securing the organization's sensitive data. EFSS solutions are used by HR departments to securely store, share, and manage employee-related documents, such as contracts, performance reviews, and training materials. These solutions enable HR professionals to collaborate on documents with colleagues and external partners while ensuring data security and compliance with regulations like GDPR and HIPAA. With the increasing amount of sensitive employee information being stored digitally, it is imperative for HR departments to ensure that this data is protected from unauthorized access and cyber threats.
By verticals, Healthcare sector to hold the highest CAGR during the forecast period.
Enterprise file sync and sharing (EFSS) solutions have gained significant traction in the healthcare vertical due to their ability to enhance collaboration, streamline workflows, and ensure secure access to critical patient data. In the healthcare industry, where the timely and secure exchange of patient information is crucial for providing quality care, EFSS solutions play a vital role in facilitating seamless communication among healthcare professionals and improving patient outcomes. EFSS in the healthcare is its support for compliance with regulations such as the Health Insurance Portability and Accountability Act (HIPAA) in the United States and similar data protection laws in other regions.
North America to account for the largest market size during the forecast period.
In North America, the Enterprise File Sync and Share (EFSS) market is one of the most mature and competitive markets globally. With the region being a hub for technological innovation and a large number of enterprises across various industries, there is a high demand for EFSS solutions that can offer secure, seamless file sharing and collaboration capabilities. The market is characterized by a diverse range of EFSS vendors, including both established players and newer entrants, each offering unique features and functionalities to cater to the diverse needs of businesses in the region. Key players in the North American EFSS market include Box, Dropbox, Microsoft, Google, Citrix Systems, and many others.
Key Market Players
The EFSS Market vendors have implemented various types of organic and inorganic growth strategies, such as partnerships and agreements, new product launches, product upgrades, business expansions, and mergers and acquisitions to strengthen their offerings in the market. The major vendors in the global market for EFSS market include Box (US), Citrix Systems (US), Dropbox (US), Microsoft (US), Google (US), Thomson Reuters (Canada), IBM (US), Blackberry (Canada), OpenText (Canada), VMware (US), Acronis (Switzerland), Thru (US), Accellion (US), Syncplicity by Axway (US), Egnyte (US), SugarSync (US), Nextcloud (Germany), Northbridge Secure Systems (Australia), ownCloud (Germany), SS&C Intralinks (US), Qnext (US), CTERA Networks (Israel), DryvIQ (US), Inspire-Tech (Singapore), Filecloud (US), and MyWorkDrive (US).
Want to explore hidden markets that can drive new revenue in Enterprise File Synchronization and Sharing (EFSS) Market?
Scope of the Report
Want to explore hidden markets that can drive new revenue in Enterprise File Synchronization and Sharing (EFSS) Market?
Report Metrics |
Details |
Market size available for years |
2018–2028 |
Base year considered |
2022 |
Forecast period |
2023–2028 |
Forecast units |
USD Billion |
Segments Covered |
Offering, Business function,Application,Vertical, and Region |
Geographies covered |
North America, Europe, Asia Pacific, the Middle East & Africa, and Latin America |
Companies covered |
Box (US), Citrix Systems (US), Dropbox (US), Microsoft (US), Google (US), Thomson Reuters (Canada), IBM (US), Blackberry (Canada), OpenText (Canada), VMware (US), Acronis (Switzerland), Thru (US), Accellion (US), Syncplicity by Axway (US), Egnyte (US), SugarSync (US), Nextcloud (Germany), Northbridge Secure Systems (Australia), ownCloud (Germany), SS&C Intralinks (US), Qnext (US), CTERA Networks (Israel), DryvIQ (US), Inspire-Tech (Singapore), Filecloud (US), and MyWorkDrive (US). |
This research report categorizes the EFSS market based on Offering, Business function,Application,Vertical, and Region.
By Offering:
-
Solutions
- Standalone EFSS Solution
- Integrated EFSS solution
-
Solution by deployment mode
-
Cloud
- Public
- Private
- Hybrid
- On- premises
-
Cloud
-
Services
-
Professional Services
- Consulting
- Integration and Deployment
- Training and Support
- Managed Services
-
Professional Services
By Business function:
- Human Resources
- Sales & Marketing
- Legal
- Finance & Accounting
- IT
By Application:
- File Storage & Backup
- Content Management System
- Mobile Access & Productivity
- Document Collaboration
- Analytics & Reporting
- Other Application
By Vertical:
- BFSI
- Healthcare
- Legal services
- Education
- IT & ITeS
- Media & Entertainment
- Government & Public Sector
- Retail and eCommerce
- Construction and Real estate
- Other Verticals (Telecom, Manufacturing, and Transportation & Logistics)
By Region:
-
North America
- US
- Canada
-
Europe
- UK
- Germany
- France
- Italy
- Spain
- Rest of Europe
-
Asia Pacific
- China
- India
- Japan
- India
- South Korea
- Singapore
- Rest of Asia Pacific
-
Middle East & Africa
- Saudi Arabia
- UAE
- South Africa
- Turkey
- Rest of the Middle East & Africa
-
Latin America
- Brazil
- Mexico
- Argentina
- Rest of Latin America
Recent Developments:
- In December 2023, OpenText Core Content is a fast-deploying SaaS content management solution that delivers simple, agile, and secure cloud-based content management.
- In November 2023, Box and Google Cloud announced an expanded partnership to transform work in the enterprise with generative AI. Box will integrate with Vertex AI to build new gen AI features that help customers more efficiently process and analyze data stored in the Box Content Cloud, which is also now available to customers directly through Google Cloud.
- In November 2023, VMware expanded its partnership with Liquit. Liquit, a part of Recast Software, already helps power the Enterprise App Repository (EAR) in Workspace ONE for Windows applications.
- In August 2023, NetApp, a global, cloud-led, data-centric software company, announced an extension of its partnership with Google Cloud to deliver new levels of storage performance combined with the simplicity and flexibility of the cloud.
- In August 2023, OpenText announced an expansion of its partnership with Google Cloud to deliver AI-powered integrations that will help organizations unlock the power of their data on Google Cloud to their competitive advantage.
Frequently Asked Questions (FAQ):
How is the EFSS market expected to grow in the next five years?
According to MarketsandMarkets, The global market for EFSS is projected to grow from USD 9.4 billion in 2023 to USD 35.5 billion by 2028, at a CAGR of 30.4% during the forecast period.
What region holds the highest market share in the EFSS market?
North America has the highest market share in the EFSS market due to the early adoption of technology and the presence of various solutions and service providers.
What are the major factors driving the growth of the EFSS market?
The major drivers for the EFSS market continuously rising digital workplace and mobile workforce, increasing collaborations between employees and enterprises, emphasis of businesses on corporate data security, and stringent government compliances and regulations
Who are the major vendors in the EFSS market?
The major vendors in the EFSS market include Box, Citrix Systems, Microsoft, Google, and Dropbox.
Which countries are considered in the Europian region?
The report includes an analysis of the UK, Germany, France, Italy , Spain and Rest of Europe in the European region. .
To speak to our analyst for a discussion on the above findings, click Speak to Analyst
Exclusive indicates content/data unique to MarketsandMarkets and not available with any competitors.
- 5.1 INTRODUCTION
-
5.2 MARKET DYNAMICSDRIVERS- Demand for collaboration tools- Continuously growing digital workplace and mobile workforce- Increasing collaborations between employees and enterprises- Emphasis on corporate data security- Stringent government regulations and compliance requirementsRESTRAINTS- Legacy system integration in highly regulated industries- Need for heavy investments in EFSS solutionsOPPORTUNITIES- Increasing adoption of cloud-based solutions- Emerging economies with adoption potential- Rising demand for integrated EFSS solutions among businessesCHALLENGES- Security concerns and data privacy issues- Presence of various EFSS vendors and intense market competition
-
5.3 INDUSTRY TRENDSCASE STUDY ANALYSIS- BFSI- Construction- Business services- ManufacturingTECHNOLOGY ANALYSIS- Key technology- Complementary technology- Adjacent technologyTARIFF AND REGULATORY LANDSCAPE- Tariff related to EFSS- Regulatory landscape- Regulations: EFSS marketVALUE CHAIN ANALYSISEFSS: EVOLUTIONECOSYSTEM/MARKET MAPPORTER’S FIVE FORCES ANALYSIS- Threat from new entrants- Threat from substitutes- Bargaining power of buyers- Bargaining power of suppliers- Intensity of competition rivalryPATENT ANALYSIS- Methodology- Patents filed, by document type- Innovation and patent applications- Top 10 applicants in EFSS marketPRICING ANALYSIS- Average selling price trends of key players, by solution type- Indicative pricing offered by EFSS vendorsTRENDS/DISRUPTIONS IMPACTING CUSTOMERS’ BUSINESSESKEY CONFERENCES AND EVENTS, 2023–2024KEY STAKEHOLDERS AND BUYING CRITERIA- Key stakeholders in buying process- Buying criteria
-
6.1 INTRODUCTIONOFFERING: ENTERPRISE FILE SYNCHRONIZATION AND SHARING MARKET DRIVERS
-
6.2 SOLUTIONSSTANDALONE- Increasing demand for solutions that enable seamless file sharing and collaboration across geographiesINTEGRATED- Growing mobile workforce drives demand for integrated EFSS
-
6.3 SOLUTION, BY DEPLOYMENT MODECLOUD- Cloud-based EFSS solutions - easily scalable to accommodate growing data volumes and user bases- Public- Private- HybridON-PREMISES- Adoption of on-premise enterprise EFSS solutions to overcome security concerns over sensitive data
-
6.4 SERVICESREDUCE IT BURDEN AND FOCUS ON CORE BUSINESS ACTIVITIESPROFESSIONAL SERVICES- Consulting- Integration & deployment- Training & supportMANAGED SERVICES- Increasing need to enhance operations and customer experience boosts segment
-
7.1 INTRODUCTIONBUSINESS FUNCTION: ENTERPRISE FILE SYNCHRONIZATION AND SHARING MARKET DRIVERS
-
7.2 HUMAN RESOURCESEFFECTIVE COLLABORATION THROUGH CENTRALIZED PLATFORM TO SHARE AND ACCESS DOCUMENTS
-
7.3 SALES & MARKETINGLEVERAGE EFSS SOLUTIONS FOR SEAMLESS COLLABORATION ON DOCUMENTS, PRESENTATIONS, AND OTHER CONTENT
-
7.4 LEGALSEGMENT DRIVEN BY NEED FOR IMPROVED SECURITY, EFFICIENCY, AND COST-SAVING
-
7.5 FINANCE & ACCOUNTINGRISE OF REMOTE WORK TO FUEL DEMAND FOR COLLABORATION ON FINANCIAL DOCUMENTS AND REPORTS
-
7.6 INFORMATION TECHNOLOGYDEMAND FOR EFSS SOLUTIONS THAT SUPPORT MOBILE DEVICES CONTINUES TO RISE
-
8.1 INTRODUCTIONAPPLICATION: ENTERPRISE FILE SYNCHRONIZATION AND SHARING MARKET DRIVERS
-
8.2 FILE STORAGE & BACKUPHELP IN ORGANIZING AND BACKING UP DATA, ENSURING ITS AVAILABILITY AND INTEGRITY
-
8.3 CONTENT MANAGEMENT SYSTEMENHANCES USER EXPERIENCE AND PRODUCTIVITY TO DRIVE GROWTH
-
8.4 MOBILE ACCESS & PRODUCTIVITYHIGH DEMAND FOR EFSS SOLUTIONS THAT PRIORITIZE MOBILE ACCESS AND PRODUCTIVITY
-
8.5 DOCUMENT COLLABORATIONALLOW TEAMS TO WORK MORE EFFICIENTLY BY PROVIDING REAL-TIME ACCESS
-
8.6 ANALYTICS & REPORTINGENCRYPTION AND ACCESS CONTROL ENSURE SECURITY AND COMPLIANCE OF DATA USED
- 8.7 OTHER APPLICATIONS
-
9.1 INTRODUCTIONVERTICAL: ENTERPRISE FILE SYNCHRONIZATION AND SHARING MARKET DRIVERS
-
9.2 BFSIINCREASING THREAT OF CYBERATTACKS AND DATA BREACHES FUELS SEGMENT
-
9.3 GOVERNMENT & PUBLIC SECTORSHIFT TOWARDS REMOTE WORK AND NEED FOR MOBILE ACCESS DRIVE SEGMENT
-
9.4 HEALTHCAREGROWING EMPHASIS ON ELECTRONIC HEALTH RECORDS (EHRS), TELEMEDICINE, AND DIGITAL PATIENT ENGAGEMENT TO BOOST GROWTH
-
9.5 LEGAL SERVICESSTREAMLINED DOCUMENT WORKFLOWS AND ENHANCED PRODUCTIVITY -PRIORITIES FOR LEGAL FIRMS
-
9.6 EDUCATIONEFSS SOLUTIONS STREAMLINE CONTENT MANAGEMENT PROCESSES BY PROVIDING CENTRALIZED PLATFORM FOR STORING, ORGANIZING, AND MANAGING EDUCATIONAL RESOURCES
-
9.7 RETAIL & ECOMMERCECUSTOMER DATA AND CONTENT MANAGEMENT CONTRIBUTE TO IMPROVED CUSTOMER EXPERIENCE
-
9.8 MEDIA & ENTERTAINMENTCOMPANIES LEVERAGE EFSS SOLUTIONS TO ENABLE SEAMLESS COLLABORATION ACROSS DIFFERENT LOCATIONS
-
9.9 IT & ITESNEED TO AUTOMATE WORKFLOW AND ACCELERATE SERVICE DELIVERY TO DRIVE ADOPTION OF ENTERPRISE CONTENT MANAGEMENT
-
9.10 CONSTRUCTION & REAL ESTATESEAMLESS PROJECT COLLABORATION AMONG ARCHITECTS, ENGINEERS, CONTRACTORS, AND CLIENTS TO DRIVE SEGMENT
- 9.11 OTHER VERTICALS
- 10.1 INTRODUCTION
-
10.2 NORTH AMERICANORTH AMERICA: ENTERPRISE FILE SYNCHRONIZATION AND SHARING MARKET DRIVERSNORTH AMERICA: RECESSION IMPACTUS- Increasing adoption of EFSS for data-driven insights to drive marketCANADA- Growing mobile workforce drives need for seamless access to files from any device
-
10.3 EUROPEEUROPE: ENTERPRISE FILE SYNCHRONIZATION AND SHARING MARKET DRIVERSEUROPE: RECESSION IMPACTUK- Increasing demand for robust solutions to enhance performance to drive marketGERMANY- Need to streamline business processes for workflow management to create demand for EFSS solutionsITALY- Advancement of technology contributes to growth of EFSS marketSPAIN- Growing mobile workforce requires access to data from any locationREST OF EUROPE
-
10.4 ASIA PACIFICASIA PACIFIC: ENTERPRISE FILE SYNCHRONIZATION AND SHARING MARKET DRIVERSASIA PACIFIC: RECESSION IMPACTCHINA- Increased adoption of new technologies such as IoT, mobile, and cloud to drive marketJAPAN- Shift toward digital transformation and focus on streamlining business processes to drive market growthINDIA- Secure access and file sharing to facilitate remote collaboration and productivity to fuel marketSOUTH KOREA- Adoption of cloud computing on the rise due to scalability, cost-efficiency, and accessibilitySINGAPORE- Need for dynamic collaboration to streamline workflows and scale operations boosts marketREST OF ASIA PACIFIC
-
10.5 MIDDLE EAST & AFRICAMIDDLE EAST & AFRICA: ENTERPRISE FILE SYNCHRONIZATION AND SHARING MARKET DRIVERSMIDDLE EAST & AFRICA: RECESSION IMPACTUAE- Robust economy and rapid technological advancements demand EFSS solutionsKINGDOM OF SAUDI ARABIA- Data security and compliance with regulations – top priorities for businessesSOUTH AFRICA- Growing demand for digital transformation, data security, and remote collaboration to boost marketTURKEY- Adoption of cloud technology to drive market growthREST OF MIDDLE EAST & AFRICA
-
10.6 LATIN AMERICALATIN AMERICA: ENTERPRISE FILE SYNCHRONIZATION AND SHARING MARKET DRIVERSLATIN AMERICA: RECESSION IMPACTBRAZIL- Rapid digital transformation initiatives to fuel adoption of EFSS solutionsMEXICO- High adoption of intelligent technologies and country's proximity to US to boost marketARGENTINA- Market driven by stringent data protection lawsREST OF LATIN AMERICA
- 11.1 OVERVIEW
- 11.2 KEY PLAYER STRATEGIES
- 11.3 REVENUE ANALYSIS
- 11.4 MARKET SHARE ANALYSIS
- 11.5 BRAND/PRODUCT COMPARATIVE ANALYSIS
-
11.6 COMPANY EVALUATION MATRIX, 2022STARSEMERGING LEADERSPERVASIVE PLAYERSPARTICIPANTSCOMPANY FOOTPRINT
-
11.7 STARTUP/SME EVALUATION MATRIX, 2022PROGRESSIVE COMPANIESRESPONSIVE COMPANIESDYNAMIC COMPANIESSTARTING BLOCKSCOMPETITIVE BENCHMARKING
-
11.8 COMPETITIVE SCENARIO AND TRENDSPRODUCT LAUNCHESDEALS
- 11.9 VALUATION AND FINANCIAL METRICS OF KEY VENDORS
-
12.1 KEY PLAYERSBOX- Business overview- Products offered- Recent developments- MnM viewCITRIX SYSTEMS- Business overview- Products offered- Recent developments- MnM viewDROPBOX- Business overview- Products offered- Recent developments- MnM viewMICROSOFT- Business overview- Products offered- Recent developments- MnM viewGOOGLE- Business overview- Products offered- Recent developments- MnM viewTHOMSON REUTERS- Business overview- Products offered- Recent developmentsIBM- Business overview- Products offered- Recent developmentsBLACKBERRY- Business overview- Products offeredOPENTEXT- Business overview- Products offered- Recent developmentsVMWARE- Business overview- Products offered- Recent developments
-
12.2 OTHER PLAYERSACRONISSS&C INTRALINKSSYNCPLICITY BY AXWAYEGNYTETHRUACCELLIONSUGARSYNCCTERA NETWORKSNEXTCLOUDMYWORKDRIVEQNEXTNORTHBRIDGE SECURE SYSTEMSINSPIRE-TECHDRYVIQFILECLOUDOWNCLOUD
- 13.1 INTRODUCTION
-
13.2 ENTERPRISE CONTENT MANAGEMENT MARKET– GLOBAL FORECAST TO 2026MARKET DEFINITIONENTERPRISE CONTENT MANAGEMENT MARKET, BY BUSINESS FUNCTIONENTERPRISE CONTENT MANAGEMENT MARKET, BY COMPONENT- Solutions- ServicesENTERPRISE CONTENT MANAGEMENT MARKET, BY ORGANIZATION SIZEENTERPRISE CONTENT MANAGEMENT MARKET, BY VERTICAL
-
13.3 DIGITAL ASSET MANAGEMENT MARKET – GLOBAL FORECAST TO 2028MARKET DEFINITIONDIGITAL ASSET MANAGEMENT MARKET, BY COMPONENTDIGITAL ASSET MANAGEMENT MARKET, BY BUSINESS FUNCTIONDIGITAL ASSET MANAGEMENT MARKET, BY DEPLOYMENT MODEDIGITAL ASSET MANAGEMENT MARKET, BY ORGANIZATION SIZEDIGITAL ASSET MANAGEMENT MARKET, BY VERTICAL
- 14.1 DISCUSSION GUIDE
- 14.2 KNOWLEDGESTORE: MARKETSANDMARKETS’ SUBSCRIPTION PORTAL
- 14.3 CUSTOMIZATION OPTIONS
- 14.4 RELATED REPORTS
- 14.5 AUTHOR DETAILS
- TABLE 1 PRIMARY INTERVIEWS
- TABLE 2 FACTOR ANALYSIS
- TABLE 3 ENTERPRISE FILE SYNCHRONIZATION AND SHARING MARKET AND GROWTH RATE, 2018–2022 (USD MILLION, Y-O-Y GROWTH)
- TABLE 4 ENTERPRISE FILE SYNCHRONIZATION AND SHARING MARKET AND GROWTH RATE, 2023–2028 (USD MILLION, Y-O-Y GROWTH)
- TABLE 5 TARIFF RELATED TO EFSS, 2022
- TABLE 6 NORTH AMERICA: REGULATORY BODIES, GOVERNMENT AGENCIES, AND OTHER ORGANIZATIONS
- TABLE 7 EUROPE: REGULATORY BODIES, GOVERNMENT AGENCIES, AND OTHER ORGANIZATIONS
- TABLE 8 ASIA PACIFIC: REGULATORY BODIES, GOVERNMENT AGENCIES, AND OTHER ORGANIZATIONS
- TABLE 9 MIDDLE EAST & AFRICA: REGULATORY BODIES, GOVERNMENT AGENCIES, AND OTHER ORGANIZATIONS
- TABLE 10 LATIN AMERICA: REGULATORY BODIES, GOVERNMENT AGENCIES, AND OTHER ORGANIZATIONS
- TABLE 11 ROLE OF KEY PLAYERS IN EFSS MARKET
- TABLE 12 PATENTS FILED, 2013–2023
- TABLE 13 TOP 20 PATENT OWNERS IN EFSS MARKET, 2013–2023
- TABLE 14 PATENTS IN THE EFSS MARKET, 2023
- TABLE 15 AVERAGE SELLING PRICE TREND OF KEY PLAYERS, BY SOLUTION TYPE
- TABLE 16 INDICATIVE PRICING LEVELS OF EFSS SOLUTIONS
- TABLE 17 KEY CONFERENCES & EVENTS, 2023–2024
- TABLE 18 INFLUENCE OF STAKEHOLDERS ON BUYING PROCESS FOR TOP THREE VERTICALS
- TABLE 19 KEY BUYING CRITERIA FOR TOP THREE VERTICALS
- TABLE 20 ENTERPRISE FILE SYNCHRONIZATION AND SHARING MARKET, BY OFFERING, 2018–2022 (USD MILLION)
- TABLE 21 ENTERPRISE FILE SYNCHRONIZATION AND SHARING MARKET, BY OFFERING, 2023–2028 (USD MILLION)
- TABLE 22 ENTERPRISE FILE SYNCHRONIZATION AND SHARING SOLUTIONS MARKET, BY TYPE, 2018–2022 (USD MILLION)
- TABLE 23 ENTERPRISE FILE SYNCHRONIZATION AND SHARING SOLUTIONS MARKET, BY TYPE, 2023–2028 (USD MILLION)
- TABLE 24 ENTERPRISE FILE SYNCHRONIZATION AND SHARING SOLUTIONS MARKET, BY REGION, 2018–2022 (USD MILLION)
- TABLE 25 ENTERPRISE FILE SYNCHRONIZATION AND SHARING SOLUTIONS MARKET, BY REGION, 2023–2028 (USD MILLION)
- TABLE 26 STANDALONE ENTERPRISE FILE SYNCHRONIZATION AND SHARING SOLUTIONS MARKET, BY REGION, 2018–2022 (USD MILLION)
- TABLE 27 STANDALONE ENTERPRISE FILE SYNCHRONIZATION AND SHARING SOLUTIONS MARKET, BY REGION, 2023–2028 (USD MILLION)
- TABLE 28 INTEGRATED ENTERPRISE FILE SYNCHRONIZATION AND SHARING SOLUTIONS MARKET, BY REGION, 2018–2022 (USD MILLION)
- TABLE 29 INTEGRATED ENTERPRISE FILE SYNCHRONIZATION AND SHARING SOLUTIONS MARKET, BY REGION, 2023–2028 (USD MILLION)
- TABLE 30 ENTERPRISE FILE SYNCHRONIZATION AND SHARING MARKET, BY DEPLOYMENT MODE, 2018–2022 (USD MILLION)
- TABLE 31 ENTERPRISE FILE SYNCHRONIZATION AND SHARING MARKET, BY DEPLOYMENT MODE, 2023–2028 (USD MILLION)
- TABLE 32 CLOUD DEPLOYMENT: MARKET, BY TYPE, 2018–2022 (USD MILLION)
- TABLE 33 CLOUD DEPLOYMENT: MARKET, BY TYPE, 2023–2028 (USD MILLION)
- TABLE 34 CLOUD DEPLOYMENT: MARKET, BY REGION, 2018–2022 (USD MILLION)
- TABLE 35 CLOUD DEPLOYMENT: MARKET, BY REGION, 2023–2028 (USD MILLION)
- TABLE 36 PUBLIC CLOUD: MARKET, BY REGION, 2018–2022 (USD MILLION)
- TABLE 37 PUBLIC CLOUD: MARKET, BY REGION, 2023–2028 (USD MILLION)
- TABLE 38 PRIVATE CLOUD: MARKET, BY REGION, 2018–2022 (USD MILLION)
- TABLE 39 PRIVATE CLOUD: MARKET, BY REGION, 2023–2028 (USD MILLION)
- TABLE 40 HYBRID CLOUD: MARKET, BY REGION, 2018–2022 (USD MILLION)
- TABLE 41 HYBRID CLOUD: MARKET, BY REGION, 2023–2028 (USD MILLION)
- TABLE 42 ON-PREMISE DEPLOYMENT: MARKET, BY REGION, 2018–2022 (USD MILLION)
- TABLE 43 ON-PREMISE DEPLOYMENT: MARKET, BY REGION, 2023–2028 (USD MILLION)
- TABLE 44 SERVICES: MARKET, BY TYPE, 2018–2022 (USD MILLION)
- TABLE 45 SERVICES: MARKET, BY TYPE, 2023–2028 (USD MILLION)
- TABLE 46 SERVICES: MARKET, BY REGION, 2018–2022 (USD MILLION)
- TABLE 47 SERVICES: MARKET, BY REGION, 2023–2028 (USD MILLION)
- TABLE 48 PROFESSIONAL SERVICES: MARKET, BY TYPE, 2018–2022 (USD MILLION)
- TABLE 49 PROFESSIONAL SERVICES: MARKET, BY TYPE, 2023–2028 (USD MILLION)
- TABLE 50 PROFESSIONAL SERVICES: MARKET, BY REGION, 2018–2022 (USD MILLION)
- TABLE 51 PROFESSIONAL SERVICES: MARKET, BY REGION, 2023–2028 (USD MILLION)
- TABLE 52 CONSULTING: MARKET, BY REGION, 2018–2022 (USD MILLION)
- TABLE 53 CONSULTING: MARKET, BY REGION, 2023–2028 (USD MILLION)
- TABLE 54 INTEGRATION & DEPLOYMENT: MARKET, BY REGION, 2018–2022 (USD MILLION)
- TABLE 55 INTEGRATION & DEPLOYMENT: MARKET, BY REGION, 2023–2028 (USD MILLION)
- TABLE 56 TRAINING & SUPPORT: MARKET, BY REGION, 2018–2022 (USD MILLION)
- TABLE 57 TRAINING & SUPPORT: MARKET, BY REGION, 2023–2028 (USD MILLION)
- TABLE 58 MANAGED SERVICES: MARKET, BY REGION, 2018–2022 (USD MILLION)
- TABLE 59 MANAGED SERVICES: MARKET, BY REGION, 2023–2028 (USD MILLION)
- TABLE 60 MARKET, BY BUSINESS FUNCTION, 2018–2022 (USD MILLION)
- TABLE 61 MARKET, BY BUSINESS FUNCTION, 2023–2028 (USD MILLION)
- TABLE 62 HUMAN RESOURCES: MARKET, BY REGION, 2018–2022 (USD MILLION)
- TABLE 63 HUMAN RESOURCES: MARKET, BY REGION, 2023–2028 (USD MILLION)
- TABLE 64 SALES & MARKETING: MARKET, BY REGION, 2018–2022 (USD MILLION)
- TABLE 65 SALES & MARKETING: MARKET, BY REGION, 2023–2028 (USD MILLION)
- TABLE 66 LEGAL: MARKET, BY REGION, 2018–2022 (USD MILLION)
- TABLE 67 LEGAL: MARKET, BY REGION, 2023–2028 (USD MILLION)
- TABLE 68 FINANCE & ACCOUNTING: MARKET, BY REGION, 2018–2022 (USD MILLION)
- TABLE 69 FINANCE & ACCOUNTING: MARKET, BY REGION, 2023–2028 (USD MILLION)
- TABLE 70 INFORMATION TECHNOLOGY: MARKET, BY REGION, 2018–2022 (USD MILLION)
- TABLE 71 INFORMATION TECHNOLOGY: MARKET, BY REGION, 2023–2028 (USD MILLION)
- TABLE 72 MARKET, BY APPLICATION, 2018–2022 (USD MILLION)
- TABLE 73 MARKET, BY APPLICATION, 2023–2028 (USD MILLION)
- TABLE 74 FILE BACKUP & STORAGE: MARKET, BY REGION, 2018–2022 (USD MILLION)
- TABLE 75 FILE BACKUP & STORAGE: MARKET, BY REGION, 2023–2028 (USD MILLION)
- TABLE 76 CONTENT MANAGEMENT SYSTEM: MARKET, BY REGION, 2018–2022 (USD MILLION)
- TABLE 77 CONTENT MANAGEMENT SYSTEM: MARKET, BY REGION, 2023–2028 (USD MILLION)
- TABLE 78 MOBILE ACCESS & PRODUCTIVITY: MARKET, BY REGION, 2018–2022 (USD MILLION)
- TABLE 79 MOBILE ACCESS & PRODUCTIVITY: MARKET, BY REGION, 2023–2028 (USD MILLION)
- TABLE 80 DOCUMENT COLLABORATION: MARKET, BY REGION, 2018–2022 (USD MILLION)
- TABLE 81 DOCUMENT COLLABORATION: MARKET, BY REGION, 2023–2028 (USD MILLION)
- TABLE 82 ANALYTICS & REPORTING: MARKET, BY REGION, 2018–2022 (USD MILLION)
- TABLE 83 ANALYTICS & REPORTING: MARKET, BY REGION, 2023–2028 (USD MILLION)
- TABLE 84 OTHER APPLICATIONS: MARKET, BY REGION, 2018–2022 (USD MILLION)
- TABLE 85 OTHER APPLICATIONS: MARKET, BY REGION, 2023–2028 (USD MILLION)
- TABLE 86 MARKET, BY VERTICAL, 2018–2022 (USD MILLION)
- TABLE 87 MARKET, BY VERTICAL, 2023–2028 (USD MILLION)
- TABLE 88 BFSI: MARKET, BY REGION, 2018–2022 (USD MILLION)
- TABLE 89 BFSI: MARKET, BY REGION, 2023–2028 (USD MILLION)
- TABLE 90 GOVERNMENT & PUBLIC SECTOR: MARKET, BY REGION, 2018–2022 (USD MILLION)
- TABLE 91 GOVERNMENT & PUBLIC SECTOR: MARKET, BY REGION, 2023–2028 (USD MILLION)
- TABLE 92 HEALTHCARE: MARKET, BY REGION, 2018–2022 (USD MILLION)
- TABLE 93 HEALTHCARE: MARKET, BY REGION, 2023–2028 (USD MILLION)
- TABLE 94 LEGAL SERVICES: MARKET, BY REGION, 2018–2022 (USD MILLION)
- TABLE 95 LEGAL SERVICES: MARKET, BY REGION, 2023–2028 (USD MILLION)
- TABLE 96 EDUCATION: MARKET, BY REGION, 2018–2022 (USD MILLION)
- TABLE 97 EDUCATION: MARKET, BY REGION, 2023–2028 (USD MILLION)
- TABLE 98 RETAIL & E-COMMERCE: MARKET, BY REGION, 2018–2022 (USD MILLION)
- TABLE 99 RETAIL & E-COMMERCE: MARKET, BY REGION, 2023–2028 (USD MILLION)
- TABLE 100 MEDIA & ENTERTAINMENT: MARKET, BY REGION, 2018–2022 (USD MILLION)
- TABLE 101 MEDIA & ENTERTAINMENT: MARKET, BY REGION, 2023–2028 (USD MILLION)
- TABLE 102 IT & ITES: MARKET, BY REGION, 2018–2022 (USD MILLION)
- TABLE 103 IT & ITES: MARKET, BY REGION, 2023–2028 (USD MILLION)
- TABLE 104 CONSTRUCTION & REAL ESTATE: MARKET, BY REGION, 2018–2022 (USD MILLION)
- TABLE 105 CONSTRUCTION & REAL ESTATE: MARKET, BY REGION, 2023–2028 (USD MILLION)
- TABLE 106 OTHER VERTICALS: MARKET, BY REGION, 2018–2022 (USD MILLION)
- TABLE 107 OTHER VERTICALS: MARKET, BY REGION, 2023–2028 (USD MILLION)
- TABLE 108 MARKET, BY REGION, 2018–2022 (USD MILLION)
- TABLE 109 MARKET, BY REGION, 2023–2028 (USD MILLION)
- TABLE 110 NORTH AMERICA: MARKET, BY OFFERING, 2018–2022 (USD MILLION)
- TABLE 111 NORTH AMERICA: MARKET, BY OFFERING, 2023–2028 (USD MILLION)
- TABLE 112 NORTH AMERICA: MARKET, BY SOLUTION, 2018–2022 (USD MILLION)
- TABLE 113 NORTH AMERICA: MARKET, BY SOLUTION, 2023–2028 (USD MILLION)
- TABLE 114 NORTH AMERICA: MARKET, BY DEPLOYMENT MODE, 2018–2022 (USD MILLION)
- TABLE 115 NORTH AMERICA: MARKET, BY DEPLOYMENT MODE, 2023–2028 (USD MILLION)
- TABLE 116 NORTH AMERICA: MARKET, BY CLOUD TYPE, 2018–2022 (USD MILLION)
- TABLE 117 NORTH AMERICA: MARKET, BY CLOUD TYPE, 2023–2028 (USD MILLION)
- TABLE 118 NORTH AMERICA: MARKET, BY SERVICE, 2018–2022 (USD MILLION)
- TABLE 119 NORTH AMERICA: MARKET, BY SERVICE, 2023–2028 (USD MILLION)
- TABLE 120 NORTH AMERICA: MARKET, BY PROFESSIONAL SERVICE, 2018–2022 (USD MILLION)
- TABLE 121 NORTH AMERICA: MARKET, BY PROFESSIONAL SERVICE, 2023–2028 (USD MILLION)
- TABLE 122 NORTH AMERICA: MARKET, BY BUSINESS FUNCTION, 2018–2022 (USD MILLION)
- TABLE 123 NORTH AMERICA: MARKET, BY BUSINESS FUNCTION, 2023–2028 (USD MILLION)
- TABLE 124 NORTH AMERICA: MARKET, BY APPLICATION, 2018–2022 (USD MILLION)
- TABLE 125 NORTH AMERICA: MARKET, BY APPLICATION, 2023–2028 (USD MILLION)
- TABLE 126 NORTH AMERICA: MARKET, BY VERTICAL, 2018–2022 (USD MILLION)
- TABLE 127 NORTH AMERICA: MARKET, BY VERTICAL, 2023–2028 (USD MILLION)
- TABLE 128 NORTH AMERICA: MARKET, BY COUNTRY, 2018–2022 (USD MILLION)
- TABLE 129 NORTH AMERICA: MARKET, BY COUNTRY, 2023–2028 (USD MILLION)
- TABLE 130 US: MARKET, BY OFFERING, 2018–2022 (USD MILLION)
- TABLE 131 US: MARKET, BY OFFERING, 2023–2028 (USD MILLION)
- TABLE 132 US: MARKET, BY SOLUTION, 2018–2022 (USD MILLION)
- TABLE 133 US: MARKET, BY SOLUTION, 2023–2028 (USD MILLION)
- TABLE 134 US: MARKET, BY SERVICE, 2018–2022 (USD MILLION)
- TABLE 135 US: MARKET, BY SERVICE, 2023–2028 (USD MILLION)
- TABLE 136 CANADA: MARKET, BY OFFERING, 2018–2022 (USD MILLION)
- TABLE 137 CANADA: MARKET, BY OFFERING, 2023–2028 (USD MILLION)
- TABLE 138 CANADA: MARKET, BY SOLUTION, 2018–2022 (USD MILLION)
- TABLE 139 CANADA: MARKET, BY SOLUTION, 2023–2028 (USD MILLION)
- TABLE 140 CANADA: MARKET, BY SERVICE, 2018–2022 (USD MILLION)
- TABLE 141 CANADA: MARKET, BY SERVICE, 2023–2028 (USD MILLION)
- TABLE 142 EUROPE: MARKET, BY OFFERING, 2018–2022 (USD MILLION)
- TABLE 143 EUROPE: MARKET, BY OFFERING, 2023–2028 (USD MILLION)
- TABLE 144 EUROPE: MARKET, BY SOLUTION, 2018–2022 (USD MILLION)
- TABLE 145 EUROPE: MARKET, BY SOLUTION, 2023–2028 (USD MILLION)
- TABLE 146 EUROPE: MARKET, BY DEPLOYMENT MODE, 2018–2022 (USD MILLION)
- TABLE 147 EUROPE: MARKET, BY DEPLOYMENT MODE, 2023–2028 (USD MILLION)
- TABLE 148 EUROPE: MARKET, BY CLOUD TYPE, 2018–2022 (USD MILLION)
- TABLE 149 EUROPE: MARKET, BY CLOUD TYPE, 2023–2028 (USD MILLION)
- TABLE 150 EUROPE: MARKET, BY SERVICE, 2018–2022 (USD MILLION)
- TABLE 151 EUROPE: MARKET, BY SERVICE, 2023–2028 (USD MILLION)
- TABLE 152 EUROPE: MARKET, BY PROFESSIONAL SERVICE, 2018–2022 (USD MILLION)
- TABLE 153 EUROPE: MARKET, BY PROFESSIONAL SERVICE, 2023–2028 (USD MILLION)
- TABLE 154 EUROPE: MARKET, BY BUSINESS FUNCTION, 2018–2022 (USD MILLION)
- TABLE 155 EUROPE: MARKET, BY BUSINESS FUNCTION, 2023–2028 (USD MILLION)
- TABLE 156 EUROPE: MARKET, BY APPLICATION, 2018–2022 (USD MILLION)
- TABLE 157 EUROPE: MARKET, BY APPLICATION, 2023–2028 (USD MILLION)
- TABLE 158 EUROPE: MARKET, BY VERTICAL, 2018–2022 (USD MILLION)
- TABLE 159 EUROPE: MARKET, BY VERTICAL, 2023–2028 (USD MILLION)
- TABLE 160 EUROPE: MARKET, BY COUNTRY, 2018–2022 (USD MILLION)
- TABLE 161 EUROPE: MARKET, BY COUNTRY, 2023–2028 (USD MILLION)
- TABLE 162 UK: MARKET, BY OFFERING, 2018–2022 (USD MILLION)
- TABLE 163 UK: MARKET, BY OFFERING, 2023–2028 (USD MILLION)
- TABLE 164 UK: MARKET, BY SOLUTION, 2018–2022 (USD MILLION)
- TABLE 165 UK: MARKET, BY SOLUTION, 2023–2028 (USD MILLION)
- TABLE 166 UK: MARKET, BY SERVICE, 2018–2022 (USD MILLION)
- TABLE 167 UK: MARKET, BY SERVICE, 2023–2028 (USD MILLION)
- TABLE 168 GERMANY: MARKET, BY OFFERING, 2018–2022 (USD MILLION)
- TABLE 169 GERMANY: MARKET, BY OFFERING, 2023–2028 (USD MILLION)
- TABLE 170 GERMANY: MARKET, BY SOLUTION, 2018–2022 (USD MILLION)
- TABLE 171 GERMANY: MARKET, BY SOLUTION, 2023–2028 (USD MILLION)
- TABLE 172 GERMANY: MARKET, BY SERVICE, 2018–2022 (USD MILLION)
- TABLE 173 GERMANY: MARKET, BY SERVICE, 2023–2028 (USD MILLION)
- TABLE 174 ASIA PACIFIC: MARKET, BY OFFERING, 2018–2022 (USD MILLION)
- TABLE 175 ASIA PACIFIC: MARKET, BY OFFERING, 2023–2028 (USD MILLION)
- TABLE 176 ASIA PACIFIC: MARKET, BY SOLUTION, 2018–2022 (USD MILLION)
- TABLE 177 ASIA PACIFIC: MARKET, BY SOLUTION, 2023–2028 (USD MILLION)
- TABLE 178 ASIA PACIFIC: MARKET, BY DEPLOYMENT MODE, 2018–2022 (USD MILLION)
- TABLE 179 ASIA PACIFIC: MARKET, BY DEPLOYMENT MODE, 2023–2028 (USD MILLION)
- TABLE 180 ASIA PACIFIC: MARKET, BY CLOUD TYPE, 2018–2022 (USD MILLION)
- TABLE 181 ASIA PACIFIC: MARKET, BY CLOUD TYPE, 2023–2028 (USD MILLION)
- TABLE 182 ASIA PACIFIC: MARKET, BY SERVICE, 2018–2022 (USD MILLION)
- TABLE 183 ASIA PACIFIC: MARKET, BY SERVICE, 2023–2028 (USD MILLION)
- TABLE 184 ASIA PACIFIC: MARKET, BY PROFESSIONAL SERVICE, 2018–2022 (USD MILLION)
- TABLE 185 ASIA PACIFIC: MARKET, BY PROFESSIONAL SERVICE, 2023–2028 (USD MILLION)
- TABLE 186 ASIA PACIFIC: MARKET, BY BUSINESS FUNCTION, 2018–2022 (USD MILLION)
- TABLE 187 ASIA PACIFIC: MARKET, BY BUSINESS FUNCTION, 2023–2028 (USD MILLION)
- TABLE 188 ASIA PACIFIC: MARKET, BY APPLICATION, 2018–2022 (USD MILLION)
- TABLE 189 ASIA PACIFIC: MARKET, BY APPLICATION, 2023–2028 (USD MILLION)
- TABLE 190 ASIA PACIFIC: MARKET, BY VERTICAL, 2018–2022 (USD MILLION)
- TABLE 191 ASIA PACIFIC: MARKET, BY VERTICAL, 2023–2028 (USD MILLION)
- TABLE 192 ASIA PACIFIC: MARKET, BY COUNTRY, 2018–2022 (USD MILLION)
- TABLE 193 ASIA PACIFIC: MARKET, BY COUNTRY, 2023–2028 (USD MILLION)
- TABLE 194 CHINA: MARKET, BY OFFERING, 2018–2022 (USD MILLION)
- TABLE 195 CHINA: MARKET, BY OFFERING, 2023–2028 (USD MILLION)
- TABLE 196 CHINA: MARKET, BY SOLUTION, 2018–2022 (USD MILLION)
- TABLE 197 CHINA: MARKET, BY SOLUTION, 2023–2028 (USD MILLION)
- TABLE 198 CHINA: MARKET, BY SERVICE, 2018–2022 (USD MILLION)
- TABLE 199 CHINA: MARKET, BY SERVICE, 2023–2028 (USD MILLION)
- TABLE 200 JAPAN: MARKET, BY OFFERING, 2018–2022 (USD MILLION)
- TABLE 201 JAPAN: MARKET, BY OFFERING, 2023–2028 (USD MILLION)
- TABLE 202 JAPAN: MARKET, BY SOLUTION, 2018–2022 (USD MILLION)
- TABLE 203 JAPAN: MARKET, BY SOLUTION, 2023–2028 (USD MILLION)
- TABLE 204 JAPAN: MARKET, BY SERVICE, 2018–2022 (USD MILLION)
- TABLE 205 JAPAN: MARKET, BY SERVICE, 2023–2028 (USD MILLION)
- TABLE 206 MIDDLE EAST & AFRICA: MARKET, BY OFFERING, 2018–2022 (USD MILLION)
- TABLE 207 MIDDLE EAST & AFRICA: MARKET, BY OFFERING, 2023–2028 (USD MILLION)
- TABLE 208 MIDDLE EAST & AFRICA: MARKET, BY SOLUTION, 2018–2022 (USD MILLION)
- TABLE 209 MIDDLE EAST & AFRICA: MARKET, BY SOLUTION, 2023–2028 (USD MILLION)
- TABLE 210 MIDDLE EAST & AFRICA: MARKET, BY DEPLOYMENT MODE, 2018–2022 (USD MILLION)
- TABLE 211 MIDDLE EAST & AFRICA: MARKET, BY DEPLOYMENT MODE, 2023–2028 (USD MILLION)
- TABLE 212 MIDDLE EAST & AFRICA: MARKET, BY CLOUD TYPE, 2018–2022 (USD MILLION)
- TABLE 213 MIDDLE EAST & AFRICA: MARKET, BY CLOUD TYPE, 2023–2028 (USD MILLION)
- TABLE 214 MIDDLE EAST & AFRICA: MARKET, BY SERVICE, 2018–2022 (USD MILLION)
- TABLE 215 MIDDLE EAST & AFRICA: MARKET, BY SERVICE, 2023–2028 (USD MILLION)
- TABLE 216 MIDDLE EAST & AFRICA: MARKET, BY PROFESSIONAL SERVICE, 2018–2022 (USD MILLION)
- TABLE 217 MIDDLE EAST & AFRICA: MARKET, BY PROFESSIONAL SERVICE, 2023–2028 (USD MILLION)
- TABLE 218 MIDDLE EAST & AFRICA: MARKET, BY BUSINESS FUNCTION, 2018–2022 (USD MILLION)
- TABLE 219 MIDDLE EAST & AFRICA: MARKET, BY BUSINESS FUNCTION, 2023–2028 (USD MILLION)
- TABLE 220 MIDDLE EAST & AFRICA: MARKET, BY APPLICATION, 2018–2022 (USD MILLION)
- TABLE 221 MIDDLE EAST & AFRICA: MARKET, BY APPLICATION, 2023–2028 (USD MILLION)
- TABLE 222 MIDDLE EAST & AFRICA: MARKET, BY VERTICAL, 2018–2022 (USD MILLION)
- TABLE 223 MIDDLE EAST & AFRICA: MARKET, BY VERTICAL, 2023–2028 (USD MILLION)
- TABLE 224 MIDDLE EAST & AFRICA: MARKET, BY COUNTRY, 2018–2022 (USD MILLION)
- TABLE 225 MIDDLE EAST & AFRICA: MARKET, BY COUNTRY, 2023–2028 (USD MILLION)
- TABLE 226 UAE: MARKET, BY OFFERING, 2018–2022 (USD MILLION)
- TABLE 227 UAE: MARKET, BY OFFERING, 2023–2028 (USD MILLION)
- TABLE 228 UAE: MARKET, BY SOLUTION, 2018–2022 (USD MILLION)
- TABLE 229 UAE: MARKET, BY SOLUTION, 2023–2028 (USD MILLION)
- TABLE 230 UAE: MARKET, BY SERVICE, 2018–2022 (USD MILLION)
- TABLE 231 UAE: MARKET, BY SERVICE, 2023–2028 (USD MILLION)
- TABLE 232 KINGDOM OF SAUDI ARABIA: MARKET, BY OFFERING, 2018–2022 (USD MILLION)
- TABLE 233 KINGDOM OF SAUDI ARABIA: MARKET, BY OFFERING, 2023–2028 (USD MILLION)
- TABLE 234 KINGDOM OF SAUDI ARABIA: MARKET, BY SOLUTION, 2018–2022 (USD MILLION)
- TABLE 235 KINGDOM OF SAUDI ARABIA: MARKET, BY SOLUTION, 2023–2028 (USD MILLION)
- TABLE 236 KINGDOM OF SAUDI ARABIA: MARKET, BY SERVICE, 2018–2022 (USD MILLION)
- TABLE 237 KINGDOM OF SAUDI ARABIA: MARKET, BY SERVICE, 2023–2028 (USD MILLION)
- TABLE 238 LATIN AMERICA: MARKET, BY OFFERING, 2018–2022 (USD MILLION)
- TABLE 239 LATIN AMERICA: MARKET, BY OFFERING, 2023–2028 (USD MILLION)
- TABLE 240 LATIN AMERICA: MARKET, BY SOLUTION, 2018–2022 (USD MILLION)
- TABLE 241 LATIN AMERICA: MARKET, BY SOLUTION, 2023–2028 (USD MILLION)
- TABLE 242 LATIN AMERICA: MARKET, BY DEPLOYMENT MODE, 2018–2022 (USD MILLION)
- TABLE 243 LATIN AMERICA: MARKET, BY DEPLOYMENT MODE, 2023–2028 (USD MILLION)
- TABLE 244 LATIN AMERICA: MARKET, BY CLOUD TYPE, 2018–2022 (USD MILLION)
- TABLE 245 LATIN AMERICA: MARKET, BY CLOUD TYPE, 2023–2028 (USD MILLION)
- TABLE 246 LATIN AMERICA: MARKET, BY SERVICE, 2018–2022 (USD MILLION)
- TABLE 247 LATIN AMERICA: MARKET, BY SERVICE, 2023–2028 (USD MILLION)
- TABLE 248 LATIN AMERICA: MARKET, BY PROFESSIONAL SERVICE, 2018–2022 (USD MILLION)
- TABLE 249 LATIN AMERICA: MARKET, BY PROFESSIONAL SERVICE, 2023–2028 (USD MILLION)
- TABLE 250 LATIN AMERICA: MARKET, BY BUSINESS FUNCTION, 2018–2022 (USD MILLION)
- TABLE 251 LATIN AMERICA: ENTERPRISE FILE SYNCHRONIZATION AND SHARING MARKET, BY BUSINESS FUNCTION, 2023–2028 (USD MILLION)
- TABLE 252 LATIN AMERICA: ENTERPRISE FILE SYNCHRONIZATION AND SHARING MARKET, BY APPLICATION, 2018–2022 (USD MILLION)
- TABLE 253 LATIN AMERICA: ENTERPRISE FILE SYNCHRONIZATION AND SHARING MARKET, BY APPLICATION, 2023–2028 (USD MILLION)
- TABLE 254 LATIN AMERICA: ENTERPRISE FILE SYNCHRONIZATION AND SHARING MARKET, BY VERTICAL, 2018–2022 (USD MILLION)
- TABLE 255 LATIN AMERICA: ENTERPRISE FILE SYNCHRONIZATION AND SHARING MARKET, BY VERTICAL, 2023–2028 (USD MILLION)
- TABLE 256 LATIN AMERICA: ENTERPRISE FILE SYNCHRONIZATION AND SHARING MARKET, BY COUNTRY, 2018–2022 (USD MILLION)
- TABLE 257 LATIN AMERICA: ENTERPRISE FILE SYNCHRONIZATION AND SHARING MARKET, BY COUNTRY, 2023–2028 (USD MILLION)
- TABLE 258 BRAZIL: ENTERPRISE FILE SYNCHRONIZATION AND SHARING MARKET, BY OFFERING, 2018–2022 (USD MILLION)
- TABLE 259 BRAZIL: ENTERPRISE FILE SYNCHRONIZATION AND SHARING MARKET, BY OFFERING, 2023–2028 (USD MILLION)
- TABLE 260 BRAZIL: ENTERPRISE FILE SYNCHRONIZATION AND SHARING MARKET, BY SOLUTION, 2018–2022 (USD MILLION)
- TABLE 261 BRAZIL: ENTERPRISE FILE SYNCHRONIZATION AND SHARING MARKET, BY SOLUTION, 2023–2028 (USD MILLION)
- TABLE 262 BRAZIL: ENTERPRISE FILE SYNCHRONIZATION AND SHARING MARKET, BY SERVICE, 2018–2022 (USD MILLION)
- TABLE 263 BRAZIL: ENTERPRISE FILE SYNCHRONIZATION AND SHARING MARKET, BY SERVICE, 2023–2028 (USD MILLION)
- TABLE 264 MEXICO: ENTERPRISE FILE SYNCHRONIZATION AND SHARING MARKET, BY OFFERING, 2018–2022 (USD MILLION)
- TABLE 265 MEXICO: ENTERPRISE FILE SYNCHRONIZATION AND SHARING MARKET, BY OFFERING, 2023–2028 (USD MILLION)
- TABLE 266 MEXICO: ENTERPRISE FILE SYNCHRONIZATION AND SHARING MARKET, BY SOLUTION, 2018–2022 (USD MILLION)
- TABLE 267 MEXICO: ENTERPRISE FILE SYNCHRONIZATION AND SHARING MARKET, BY SOLUTION, 2023–2028 (USD MILLION)
- TABLE 268 MEXICO: ENTERPRISE FILE SYNCHRONIZATION AND SHARING MARKET, BY SERVICE, 2018–2022 (USD MILLION)
- TABLE 269 MEXICO: ENTERPRISE FILE SYNCHRONIZATION AND SHARING MARKET, BY SERVICE, 2023–2028 (USD MILLION)
- TABLE 270 OVERVIEW OF STRATEGIES ADOPTED BY KEY EFSS VENDORS
- TABLE 271 EFSS MARKET: DEGREE OF COMPETITION
- TABLE 272 PRODUCT FOOTPRINT (11 COMPANIES)
- TABLE 273 VERTICAL FOOTPRINT (11 COMPANIES)
- TABLE 274 REGION FOOTPRINT (11 COMPANIES)
- TABLE 275 COMPANY FOOTPRINT (11 COMPANIES)
- TABLE 276 EFSS MARKET: DETAILED LIST OF STARTUPS/SMES
- TABLE 277 EFSS MARKET: COMPETITIVE BENCHMARKING OF STARTUPS/SMES
- TABLE 278 EFSS MARKET: PRODUCT LAUNCHES, MAY 2019–DECEMBER 2023
- TABLE 279 EFSS MARKET: DEALS, JANUARY 2019–NOVEMBER 2023
- TABLE 280 BOX: BUSINESS OVERVIEW
- TABLE 281 BOX: PRODUCTS OFFERED
- TABLE 282 BOX: PRODUCT LAUNCHES
- TABLE 283 BOX: DEALS
- TABLE 284 CITRIX SYSTEMS: BUSINESS OVERVIEW
- TABLE 285 CITRIX SYSTEMS: PRODUCTS OFFERED
- TABLE 286 CITRIX SYSTEMS: DEALS
- TABLE 287 CITRIX SYSTEMS: OTHERS
- TABLE 288 DROPBOX: BUSINESS OVERVIEW
- TABLE 289 DROPBOX: PRODUCTS OFFERED
- TABLE 290 DROPBOX: DEALS
- TABLE 291 MICROSOFT: BUSINESS OVERVIEW
- TABLE 292 MICROSOFT: PRODUCTS OFFERED
- TABLE 293 MICROSOFT: PRODUCT LAUNCHES
- TABLE 294 MICROSOFT: DEALS
- TABLE 295 GOOGLE: BUSINESS OVERVIEW
- TABLE 296 GOOGLE: PRODUCTS OFFERED
- TABLE 297 GOOGLE: PRODUCT LAUNCHES
- TABLE 298 GOOGLE: DEALS
- TABLE 299 THOMSON REUTERS: BUSINESS OVERVIEW
- TABLE 300 THOMSON REUTERS: PRODUCTS OFFERED
- TABLE 301 THOMSON REUTERS: PRODUCT LAUNCHES
- TABLE 302 THOMSON REUTERS: DEALS
- TABLE 303 IBM: BUSINESS OVERVIEW
- TABLE 304 IBM: PRODUCTS OFFERED
- TABLE 305 IBM: PRODUCT LAUNCHES
- TABLE 306 BLACKBERRY: BUSINESS OVERVIEW
- TABLE 307 BLACKBERRY: PRODUCTS OFFERED
- TABLE 308 OPENTEXT: BUSINESS OVERVIEW
- TABLE 309 OPENTEXT: PRODUCTS OFFERED
- TABLE 310 OPENTEXT: PRODUCT LAUNCHES
- TABLE 311 OPENTEXT: DEALS
- TABLE 312 VMWARE: BUSINESS OVERVIEW
- TABLE 313 VMWARE: PRODUCTS OFFERED
- TABLE 314 VMWARE: DEALS
- TABLE 315 ENTERPRISE CONTENT MANAGEMENT MARKET, BY BUSINESS FUNCTION, 2016–2020 (USD MILLION)
- TABLE 316 ENTERPRISE CONTENT MANAGEMENT MARKET, BY BUSINESS FUNCTION, 2021–2026 (USD MILLION)
- TABLE 317 ENTERPRISE CONTENT MANAGEMENT MARKET, BY SOLUTION, 2016–2020 (USD MILLION)
- TABLE 318 ENTERPRISE CONTENT MANAGEMENT MARKET, BY SOLUTION, 2021–2026 (USD MILLION)
- TABLE 319 ENTERPRISE CONTENT MANAGEMENT MARKET, BY SERVICE, 2016–2020 (USD MILLION)
- TABLE 320 ENTERPRISE CONTENT MANAGEMENT MARKET, BY SERVICE, 2021–2026 (USD MILLION)
- TABLE 321 ENTERPRISE CONTENT MANAGEMENT MARKET, BY ORGANIZATION SIZE, 2016–2020 (USD MILLION)
- TABLE 322 ENTERPRISE CONTENT MANAGEMENT MARKET, BY ORGANIZATION SIZE, 2021–2026 (USD MILLION)
- TABLE 323 ENTERPRISE CONTENT MANAGEMENT MARKET, BY VERTICAL, 2016–2020 (USD MILLION)
- TABLE 324 ENTERPRISE CONTENT MANAGEMENT MARKET, BY VERTICAL, 2021–2026 (USD MILLION)
- TABLE 325 DIGITAL ASSET MANAGEMENT MARKET, BY COMPONENT, 2019–2022 (USD MILLION)
- TABLE 326 DIGITAL ASSET MANAGEMENT MARKET, BY COMPONENT, 2023–2028 (USD MILLION)
- TABLE 327 DIGITAL ASSET MANAGEMENT MARKET, BY BUSINESS FUNCTION, 2019–2022 (USD MILLION)
- TABLE 328 DIGITAL ASSET MANAGEMENT MARKET, BY BUSINESS FUNCTION, 2023–2028 (USD MILLION)
- TABLE 329 DIGITAL ASSET MANAGEMENT MARKET, BY DEPLOYMENT TYPE, 2019–2022 (USD MILLION)
- TABLE 330 DIGITAL ASSET MANAGEMENT MARKET, BY DEPLOYMENT TYPE, 2023–2028 (USD MILLION)
- TABLE 331 DIGITAL ASSET MANAGEMENT MARKET, BY ORGANIZATION SIZE, 2019–2022 (USD MILLION)
- TABLE 332 DIGITAL ASSET MANAGEMENT MARKET, BY ORGANIZATION SIZE, 2023–2028 (USD MILLION)
- TABLE 333 DIGITAL ASSET MANAGEMENT MARKET, BY VERTICAL, 2019–2022 (USD MILLION)
- TABLE 334 DIGITAL ASSET MANAGEMENT MARKET, BY VERTICAL, 2023–2028 (USD MILLION)
- FIGURE 1 ENTERPRISE FILE SYNCHRONIZATION AND SHARING MARKET: RESEARCH DESIGN
- FIGURE 2 DATA TRIANGULATION
- FIGURE 3 ENTERPRISE FILE SYNCHRONIZATION AND SHARING MARKET: TOP-DOWN AND BOTTOM-UP APPROACHES
- FIGURE 4 MARKET SIZE ESTIMATION METHODOLOGY ? APPROACH 1 (SUPPLY SIDE): REVENUE OF SOLUTIONS AND SERVICES IN EFSS MARKET
- FIGURE 5 MARKET SIZE ESTIMATION METHODOLOGY ? APPROACH 1 - BOTTOM-UP (SUPPLY SIDE): COLLECTIVE REVENUE OF SOLUTIONS IN THE EFSS MARKET
- FIGURE 6 MARKET SIZE ESTIMATION METHODOLOGY- APPROACH 2 (DEMAND SIDE): SHARE OF ENTERPRISE FILE SYNCHRONIZATION AND SHARING MARKET
- FIGURE 7 SOLUTIONS SEGMENT – DOMINANT IN ENTERPRISE FILE SYNCHRONIZATION AND SHARING MARKET IN 2023
- FIGURE 8 SALES & MARKETING – LARGEST BUSINESS FUNCTION IN 2023
- FIGURE 9 STANDALONE SOLUTIONS – DOMINANT IN ENTERPRISE FILE SYNCHRONIZATION AND SHARING IN 2023
- FIGURE 10 INTEGRATION & DEPLOYMENT SERVICES SEGMENT ACCOUNTED FOR LARGEST SHARE IN 2023
- FIGURE 11 FILE STORAGE & BACKUP SEGMENT HELD MAJOR SHARE IN 2023
- FIGURE 12 BFSI – LARGEST ENTERPRISE FILE SYNCHRONIZATION AND SHARING VERTICAL IN 2023
- FIGURE 13 ENTERPRISE FILE SYNCHRONIZATION AND SHARING MARKET: REGIONAL SNAPSHOT
- FIGURE 14 RISE IN R&D INVESTMENTS AND EFSS SOLUTIONS WILL LEAD TO GROWTH OF MARKET
- FIGURE 15 ENTERPRISE FILE SYNCHRONIZATION AND SHARING MARKET TO WITNESS MINOR DECLINE IN Y-O-Y GROWTH RATE
- FIGURE 16 SOLUTIONS SEGMENT AND US TO HOLD LARGE MARKET SHARE
- FIGURE 17 HEALTHCARE VERTICAL TO GROW AT HIGHEST CAGR DURING FORECAST PERIOD
- FIGURE 18 NORTH AMERICA HELD LARGEST SHARE IN 2023
- FIGURE 19 DRIVERS, RESTRAINTS, OPPORTUNITIES, AND CHALLENGES: EFSS MARKET
- FIGURE 20 VALUE CHAIN ANALYSIS: ENTERPRISE FILE SYNCHRONIZATION AND SHARING MARKET
- FIGURE 21 EVOLUTION OF EFSS TECHNOLOGIES
- FIGURE 22 KEY PLAYERS IN EFSS MARKET ECOSYSTEM
- FIGURE 23 PORTER’S FIVE FORCES ANALYSIS
- FIGURE 24 NUMBER OF PATENTS GRANTED, 2013–2023
- FIGURE 25 TOP 10 APPLICANTS IN EFSS MARKET, 2013–2023
- FIGURE 26 REGIONAL ANALYSIS OF PATENTS GRANTED, 2013–2023
- FIGURE 27 AVERAGE SELLING PRICE TREND OF KEY PLAYERS, BY SOLUTION TYPE
- FIGURE 28 TRENDS/DISRUPTIONS IMPACTING CUSTOMERS’ BUSINESSES
- FIGURE 29 INFLUENCE OF STAKEHOLDERS ON BUYING PROCESS FOR TOP THREE VERTICALS
- FIGURE 30 KEY BUYING CRITERIA FOR TOP THREE VERTICALS
- FIGURE 31 SERVICES SEGMENT TO REGISTER HIGHER CAGR DURING FORECAST PERIOD
- FIGURE 32 INTEGRATED SOLUTIONS TO REGISTER FASTER GROWTH DURING FORECAST PERIOD
- FIGURE 33 HYBRID CLOUD SEGMENT TO REGISTER HIGHEST CAGR DURING FORECAST PERIOD
- FIGURE 34 PROFESSIONAL SERVICES SEGMENT TO DOMINATE DURING FORECAST PERIOD
- FIGURE 35 CONSULTING SEGMENT TO GROW AT HIGHEST CAGR DURING FORECAST PERIOD
- FIGURE 36 SALES & MARKETING TO HOLD LARGEST MARKET SIZE DURING FORECAST PERIOD
- FIGURE 37 MOBILE ACCESS & PRODUCTIVITY SEGMENT TO GROW FASTEST DURING FORECAST PERIOD
- FIGURE 38 HEALTHCARE VERTICAL TO REGISTER THE HIGHEST CAGR IN THE MARKET DURING THE FORECAST PERIOD
- FIGURE 39 ASIA PACIFIC TO REGISTER HIGHEST CAGR DURING FORECAST PERIOD
- FIGURE 40 NORTH AMERICA: MARKET SNAPSHOT
- FIGURE 41 ASIA PACIFIC: MARKET SNAPSHOT
- FIGURE 42 TOP FIVE PLAYERS HAVE DOMINATED MARKET FOR LAST FIVE YEARS
- FIGURE 43 MARKET SHARE ANALYSIS FOR KEY PLAYERS, 2022
- FIGURE 44 BRAND/PRODUCT COMPARATIVE ANALYSIS
- FIGURE 45 EFSS MARKET: COMPANY EVALUATION MATRIX, 2022
- FIGURE 46 EFSS MARKET: STARTUP/SME EVALUATION MATRIX, 2022
- FIGURE 47 VALUATION AND FINANCIAL METRICS OF KEY VENDORS
- FIGURE 48 YEAR-TO-DATE (YTD) PRICE TOTAL RETURN AND 5-YEAR STOCK BETA OF KEY VENDORS
- FIGURE 49 BOX: COMPANY SNAPSHOT
- FIGURE 50 DROPBOX: COMPANY SNAPSHOT
- FIGURE 51 MICROSOFT: COMPANY SNAPSHOT
- FIGURE 52 GOOGLE: COMPANY SNAPSHOT
- FIGURE 53 THOMSON REUTERS: COMPANY SNAPSHOT
- FIGURE 54 IBM: COMPANY SNAPSHOT
- FIGURE 55 BLACKBERRY: COMPANY SNAPSHOT
- FIGURE 56 OPENTEXT: COMPANY SNAPSHOT
- FIGURE 57 VMWARE: COMPANY SNAPSHOT
The study involved four major activities to estimate the current market size for the EFSS market. An exhaustive secondary research was done to collect information on the EFSS market. The next step was to validate these findings, assumptions, and sizing with industry experts across the value chain using primary research. Both top-down and bottom-up approaches were employed to estimate the complete market size. Thereafter, the market breakup and data triangulation procedures were used to estimate the market size of the segments and sub segments of the EFSS market.
Secondary Research
In the secondary research process, various secondary sources, such as D&B Hoovers, Bloomberg Business Week, and Dun & Bradstreet were referred to identify and collect information for this study. These secondary sources included annual reports, press releases, and investor presentations of companies, whitepapers, and articles by recognized authors, gold standard, and silver standard websites, regulatory bodies, trade directories, and databases.
Primary Research
The EFSS market comprises several stakeholders, such as EFSS operators, EFSS service providers, venture capitalists, government organizations, regulatory authorities, policymakers and financial organizations, consulting firms, research organizations, academic institutions, resellers and distributors, and training providers. The demand side of the EFSS market consists of all the firms operating in several industry verticals. The supply side includes EFSS providers, offering EFSS solutions. Various primary sources from both the supply and demand sides of the market were interviewed to obtain qualitative and quantitative information. Given below is the breakup of the primary respondents:
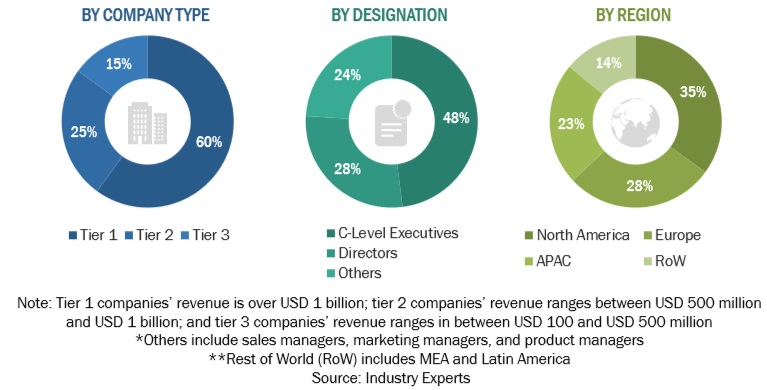
To know about the assumptions considered for the study, download the pdf brochure
Market Size Estimation
For making market estimates and forecasting the EFSS market and the other dependent submarkets, top-down and bottom-up approaches were used. The bottom-up procedure was used to arrive at the overall market size of the global EFSS market, using the revenue from the key companies and their offerings in the market. With data triangulation and validation through primary interviews, this study determined and confirmed the exact value of the overall parent market size. The overall market size was then used in the top-down procedure to estimate the size of other individual markets via percentage splits of the market segments.
The bottom-up procedure was employed to arrive at the overall market size of the EFSS market from the revenues of the key players (companies) and their market shares. The calculation was done based on estimations and by verifying their revenues through extensive primary interviews. Calculations based on the revenues of the key companies identified in the market led to the overall market size. The overall market size was used in the top-down procedure to estimate the size of the other individual segments (offering, deployment mode, business function, application, vertical, and region) via percentage splits of market segments from the secondary and primary research. The bottom-up procedure was also implemented for the data extracted from the secondary research to validate the market segment revenues obtained.
All the possible parameters that affect the market covered in the research study have been accounted for, viewed in extensive detail, verified through primary research, and analyzed to get the final quantitative and qualitative data. The data is consolidated and added with detailed inputs and analysis from MarketsandMarkets.
- The pricing trend is assumed to vary over time.
- All the forecasts are made with the standard assumption that the accepted currency is USD.
- For the conversion of various currencies to USD, average historical exchange rates are used according to the year specified. For all the historical and current exchange rates required for calculations and currency conversions, the US Internal Revenue Service's website is used.
- All the forecasts are made under the standard assumption that the globally accepted currency USD, remains constant during the next five years.
- Vendor-side analysis: The market size estimates of associated solutions and services are factored in from the vendor side by assuming an average of licensing and subscription-based models of leading and innovative vendors.
- Demand/end-user analysis: End users operating in verticals across regions are analyzed in terms of market spending on geospatial analytics based on some of the key use cases. These factors for the geospatial analytics per region are separately analyzed, and the average spending was extrapolated with an approximation based on assumed weightage. This factor is derived by averaging various market influencers, including recent developments, regulations, mergers and acquisitions, enterprise/SME adoption, start-up ecosystem, IT spending, technology propensity and maturity, use cases, and the estimated number of organizations per region.
Market Size Estimation: Top Down And Bottom Up Approach
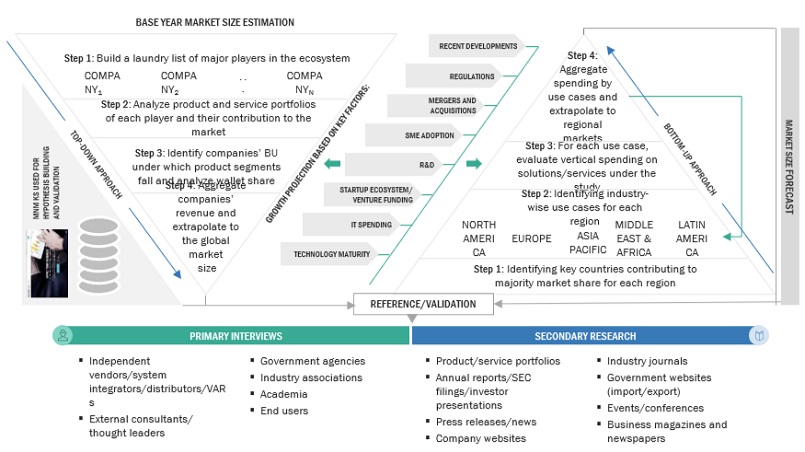
To know about the assumptions considered for the study, Request for Free Sample Report
Data Triangulation
With data triangulation and validation through primary interviews, the exact value of the overall parent market size was determined and confirmed using this study. The overall market size was then used in the top-down procedure to estimate the size of other individual markets via percentage splits of the market segmentation.
Market Definition
Enterprise file synchronization and sharing (also known as EFSS and enterprise file sync and share) refers to software services that enable organizations to securely synchronize and share documents, photos, videos, and files from multiple devices with employees, external customers and partners. Organizations often adopt these technologies to prevent employees from using consumer-based file sharing apps to store, access, and manage corporate data that is outside of the IT department’s control and visibility
Key Stakeholders
- EFSS Solution Vendors
- Mobile Device Manufacturers
- EFSS Service Providers
- Mobile Device End-Users
- Application Developers
- Manufacturers of Mobile Device Operation Systems
- System Integrators
- Information Technology (IT) Developers
- Third-party Vendors
- Cloud Service Providers
- Network Operators
- Infrastructure Providers
- EFSS End-Users
- Government Agencies and Organizations
- Regulatory and Compliance Agencies
Report Objectives
- To describe and forecast the size of the Enterprise File Synchronization and Sharing (EFSS) market by offering, business function, application, vertical and region
- To describe and forecast the size of the market segments with respect to five main regions: North America, Europe, Asia Pacific (APAC), Latin America, and the Middle East and Africa (MEA)
- To provide detailed information regarding drivers, restraints, opportunities, and challenges influencing the growth of the EFSS market
- To analyze micro markets with respect to individual growth trends, prospects, and contributions to the overall EFSS market
- To analyze opportunities in the market for stakeholders by identifying high-growth segments
- To profile key market players, including top vendors and startups; provide a comparative analysis based on business overviews, regional presence, product offerings, business strategies, and key financials; and provide a detailed competitive landscape of the market
- To analyze competitive developments, such as Mergers and Acquisitions (M&A); new product launches and product enhancements; agreements, partnerships, and collaborations; expansions; and Research and Development (R&D) activities in the market
Available Customizations
With the given market data, MarketsandMarkets offers customizations as per the company’s specific needs. The following customization options are available for the report:
Product Analysis
- Product matrix provides a detailed comparison of the product portfolio of each company
Geographic Analysis
- Further breakup of the North American market for EFSS
- Further breakup of the European market for EFSS
- Further breakup of the Asia Pacific market for EFSS
- Further breakup of the Latin American market for EFSS
- Further breakup of the Middle East & Africa market for EFSS
Company Information
- Detailed analysis and profiling of additional market players (up to five)
Growth opportunities and latent adjacency in Enterprise File Synchronization and Sharing (EFSS) Market
Gather insights into EFSS platforms in Singapore.
Need insight into the market segmentation of the EFSS and BFSS market.
Interested in the EFSS market size and its segmentation by Business Function (Finance, IT, Legal, & Operations).