Engineered Foam Market by Material Type (Polyurethane, Polystyrene, Polyolefin), Form (Flexible, Rigid, Spray), End User (Aerospace & Defense, Medical & Healthcare, Transportation, Manufacturing & Construction), Region - Global Forecast to 2026


[190 Pages Report] The global engineered foam market was estimated at USD 57.30 Billion in 2016, and is expected to reach USD 122.30 Billion by 2026, at a CAGR of 7.9% from 2016 to 2026.
The main objectives of this market study are:
- To define and segment the global engineered foam market by type, form, end use industry, and region
- To estimate and forecast the market in terms of value and volume
- To estimate and forecast the engineered foam market by type, form, and end use industry at country-level in each region
- To identify and analyze the key drivers, restraints, and opportunities that influence the growth of the market
- To analyze significant region-specific trends in North America, Europe, Asia-Pacific, Latin America, and the Middle East & Africa
- To strategically identify and profile the key players and analyze their share in the engineered foam market
- To analyze recent market developments and competitive strategies, such as alliances, joint ventures, and mergers & acquisitions to draw the competitive landscape in the engineered foam market
- To estimate the market share of key market players in the engineered foam market
The global engineered foam market has been segmented on the basis of form, type, end use industry, and region.
The years considered for the report are:
- Base Year - 2015
- Estimated Year - 2016
- Projected Year - 2021
- Forecast Period - 2016-2021
- Long Term Projected Year - 2026
The base year used for company profiles is 2015; where the information was not available for the base year, the prior year was taken into consideration.
Research Methodology:
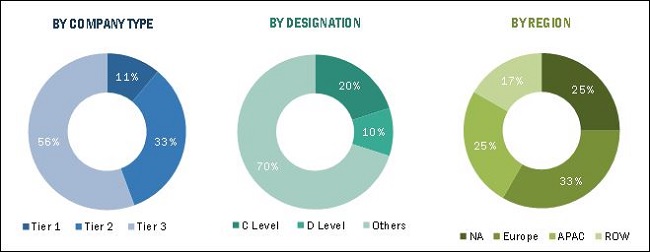
Different secondary sources, such as company websites, directories, and database such as Hoovers, Bloomberg, Chemical Weekly, Factiva, RadTech, and other government and private websites, have been used to identify and collect information that is useful for this extensive commercial study of the global engineered foam market. The primary sources, which include experts from related industries, have been interviewed to verify and collect critical information as well as to assess the future prospects of the market. The top-down approach has been implemented to validate the market size. With the data triangulation procedure and validation of data through primaries, the exact values of the overall parent market size and individual market sizes have been determined and confirmed in this study. The breakdown of primaries conducted in shown in the figure bellow.
To know about the assumptions considered for the study, download the pdf brochure
Market Ecosystem:
The ecosystem for the global engineered foam market consists of suppliers of key raw materials, such as polyol, polyurethane, polyethylene and other chemicals. Many companies, such as BASF SE (Germany), The Dow Chemical Company (U.S.), Bayer AG (Germany), Sekisui Chemical Co. Ltd. (Japan) have adopted forward integration to promote various materials. The demand side includes companies from aerospace & defense, transportation, medical & healthcare, manufacturing & construction, and other industries, which uses engineered foam for various applications including cushioning, insulation, and others.
Target Audience of the Report:
The target audience of the report includes:
- Manufacturers of Engineered Foam
- Traders, Distributors, and Suppliers of Engineered Foam
- Companies Operational Across Various End-Use Market Segments of Engineered Foam
- Government and Research Organizations
- Associations and Industrial Bodies
- Research and Consulting Firms
- National & Local Government Organizations/Agencies
- R&D Institutions
- Investment Banks and Private Equity Firms
Scope of the Report:
- By Form:
- Flexible Foam
- Rigid Foam
- Spray Foam
- By Material Type:
- Polyurethane
- Polystyrene
- Polyvinyl Chloride
- Polyolefin
- Others
- By End User:
- Aerospace & Defense
- Medical & Healthcare
- Transportation
- Manufacturing & Construction
- Others
- By Region:
- North America
- U.S.
- Canada
- Mexico
- Europe
- Germany
- France
- U.K.
- Spain
- Italy
- Czech Republic
- Russia
- Rest of Europe
- Asia-Pacific
- China
- Japan
- India
- Indonesia
- Rest of Asia-Pacific
- Latin America
- Brazil
- Argentina
- Rest of Latin America
- Middle East & Africa
- South Africa
- Saudi Arabia
- Rest of Middle East & Africa
- North America
Available Customizations:
The following customization options are available for the report:
Product Analysis
- Product matrix that gives a detailed comparison of product portfolio of each company
Country Level Analysis
- Further breakdown of the Europe engineered foam market by major countries, including Poland, Belgium, and so on
- Further breakdown of the Asia-Pacific engineered foam market by major countries, including Taiwan, Australia, Malaysia, and others
- Further breakdown of the global engineered foam market by emerging economies in the Middle East & Africa and Latin America
Company Information
- Detailed analysis and profiling of additional market players
The global engineered foam market is projected to reach USD 122.30 Billion by 2026, at a CAGR of 7.9% from 2016 to 2026. High transition along with shorter product life cycles in end-use industries is another factor expected to drive the engineered foam market. Increase in the number of developments in the construction, sports & leisure, and automotive industries is also expected to further boost this market.
Aerospace & defense, followed by the medical & healthcare segment dominated the global engineered foam market in 2015. The transportation segment is projected to grow at the highest CAGR during the forecast period. This high growth is attributed to the use of high-power engines with higher calorific value fuels for better combustion. The growth in medical & healthcare segment is attributed to the emerging healthcare sector; and the requirement for precision medical equipment.
The major factors that are expected to drive the demand for engineered foam during the forecast period include increasing aging population, increased shift towards technologically advanced products and others. Aging population is one of the frequent consumers of the wound care products and medical devices & components. Another factor expected to drive the market is the increased healthcare expenditure by the countries across the globe and their contribution to the overall GDP.
In terms of material type, global engineered foam market is segmented into, polyurethane, polyvinylchloride, polystyrene, polyolefin, and others. The polyolefin segment is expected to grow at a highest rate during the forecast period. Olefins or alkenes are defined as unsaturated aliphatic hydrocarbons. Polyolefin foam is another type of polymer foam, which is majorly used in the packaging and automotive industries. These are macromolecules formed by the polymerization of olefin monomer units.
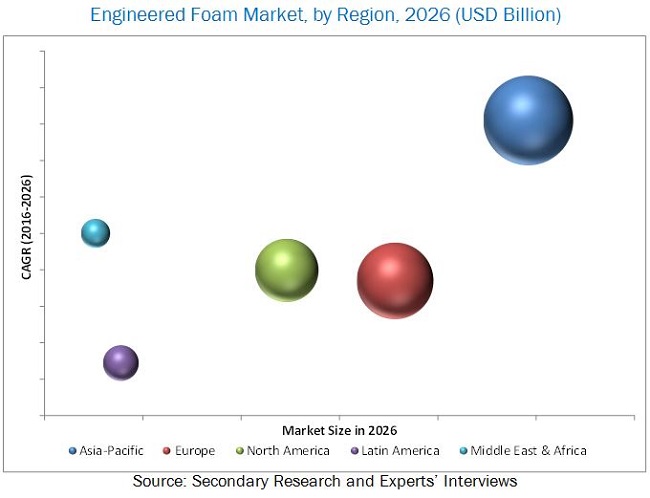
Asia-Pacific estimated to lead the global engineered foam market in 2016. The Asia-Pacific engineered foam market is expected to witness high growth during the forecast period, owing to increasing demand from countries, such as Japan, China, India, Indonesia, and others and increasing manufacturing and infrastructural activities in the region.
Some of the factors that may restrain the growth of the market includes stringent norms and regulations imposed on the use of medical grades products that require high R&D expenditures and others.
BASF SE (Germany) is one of the most active players in the global engineered foam market. The company expanded its business in different regions to increase its global reach and cater to the diversified demands of its customers. The company also entered into joint ventures to strengthen its market position in various region. Armacell GmbH (Luxembourg) is another key player in the market that undertook diverse growth strategies to achieve growth.
To speak to our analyst for a discussion on the above findings, click Speak to Analyst
 Exclusive indicates content/data unique to MarketsandMarkets and not available with any competitors.
Table of Contents
1 Introduction (Page No. - 17)
1.1 Objectives of The Study
1.2 Market Definition
1.3 Study Scope
1.3.1 Markets Covered
1.3.2 Years Considered for The Study
1.4 Currency
1.5 Limitations
1.6 Stakeholders
2 Research Methodology (Page No. - 21)
2.1 Research Data
2.1.1 Key Data From Secondary Sources
2.1.2 Key Data From Primary Sources
2.2 Market Size Estimation
2.3 Market Breakdown and Data Triangulation
2.3.1 Key Industry Insights
2.3.2 Breakdown of Primary Interviews: By Company Type, Designation and Region
2.4 Assumptions
3 Executive Summary (Page No. - 29)
4 Market Overview (Page No. - 34)
4.1 Introduction
4.2 Evolution
4.3 Market Segmentation
4.3.1 By End User
4.3.2 By Type
4.3.3 By Form
4.3.4 By Region
4.4 Market Dynamics
4.4.1 Drivers
4.4.1.1 Increased Expenditure in Space Research Activities
4.4.1.2 Growth of End-Use Industries in Emerging Nations
4.4.1.3 Shorter Product Life Cycles Due to High Technology Transitions
4.4.2 Restraints
4.4.2.1 Rising Raw Material Costs
4.4.3 Opportunities
4.4.3.1 Production of Bio-Based Polyols
4.5 Challenges
4.5.1 High Pricing Pressure
4.6 Cost Structure Analysis
5 Industry Trends (Page No. - 43)
5.1 Introduction
5.2 Revenue Pocket Matrix
5.2.1 Revenue Pocket Matrix for Engineered Foam, End User, 2015
5.2.2 Revenue Pocket Matrix for Engineered Foam Market, Material Type, 2015
5.2.3 Revenue Pocket Matrix for Engineered Foam Market, By Form, 2015
5.3 Economic Indicators
5.3.1 Industry Outlook
5.3.1.1 Automotive
5.3.1.2 Healthcare & Pharmaceutical
5.3.1.3 Electronics
5.3.1.4 Manufacturing
5.3.2 Country Outlook
5.3.2.1 Australia
5.3.2.2 Brazil
5.3.2.3 Canada
5.3.2.4 Chile
5.3.2.5 China
5.3.2.6 France
5.3.2.7 Germany
5.3.2.8 India
5.3.2.9 Iran
5.3.2.10 Italy
5.3.2.11 Japan
5.3.2.12 Mexico
5.3.2.13 New Zealand
5.3.2.14 Russia
5.3.2.15 Saudi Arabia
5.3.2.16 South Korea
5.3.2.17 Thailand
5.3.2.18 U.K.
5.3.2.19 U.S.
6 Premium Insights (Page No. - 58)
6.1 Attractive Opportunities in The Global Engineered Foam Market
6.2 Global Engineered Foam Market, By Region
6.3 Global Engineered Foam Market: Major Segments
6.4 Global Engineered Foam Market Growth
6.5 Global Engineered Foam Market, By End User
7 Engineered Foam Market, By Form (Page No. - 61)
7.1 Introduction
7.2 Market Size and Projection
7.3 Flexible Foam
7.3.1 Cushioning
7.3.2 Filtration
7.3.3 Others
7.4 Rigid Foam
7.4.1 Insulation
7.4.2 Decorative and Architectural Application
7.4.3 Flotation Module
7.5 Spray Foam
7.5.1 Insulation
7.5.2 Air-Barriers
7.5.3 Flotation
7.5.4 Roofing
7.5.5 Packaging
8 Engineered Foam Market, By Material Type (Page No. - 69)
8.1 Introduction
8.2 Polyurethane
8.3 Polystyrene
8.4 Polyvinyl Chloride
8.5 Polyolefin
8.6 Others
9 Engineered Foam Market, By End User (Page No. - 80)
9.1 Introduction
9.2 Aerospace & Defense
9.2.1 Insulation/ Barrier
9.2.2 Cushioning
9.2.3 Sealing
9.3 Transportation
9.3.1 Seat Foam
9.3.2 Door Panels
9.3.3 Energy Absorbers
9.4 Manufacturing & Construction
9.4.1 Thermal Insulation
9.4.2 Air Insulation
9.5 Medical & Healthcare
9.5.1 Medical Packaging
9.5.2 Devices and Components
9.5.3 Prosthetic & Wound Care
9.6 Other End Users
10 Regional Analysis (Page No. - 91)
10.1 Introduction
10.2 Asia-Pacific
10.2.1 China
10.2.2 Japan
10.2.3 India
10.2.4 Indonesia
10.2.5 Rest of Asia-Pacific
10.3 Europe
10.3.1 Germany
10.3.2 France
10.3.3 The U.K.
10.3.4 Spain
10.3.5 Italy
10.3.6 Czech Republic
10.3.7 Russia
10.3.8 Rest of Europe
10.4 North America
10.4.1 U.S.
10.4.2 Canada
10.4.3 Mexico
10.5 Latin America
10.5.1 Brazil
10.5.2 Argentina
10.5.3 Rest of Latin America
10.6 Middle East & Africa
10.6.1 Saudi Arabia
10.6.2 South Africa
10.6.3 Rest of The Middle East & Africa
11 Competitive Landscape (Page No. - 131)
11.1 Overview
11.2 New Product Launches: The Most Popular Growth Strategy
11.3 Engineered Foam Market: Growth Strategies, By Company, 2011-2016
11.4 Engineered Foam Market Share, By Companies, 2015
11.5 Maximum Developments in 2013
11.6 New Product Launches
11.7 Expansions
11.8 Acquisitions
11.9 Agreements & Collaborations
11.10 Joint Ventures
12 Company Profiles (Page No. - 142)
(Overview, Financial*, Products & Services, Strategy, and Developments)
12.1 Introduction
12.2 BASF SE
12.3 The DOW Chemical Company
12.4 Bayer AG
12.5 Sekisui Chemical Co., Ltd.
12.6 Huntsman Corporation
12.7 Trelleborg AB
12.8 Inoac Corporation
12.9 Recticel NV/Sa
12.10 Vita (Lux Iii) S.A.R.L
12.11 Armacell GmbH
12.12 Foamcraft, Inc.
12.13 Foampartner Group
12.14 Future Foam, Inc.
12.15 Fxi-Foamex Innovations
12.16 Rogers Corporation
12.17 UFP Technologies, Inc.
12.18 The Woodbridge Group
*Details Might Not Be Captured in Case of Unlisted Companies.
13 Appendix (Page No. - 179)
13.1 Insights of Industry Experts
13.2 Discussion Guide
13.3 Knowledge Store: Marketsandmarkets� Subscription Portal
13.4 Introducing RT: Real Time Market Intelligence
13.5 Available Customizations
13.6 Related Reports
13.7 Author Details
List of Tables (103 Tables)
Table 1 Global Engineered Foam Market Snapshot
Table 2 Number of Satellites Planned Between 2015 and 2021
Table 3 Engineered Foam� Cost Structure Analysis
Table 4 International Car Sales Outlook
Table 5 Manufacturing Industry Growth Rate, 2015
Table 6 Australia: Economic Outlook
Table 7 Brazil: Economic Outlook
Table 8 Canada: Economic Outlook
Table 9 Chile: Economic Outlook
Table 10 China: Economic Outlook
Table 11 France: Economic Outlook
Table 12 Germany: Economic Outlook
Table 13 India: Economic Outlook
Table 14 Iran: Economic Outlook
Table 15 Italy: Economic Outlook
Table 16 Japan: Economic Outlook
Table 17 Mexico: Economic Outlook
Table 18 New Zealand: Economic Outlook
Table 19 Russia: Economic Outlook
Table 20 Saudi Arabia: Economic Outlook
Table 21 South Korea: Economic Outlook
Table 22 Thailand: Economic Outlook
Table 23 U.K.: Economic Outlook
Table 24 U.S.: Economic Outlook
Table 25 Engineered Foam Market Size, By Form, 2014-2026 (Kilotons)
Table 26 Engineered Foam Market Size, By Form, 2014-2026 (USD Billion)
Table 27 Flexible Foam Segment, By Region, 2014-2026 (Kilotons)
Table 28 Flexible Foam Segment, By Region, 2014-2026 (USD Billion)
Table 29 Rigid Foam Segment, By Region, 2014-2026 (Kilotons)
Table 30 Rigid Foam Segment, By Region, 2014-2026 (USD Billion)
Table 31 Spray Foam Segment, By Region, 2014-2026 (Kilotons)
Table 32 Spray Foam Segment, By Region, 2014-2026 (USD Billion)
Table 33 Engineered Foam Market Size, By Material Type, 2014�2026 (Kilotons)
Table 34 Engineered Foam Market Size, By Material Type, 2014�2026 (USD Billion)
Table 35 Polyurethane Segment, By Region, 2014�2026 (Kilotons)
Table 36 Polyurethane Segment, By Region, 2014�2026 (USD Billion)
Table 37 Polystyrene Segment, By Region, 2014�2026 (Kilotons)
Table 38 Polystyrene Segment, By Region, 2014�2026 (USD Million)
Table 39 Polyvinyl Chloride Engineered Foam Market, By Region, 2014�2026 (Kilotons)
Table 40 Polyvinyl Chloride Engineered Foam Market, By Region, 2014�2026 (USD Million)
Table 41 Polyolefin Engineered Foam Market, By Region, 2014�2026 (Kilotons)
Table 42 Polyolefin Engineered Foam Market, By Region, 2014�2026 (USD Million)
Table 43 Other Engineered Foam Market, By Region, 2014�2021 (Kilotons)
Table 44 Other Engineered Foam Market, By Region, 2014�2021 (USD Million)
Table 45 Engineered Foam Market, By End User, 2014-2026 (Kilotons)
Table 46 Engineered Foam Market, By End User, 2014-2026 (USD Billion)
Table 47 Aerospace & Defense Segment, By Region, 2014-2026 (Kilotons)
Table 48 Aerospace & Defense Segment, By Region, 2014-2026 (USD Billion)
Table 49 Transportation Segment, By Region, 2014-2026 (Kilotons)
Table 50 Transportation Segment, By Region, 2014-2026 (USD Billion)
Table 51 Manufacturing & Construction Segment, By Region, 2014-2026 (Kilotons)
Table 52 Manufacturing & Construction Segment, By Region, 2014-2026 (USD Billion)
Table 53 Medical & Healthcare Segment, By Region, 2014-2026 (Kilotons)
Table 54 Medical & Healthcare Segment, By Region, 2014-2026 (USD Billion)
Table 55 Other End User Segment, By Region, 2014-2026 (Kilotons)
Table 56 Other End User Segment, By Region, 2014-2026 (USD Billion)
Table 57 Engineered Foam Market Size, By Region, 2014�2026 (Kilotons)
Table 58 Engineered Foam Market Size, By Region, 2014�2026 (USD Billion)
Table 59 Asia-Pacific Engineered Foam Market, By Country, 2014-2026 (Kilotons)
Table 60 Asia-Pacific Engineered Foam Market, By Country, 2014-2026 (USD Billion)
Table 61 Asia-Pacific Engineered Foam Market, By End User, 2014-2026 (Kilotons)
Table 62 Asia-Pacific Engineered Foam Market, By End User, 2014-2026 (USD Billion)
Table 63 Asia-Pacific Engineered Foam Market, By Material Type, 2014-2026 (Kilotons)
Table 64 Asia-Pacific Engineered Foam Market, By Material Type, 2014-2026 (USD Billion)
Table 65 Asia-Pacific Engineered Foam Market, By Form, 2014-2026 (Kilotons)
Table 66 Asia-Pacific Engineered Foam Market, By Form, 2014-2026 (USD Billion)
Table 67 Europe Engineered Foam Market Size, By Country, 2014�2026 (Kilotons)
Table 68 Europe Engineered Foam Market Size, By Country, 2014�2026 (USD Million)
Table 69 Europe Engineered Foam Market Size, By Material Type, 2014�2026 (Kilotons)
Table 70 Europe Engineered Foam Market Size, By Material Type, 2014�2021 (USD Million)
Table 71 Europe Engineered Foam Market Size, By Form, 2014�2026 (Kilotons)
Table 72 Europe Engineered Foam Market Size, By Form, 2014�2026 (USD Million)
Table 73 Europe Engineered Foam Market Size, By End User, 2014�2021 (Kilotons)
Table 74 Europe Engineered Foam Market Size, By End User, 2014�2026 (USD Billion)
Table 75 North America: Engineered Foam Market Size, By Country, 2014�2026 (Kilotons)
Table 76 North America Engineered Foam Market Size, By Country, 2014�2026 (USD Billion)
Table 77 North America Engineered Foam Market Size, By Material Type, 2014�2026 (Kilotons)
Table 78 North America Engineered Foam Market Size, By Material Type, 2014�2026 (USD Million)
Table 79 North America Engineered Foam Market Size, By Form, 2014�2026 (Kilotons)
Table 80 North America Engineered Foam Market Size, By Form, 2014�2026 (USD Million)
Table 81 North America Engineered Foam Market Size, By End User, 2014�2021 (Kilotons)
Table 82 North America Engineered Foam Market Size, By End User, 2014�2026 (USD Billion)
Table 83 Latin America Engineered Foam Market Size, By Country, 2014�2026 (Kilotons)
Table 84 Latin America Engineered Foam Market Size, By Country, 2014�2026 (USD Million)
Table 85 Latin America Engineered Foam Market Size, By Material Type, 2014�2026 (Kilotons)
Table 86 Latin America Engineered Foam Market Size, By Material Type, 2014�2026 (USD Million)
Table 87 Latin America Engineered Foam Market Size, By Form, 2014�2026 (Kilotons)
Table 88 Latin America Engineered Foam Market Size, By Form, 2014�2026 (USD Million)
Table 89 Latin America Engineered Foam Market Size, By End User, 2014�2026 (Kilotons)
Table 90 Latin America Engineered Foam Market Size, By End User, 2014�2026 (USD Million)
Table 91 Middle East & Africa Engineered Foam Market Size, By Country, 2014�2026 (Kilotons)
Table 92 Middle East & Africa Engineered Foam Market Size, By Country, 2014�2026 (USD Million)
Table 93 Middle East & Africa Engineered Foam Market Size, By Material Type, 2014�2026 (Kilotons)
Table 94 Middle East & Africa Engineered Foam Market Size, By Material Type, 2014�2026 (USD Million)
Table 95 Middle East & Africa Engineered Foam Market Size, By Form, 2014�2026 (Kilotons)
Table 96 Middle East & Africa Engineered Foam Market Size, By Form, 2014�2026 (USD Million)
Table 97 Middle East & Africa Engineered Foam (FAME) Market Size, By End User, 2014�2026 (Kilotons)
Table 98 Middle East & Africa Engineered Foam Market Size, By End User, 2014�2026 (USD Million)
Table 99 New Product Launches, 2011�2016
Table 100 Expansions, 2011�2016
Table 101 Acquisitions, 2011�2016
Table 102 Agreements & Collaborations, 2011�2016
Table 103 Joint Ventures, 2011�2016
List of Figures (84 Figures)
Figure 1 Engineered Foam Market Segmentation
Figure 2 Engineered Foam Market: Research Design
Figure 3 Bottom-Up Approach
Figure 4 Top-Down Approach
Figure 5 Research Methodology: Data Triangulation
Figure 6 Polyurethane Estimated to Be The Largest Material Type Segment of The Engineered Foam Market in 2016
Figure 7 Flexible Foam Estimated to Be The Largest Form of The Engineered Foam Market in 2016
Figure 8 Aerospace & Defense and Medical & Healthcare Industries Set to Drive The Global Engineered Foam Market
Figure 9 Engineered Foam Regional Market Share, By Value (2016) & CAGR (2016�2021)
Figure 10 Engineered Foam Market, By End User
Figure 11 Engineered Foam Market, By Form
Figure 12 Engineered Foam Market, By Region
Figure 13 Drivers, Restraints, Opportunities, & Challenges in The Engineered Foam Market
Figure 14 Engineered Foam � Cost Structure Analysis
Figure 15 Increasing Demand From Various End Users Projected to Fuel Growth of Engineered Foam Market During Forecast Period
Figure 16 Asia-Pacific Projected to Witness Highest Growth Between 2016 and 2021
Figure 17 Aerospace & Defense and Polyurethane Segments Contributed Major Shares to The Global Engineered Foam Market
Figure 18 India Projected to Grow at Highest CAGR During Forecast Period
Figure 19 Asia-Pacific: Largest Market for Engineered Foam, 2015
Figure 20 Spray Foam Segment Projected to Witness Highest Growth From 2016 to 2021
Figure 21 Flexible Foam Segment Projected to Witness Highest Growth in Asia-Pacific From 2016 to 2021
Figure 22 The Rising Demand From End Users Projected to Influence The Growth of The Rigid Foam Segment From 2016 to 2021
Figure 23 Asia-Pacific Projected to Drive The Spray Foam Segment During The Forecast Period
Figure 24 Polyurethane Segment Projected to Drive The Engineered Foam Market, 2016 & 2021
Figure 25 Asia-Pacific Projected to Lead The Polyurethane Segment of The Engineered Foam Market By 2021
Figure 26 Asia-Pacific Projected to Lead The Polystyrene Segment of The Engineered Foam Market By 2021
Figure 27 Asia-Pacific Projected to Lead The Polyvinyl Chloride Segment By 2021
Figure 28 Asia-Pacific Projected to Lead The Polyolefin Segment of The Engineered Foam Market By 2021
Figure 29 Asia-Pacific Projected to Lead The Other Engineered Foams Segment By 2021
Figure 30 Aerospace & Defense Segment in Asia-Pacific Projected to Grow at The Highest CAGR During The Forecast Period
Figure 31 Transportation Segment in Asia-Pacific Projected to Grow at The Highest CAGR Between 2016 and 2021
Figure 32 Manufacturing & Construction Segment in Asia-Pacificprojected to Grow at The Highest CAGR Between 2016 and 2021
Figure 33 Medical & Healthcare Industry in The Asia-Pacific Region Anticipated to Grow at The Highest CAGR Between 2016 and 2021
Figure 34 Other End Users in Asia-Pacific Anticipated to Grow at The Highest CAGR Between 2016 and 2021
Figure 35 Engineered Foam Market, By Region, 2015
Figure 36 Asia-Pacific Engineered Foam Market Snapshot, 2015
Figure 37 China Engineered Foam Market, 2016 & 2021
Figure 38 Japan Engineered Foam Market, 2016 & 2021
Figure 39 India Engineered Foam Market, 2016 & 2021
Figure 40 Indonesia Engineered Foam Market, 2016 & 2021
Figure 41 Rest of Asia-Pacific Engineered Foam Market, 2016 & 2021
Figure 42 Europe Engineered Foam Market Snapshot, 2015
Figure 43 Germany Engineered Foam Market, 2016 & 2021
Figure 44 France Engineered Foam Market, 2016 & 2021
Figure 45 The U.K. Engineered Foam Market, 2016 & 2021
Figure 46 Spain Engineered Foam Market, 2016 & 2021
Figure 47 Italy Engineered Foam Market, 2016 & 2021
Figure 48 Czech Republic Engineered Foam Market, 2016 & 2021
Figure 49 Russia Engineered Foam Market, 2016 & 2021
Figure 50 Rest of Europe Engineered Foam Market, 2016 & 2021
Figure 51 North America Engineered Foam Market Snapshot
Figure 52 U.S. Engineered Foam Market, 2016 & 2021
Figure 53 Canada Engineered Foam Market, 2016 & 2021
Figure 54 Mexico Engineered Foam Market, 2016 & 2021
Figure 55 Latin America Engineered Foam Market Snapshot
Figure 56 Brazil Engineered Foam Market, 2016 & 2021
Figure 57 Argentina Engineered Foam Market, 2016 & 2021
Figure 58 Rest of Latin America Engineered Foam Market, 2016 & 2021
Figure 59 Middle East & Africa Engineered Foam Market Snapshot
Figure 60 Saudi Arabia Engineered Foam Market, 2016 & 2021
Figure 61 South Africa Engineered Foam Market, 2016 & 2021
Figure 62 Rest of The Middle-East & Africa Engineered Foam Market, 2016 & 2021
Figure 63 New Product Launch is The Key Strategy Adopted By Key Companies
Figure 64 Key Growth Strategies in Engineered Foam Market, 2011�2016
Figure 65 Bayer AG is The Leader in Growth Strategy Between 2011-2016
Figure 66 The DOW Chemical Company Held Largest Share in Engineered Foam Market in 2015
Figure 67 Engineered Foam Market Developmental Share, 2011�2016
Figure 68 Geographic Revenue Mix of The Top Five Market Players
Figure 69 BASF SE: Company Snapshot
Figure 70 BASF SE: SWOT Analysis
Figure 71 The DOW Chemical Company: Company Snapshot
Figure 72 The DOW Chemical Company: SWOT Analysis
Figure 73 Bayer AG: Company Snapshot
Figure 74 Bayer AG: SWOT Analysis
Figure 75 Sekisui Chemical Co., Ltd.: Company Snapshot
Figure 76 Sekisui Chemical Co., Ltd: SWOT Analysis
Figure 77 Huntsman Corporation: Company Snapshot
Figure 78 Huntsman Corporation: SWOT Analysis
Figure 79 Trelleborg AB: Company Snapshot
Figure 80 Trelleborg AB: SWOT Analysis
Figure 81 Recticel NV/Sa: Company Snapshot
Figure 82 Armacell GmbH: Company Snapshot
Figure 83 Rogers Corporation: Company Snapshot
Figure 84 UFP Technologies, Inc.: Company Snapshot


Growth opportunities and latent adjacency in Engineered Foam Market